LINK Mobility Group ASA - CEO Den store selskapskvelden 6.juni 2018 Arild E.Hustad - AksjeNorge

Page created by Erik Morales
 
CONTINUE READING
LINK Mobility Group ASA - CEO Den store selskapskvelden 6.juni 2018 Arild E.Hustad - AksjeNorge
LINK Mobility Group ASA
    Den store selskapskvelden 6.juni 2018

               Arild E.Hustad
                    CEO
LINK Mobility Group ASA - CEO Den store selskapskvelden 6.juni 2018 Arild E.Hustad - AksjeNorge
LINK Mobility            What does Link do?
                                                  Link makes businesses mobile across all
                                                  messaging platforms

                         – the undisputed,        How?
                                                  Linking businesses to consumers,
                                                  sending 6 billion B2C messages in
                                                  2017, reaching +200 million unique
                                                  mobile users on behalf of more than

                         market leading mobile
                                                  16,500 customers

                                                  Where?
                                                  Link is in 15 European countries, and

                         messaging and solution   the market leader in in the Nordics,
                                                  Germany, Spain and Poland

                                                  What next?

                         provider                 Execute ambitious M&A and organic
                                                  growth strategy, attain scaling synergies
                                                  and drive profitability

Copyright 2017 LINK Mobility                 2
LINK Mobility Group ASA - CEO Den store selskapskvelden 6.juni 2018 Arild E.Hustad - AksjeNorge
LINK Mobility key figures

           2018 outlook
                                                                                                                                                                15
                  2.7bn                                 revenue
                                                        (54% growth)

                                                           …
                                                                                                              …
                                                                                                                            18                                    countries with
                                                                                                                                                                  leading positions
                                                                                                              acquisitions                                            …                                                                           1

                  400m                                  EBITDA
                                                        (14.8% margin)
                                                                                                              since 2014
                                                                                                                                                                                                                 1
                                                                                                                                                                                                                      …      1

                                                                                                                                                                                                                  1
                               …
                                                                                 …                                                                                                                                                   1
                                                                                                                                                                                                                      1

                    320                                   >17,000                                                             24%                                                                                1

                                                                    customers                                                   average
                                                                                                                                organic
                                                                                                                                                                                                                                                 1
                   employees                                                                                                                                                                 1

                    across 15                                                                                                growth L8Q
                    countries
      1)      Pro forma guidance for 2018 revenue and EBITDA, including full year effect of acquisitions. Revenue growth relates to growth versus 2017 pro forma figures. The above outlook for 2018 is calculated on LINK’s best estimate based on
              information available to LINK, and views and assessment of LINK, as of the date of this report. LINK’s growth assumptions may deviate from the outcome resulting in material or immaterial deviations from the outlook. Further, LINK’s
              assumption relating to successfully acquire further businesses during 2018 is to a great extent outside the control of LINK. LINK’s ability to successfully acquire new businesses at fair value, or at all, could materially affect the outlook
              figures correspondingly. Investors must therefore make their own calculation in relation to valuing LINK based on their own analysis and judgement
Copyright 2017 LINK Mobility                                                                                                          3
LINK Mobility Group ASA - CEO Den store selskapskvelden 6.juni 2018 Arild E.Hustad - AksjeNorge
Successfully LINKing enterprises with consumers

                                                    Appointments

                                                                        …but businesses are struggling to navigate
                                                                          through the increased complex mix of
                                                    Polls
                                                                           devices, platforms, technologies and
                               …revenue
                                                                                        regulations
                               growth…              Loyalty
                                                    programs

                                     …customer      Parcel
                                    interaction &   notifications
                                       loyalty…
            Enterprise use                          Alerts
           mobile solutions
             to increase…
                                     …customer      Chat
                                    satisfaction…
                                                    Payments

                                   …cost                                    Link provides a platform agnostic,
                                                    Updates
                                 savings…                                  integrated messaging solution that
                                                                            seamlessly finds the most efficient
                                                    Invoices                communication platform to fit the
                                                                                 customer’s requirements

Copyright 2017 LINK Mobility                                        4
LINK Mobility Group ASA - CEO Den store selskapskvelden 6.juni 2018 Arild E.Hustad - AksjeNorge
Fully integrated services and solutions offering driving growth

                                                           Product description          Business model             Share of revenues1            COGS

                                                           Enriched mobile            Monthly messaging                                    Fee to mobile
                                                                                                                              86%
                                                            messaging and omni          platform license fee                                  operators and
                                                      1     channel solutions          Revenue per             Double-digit growth rate     other channel
                                                                                        message                                               owners
                                                                                                                Recurring, scalable
                                                                                                                 revenue
                           Mobile     Mobile               Mobile payment and         Monthly license fee             14%
                                                                                                                                             Limited
             3       Intelligence     Messaging   1
                                                            licenses                   Revenue per mobile
                                                           Customer club, mobile       solution transaction
                                                      2
                                                            invoice, notifications,
                                                                                                                Recurring and sticky
                                                            authentication and
                                                                                                                 revenue, high margins,
                                Mobile                      Joyn
                               Solutions                                                                         highly scalable

                                  2                        Making mobile                                       Revenue from 2018           Limited
                                                      3     messaging more
                                                            powerful by data
                                                            harvesting and analysis

Copyright 2017 LINK Mobility                                                             5
LINK Mobility Group ASA - CEO Den store selskapskvelden 6.juni 2018 Arild E.Hustad - AksjeNorge
Strong organic growth combined with M&A
            Revenue growth 2013 – 2018E
               NOKm                                                                                                                                                                                                              2,700

                 Reported revenue                                                                                                                                                                                              Estimated
                                                                                                                                                                                                                               annualized
                 Proforma effect
                                                                                                                                                                                                                               M&A effect3

                                                                                                                                                                                                                              Estimated
                                                                                                                                                                                                 1,754                      organic growth

                                                                                                                                                                                                                             Revenue run-
                                                                                                                                                                                                                             rate end 2017
                    2007-2012                                                                                                                                                                   1 294

                                                                                                                                                                622

                                                                                                                                361
                                                                                              161
                                                            136

                                                            2013                              2014                             2015                             2016                            2017PF                          2018 Est

          1)      Reported revenue growth from 2013 to 2017. Organic growth based on average organic growth across the period
          2)      2018 outlook represents year-end revenue run-rate based on the assumptions of organic growth of 25% on the 2017 pro forma revenue run-rate and acquisitions representing NOK ~500m in full year revenues. Note that a term sheet to
                  acquire SMS.it was disclosed in late January and is not included in the 2017 pro forma revenue run-rate
          3)      Please note that Link Mobility has signed terms sheets with SMS.it and Allterco regarding the Teracomm assets, i.e. the acquisitions are not closed
Copyright 2017 LINK Mobility                                                                                                    6
LINK Mobility Group ASA - CEO Den store selskapskvelden 6.juni 2018 Arild E.Hustad - AksjeNorge
Nordic innovation driving European sales
                                                 Early adopters                                          Late majority

                               Travel         Financials        Retail      TMT        Travel         Financials         Retail           TMT

                                                                            +                                                             +
                               Public          Logistics       Industry     Other      Public         Logistics         Industry         Other

                                                                                    Norway historically been an early
                                                                                    adopter of technology

                                                                                                                   Significant potential from
              Status and                                                                                           vertical penetration
              maturity of
              the mobile
              messaging                 Market development in other
                market                  European countries assessed to be
                                        ~4 years behind Norway                             Market development in the Nordics
                                                                                           assessed to be ~1-2 years behind
                                                                                           Norway

            Source: Management estimates

Copyright 2017 LINK Mobility                                                                                               7
LINK Mobility Group ASA - CEO Den store selskapskvelden 6.juni 2018 Arild E.Hustad - AksjeNorge
Significant revenue potential from increased market penetration

               Number of mobile messages per capita (NOK)1                                                            Market size ’17E                 Population2    Market potential

                      Norway                                                                           362                 NOK ~700m                         5.1m       NOK ~1.3bn
                         Spain              48                Volume increase                                              NOK ~500m                        46.4m        NOK ~3bn
                   Germany                37                                                                               NOK ~1.3bn                       82.1m       NOK ~11bn
                   Denmark                                                 213

                     Sweden                                          181

                      Finland                           109

                       Poland                     74

                       Austria
                                                                                                                                       Nordics ahead in B2C messaging penetration
                                                 71
                                                                                                                                   compared to Europe. Substantial revenue potential
                       France                    68
                                                                                                                                    from volume growth across existing Link markets
                           Italy             54

               Switzerland                  48

                     Bulgaria              39

             1)      Company input and Mobilesquared Global A2P messaging traffic 2018
             2)      Worldometers European Countries by population 2018 (http://www.worldometers.info/population/countries-in-europe-by-population/)

Copyright 2017 LINK Mobility                                                                                                   8
LINK Mobility Group ASA - CEO Den store selskapskvelden 6.juni 2018 Arild E.Hustad - AksjeNorge
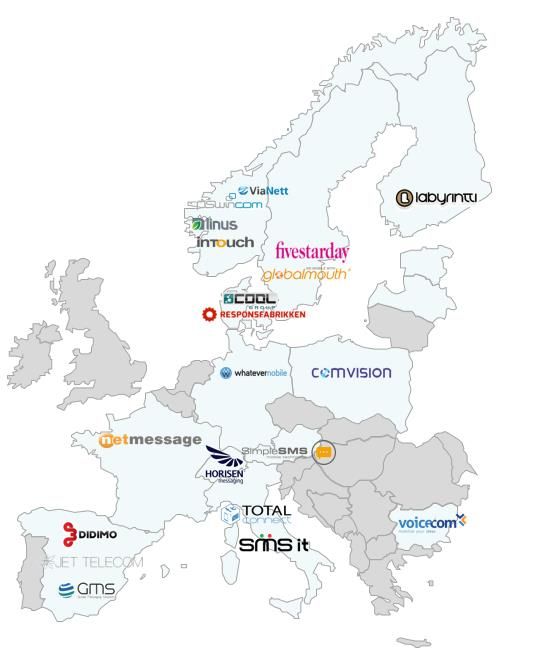
Mobile messaging market expected to continue growing in double digits

            Global and Western European messaging volume                                                     SMS is still the preferred and superior B2C solution
            Billion messages sent per year1
                                                                                                               SMS     98 % read rate, compared to email, Facebook and
                 Worldwide                                             Western Europe
                                                                                                                       tweets with 20%, 12% and 29%, respectively

                                                              2 381
                                     CAGR
                                      22%
                                                                                                                       90% opened within 3 minutes
                                                      2 127
                                              1 923                                  CAGR
                                      1 697                                           14%           67
                                                                                               60
                                                                                                                       Average response time 90 seconds
                           1 432
                                                                                          53
                                                                                     46
                                                                               41                                      Reliable – independent of platform, network, device,
                  875                                                   35                                             apps, internet access.

                                                                                                                       More than 6.1bn frequent users

                                                                                                                       Safe communication platform
                  17E          18E    19E     20E     21E     22E      17E 18E 19E 20E 21E 22E

          1)      Mobilesquared Global A2P messaging forecast by country 2017-2022
9
Copyright 2017 LINK Mobility                                                                             9
LINK Mobility Group ASA - CEO Den store selskapskvelden 6.juni 2018 Arild E.Hustad - AksjeNorge
Geographically diversified, low customer concentration and insignificant churn

            Geographically diversified                                            Low customer concentration                        Insignificant churn
           Revenue by geography, Q4 2017                                          Top 30 customers percent of gross margin, 20171   Norway: Loss of recurring revenue to total revenue (%)2

                Norway                                                29%

               Germany                                     21%

                   Spain                         14%                                                                                       2,2%               2,3%

               Sweden                        10%
                                                                                                                  24%                                                           0,6%
                 Poland                  8%

               Denmark                  7%
                                                                                                                                           2015               2016              2017
                 France             5%

                Finland             4%

               Bulgaria          2%

                 Baltics       0%
                                                                                                                                        Link gateway solutions are
                                                                                        Low customer concentration                   implemented in customer’s CRM
                Over 17 000 customers across                                             and well-diversified across
                   15 countries in Europe                                                                                             system, creating high switching
                                                                                           sectors and geography                                   costs

          1)      Average of the top 30 customers across four quarters for 2017
          2)      Churn measured for the 100 largest customers in Norway
Copyright 2017 LINK Mobility                                                                                 10
Market dynamics favour market leaders

            LINK is the unrivalled European market leader

                                                                                       1         As the market leader, LINK is in a highly attractive
                                                                                                   position with several competitive advantages
                                                                                               Market visibility               Broader service offering
                                       1
                                                                             1                 R&D competence and technologic  Facilitating for multinational clients
                                                                                                leadership
                                                        1                                                                       Leverage to suppliers
                                                                                               Technology sharing
                                                1

                                                                 1
                                                1                                           Significant economies of scale realised by leveraging the position as market leader
                                                                                             with >6bn messages sent¹
                                           1                                                Attractive position towards new clients with a demonstrated track record of
                                                                                             working with large and reputable regional and international clients
                                                                                            Substantial cost synergies across subsidiaries and geographical markets
                                                                       1

                      1

          1)      Pro forma including full year effect of companies acquired in 2017
Copyright 2017 LINK Mobility                                                                         11
Innovation driving revenue and differentiation
             New and innovative services                                                   Next generation messaging                                                    Upgrade SMS with rich media

                                                                                                                          +

                                                                                                             RCS1 Early Access Program

           1)      Early Access Program from Google for RCS business messaging. RCS business messaging uses RCS (Rich Communication Services) to upgrade business SMS with rich media, interactivity, branding and better analytics

Copyright 2017 LINK Mobility                                                                                                 12
LINK Conversations to be launched in July 2018

                                                  Release 1.0 – Ultimo June 2018                             Release 1.x – Q3 2018
             •    Channels: RCS via Googles RBM API, depending on coverage in Europe, Web Client
             •    Business Information Page                                                         • Carousels of Rich Cards
             •    Text (bi-directional)
             •    Suggestions                                                                       • Media (inbound)
             •    Suggested actions (e.g. create calendar item, location request, phone call, …)
             •    Media (outbound: picture, video, audio)                                           • Mobile invoice (Release 2.0 - 2019)
             •    Rich Cards

Copyright 2017 LINK Mobility                                                                   13
LINK Mobile Invoice

                                         •        Great interest for LINK mobile invoice in
                                                  several of our markets; Spain, Bulgaria,
                                                  Germany as well as the Nordics

                                         •        Strong growth in number of transactions

                                         •        36 contracts signed to date and a strong
                                                  salespipe of 120 prospects

                                         •        Agreement with BankBridge to enable direct
                                                  customer account debiting throughout
Copyright 2017 LINK Mobility                 16

                                                  Europe
LINK drives European consolidation
           Significant experience acquiring assets across W. Europe                                                               Established acquisition criteria and structure

                   Limited competition for targets, due to lack of                                                                  Strong local market position
                   companies with scale and well developed                                                                          Cash positive, i.e. no turnaround cases and cash
                   platforms                                                                                                         flow to LINK from day one
                                                                                                                                    Solid, well-diversified customer portfolios
                                                                                                                                    Churn below 3%
                     Proven value-creating
                      acquisition strategy
                                                                                                                                    ~80% overlapping technology
                                                                                                                                    Strong telecom operator relationships
                          All companies acquired have

                         been purchased at attractive
                          multiples (average of ~6.2x
                          EV/EBITDA)                                                                                                         Typical financing structure
                          Attractive synergy potential
                         utilized, driving strong margin
                          expansion
                                                                                                                                                      Historically financing has consisted of
                                                                                                                                                       1/3 cash, 1/3 seller’s credit and 1/3
                                                                                                                                     LINK
                                                                                                                                              Cash     shares in LINK Mobility Group ASA1
                                                                                                                                    shares

                         Proven successful
                          integration                                                                                                  Seller’s       Shares and cash settled at closing
                                                                                                                                       Credit          while sellers credit has historically
                                                                                                                                                       had a tenor of 3 years

         1)      The financing structure for future acquisitions will be tailored and optimized to each specific situation
Copyright 2017 LINK Mobility                                                                                                 17
Significant benefits gained from consolidation and scaling

                                                                  COGS savings
                                     One LINK Messaging           •   Consolidate local
                                                                                                    Annual recurring
                                           Platform                   platforms and solutions      synergies of NOK
                                                                  •                               50-70m from end of
                               +                                  •
                                                                      Terminate local products
                                                                      and services
                                                                      Joint support, operations
                                                                                                         2019
                                                                      and routing
                                                                                                  Delivered NOK 17m
                                       One LINK Services                                                in 2017
                                      Application Platform
                                                                                                  Plan to deliver NOK
                                                                                                    30-40m in 2018
                                                                  Capex savings
                                                                  •   Common products and
                                                                      services                     EBITDA margin
                                      One LINIK Common            •   Cost efficient Bulgarian
                                                                                                  contribution of 2-3
                                        Routing Team                  development hub                    p.p

Copyright 2017 LINK Mobility                                 18
Strong revenue and profitability performance
           Revenue evolution                                                                  Organic growth evolution                                   EBITDA evolution              1

          Reported revenue (NOKm)                                     Y-o-y growth             Organic growth y-o-y                                      Adjusted EBITDA (NOKm)                  EBITDA margin

              53%        58%   43% 115% 107% 126% 129%                      89%                                                                            9.1% 13.7% 8.0% 11.7% 7.3% 10.8% 10.8% 12.5%

                                                                            486                                                                                                                         61
                                                                                                 30%                  29%

                                                                                                                                 25%               25%
                                                                                                                                       23%
                                                                                                                                             22%
                                                                                                          20%
                                                                   298                                          19%
                                                          281
                                        256                                                                                                                                                      32
                                                 229                                                                                                                              30        30

                         125    130                                                                                                                               17                   17
               111
                                                                                                                                                            10           10

              Q1'16 Q2'16 Q3'16 Q4'16 Q1'17 Q2'17 Q3'17 Q4'17                                   Q1'16 Q2'16 Q3'16 Q4'16 Q1'17 Q2'17 Q3'17 Q4'17           Q1'16 Q2'16 Q3'16 Q4'16 Q1'17 Q2'17 Q3'17 Q4'17

         1)      Adjusted for costs related to acquisitions, one-off costs and share based compensation

Copyright 2017 LINK Mobility                                                                                                19
Continued strong growth in revenues in Q1

                                                                                                                                                      Operating revenues
                                                                                                                                                           (NOKm)
                         –     Revenues of NOK 467 (23% organic growth & 104% total                                                                                      104%
                                                                                                                                                                                       486
                               growth)                                                                                                                                                              467

                                                                                                                                              281              298
                         –     An adjusted EBITDA of NOK 51m (10,9%) up from NOK 17                                         229

                                                                                                                            25%              23%               22%                     25%          23%
                         –     1,6 billion transactions and interaction with more than
                               205 million unique mobile phones                                                           Q1 2017           Q2 2017          Q3 2017                 Q4 2017      Q1 2018
                                                                                                                                                          = Organical growth QonQ

                         –     17 000 customer and signed 658 new contracts of which                                                                  Adjusted EBITDA
                                                                                                                                                          (NOKm)
                                                                                                                                                                                       61

                               384 new customers                                                                                                                                                   51

                         –     High acquisition activity                                                                                      30               32

                                                                                                                             17

                         –     Continued strong performance in all our markets                                             7,3%             10,8%            10,8%                  12,5%         10,9%

                                                                                                                          Q1 2017          Q2 2017          Q3 2017                 Q4 2017    Q1 2018
                                                                                                                                                            = Adjusted EBITDA margin

                                                                subsidiaries as reported in first quarter in 2017. Acquired business inlude the acquisition of Didimo-Jet Group, GMS, Voicecom,
Copyright 2017 LINK Mobility                                                                        20
Considerable scale advantages visible in Q1 2018
                                                 Adjusted EBITDA% development
                                                             QonQ                                                         Substantial scale advantages in business model
                                                                                                  0,2 %
                                                                                   1,4 %
                                                                                                                          § +4.3 percentage points increased margin from scale advantages
                                                                                                                            offsetting gross margin reduction of -2.0 percentage points in
                                                                    4,3 %
                                                                                                                 10,9 %     existing markets
                                                                                                                          § High organic growth is expected to drive scale advantages going
                                   -2,0 %
                   7,3 %
                                                   -0,3 %
                                                                                                                            forward
                   Q1 17       GM1 pr market      GM1 mix         Delta OPEX    Delta OPEX     Margin effect     Q1 18
                                               Existing markets                     Group        Aquired                  § Future acquisitions will further strengthen scale advantages
                                                                                  functions      entities

                Existing markets are defined as the subsidiaries as reported in first quarter in 2017. Acquired business inlude the acquisition of Didimo
                                                 Adjusted EBITDA             61
                                                      (NOKm)
                                                                                                                 51       Scale advantages counteract gross margin reduction

                                                                       32
                                                                                                                          § High growth from large enterprises customers drives scalability
                                                30
                                                                                                                            further, positive gross profit and no additional OPEX
                         17
                                                                                                                          § Dilutes gross margin in existing markets as large enterprise
                        7,3%                 10,8%                  10,8%                12,5%                 10,9%        customers have lower margins than SME customers
                      Q1 2017               Q2 2017                Q3 2017              Q4 2017                Q1 2018
                                                                                                                          § Acquired entities have lower gross margin than existing markets
                                                                    = Adjusted EBITDA margin

n 2017. Acquired business inlude the acquisition of Didimo-Jet Group, GMS, Voicecom,

    Copyright 2017 LINK Mobility                                                                                                    21
Asset light business model
              Low working capital requirements                                               Low investment requirements                                      High cash conversion
             Net working capital and share of revenue1 (NOKm)                                Quarterly capital investments and share of revenue2 (NOKm)       Cash conversion: Average last three years3

                  Q1'16 Q2'16 Q3'16 Q4'16 Q1'17 Q2'17 Q3'17 Q4'17                                                                                      19,9

                                                                            -2%
         -        -4%                                                                -
                                          -7%              -6%      -6%
                          -7%
         -                                                                                                                               14,5
                  -17,9                           -11%                               -
         -                        -14%
                                                                           -27,9     -
                          -32,9                                                                                                                 10,7
         -
                                                                                     -                   8,6           9,1        8,7
         -                                -42,6                                                                                                                                          87%
                                                                                                                6,9
                                                                                     -
         -                                                 -53,9
                                                                                                 3,9    1,9%
                                                                   -62,6             -
         -                        -65,7                                                                         1,4%   1,5%              1,6%          1,5%
                                                                                                                                  1,2%
                                                                                                1,0%                                            1,0%
         -                                                                           -
                                                  -79,3
         -                                                                           -
                                                                                               Q1'16 Q2'16 Q3'16 Q4'16 Q1'17 Q2'17 Q3'17 Q4'17
                          Net working capital               Share of revenue                                   CAPEX               Share of revenue

             1)     Net working capital: (trade receivables – trade payables – tax payables)
             2)     CAPEX: Investments excl. acquisitions
             3)     Cash conversion: Net cash flow from operations to adjusted EBITDA (average FY’15-FY’17)

Copyright 2017 LINK Mobility                                                                                                 22
Delivering on the 2018 outlook
              LTM Revenue evolution                                                                                                                                                                                       2018 Outlook (NOK)2
           LTM per. quarter, NOKm                                                                                                                                                           3
                                                                                                                                                                                                            2 700

                                                                                                                                        1 065
                                                                                                                                                     1 294
                                                                                                                                                               1 754
                                                                                                                                                                                                                                    €                 2,700m
                                                                                                                 740         897                                             25%
                                                                                                                                                                                            +500m in                                                  Pro forma revenue
                                                                             445          485        622                                                                    organic
                                                                                                                                                                                           acquisitions
                               236          289      361         400                                                                                                        growth
                  198

                  Q1           Q2           Q3       Q4          Q1          Q2           Q3         Q4          Q1          Q2           Q3          Q4         Q4
                                                                                                                                                                2017                                        2018
                                     2015                                          2016                                            2017                         Pro
                                                                                                                                                               forma
                                                                                                                                                                          Organic
                                                                                                                                                                          growth
                                                                                                                                                                                            M&A            outlook                                       400m
                                                                                                                                                                                                                                                      Pro forma EBITDA

              LTM Adjusted EBITDA1 evolution
           LTM per. quarter, NOKm
                                                                                                                                                                                                            400
                                                                                                                                                                                                                                                           25%
                                                                                                                                                                                                                                                        Organic growth
                                                                                                                                                                           209
                                                                                                                                                              140
                                                                                                                                     87          109                                  25% organic growth

                                                         49           51           54           52          67          74                                                               Acquisitions
                   33           40           48
                                                                                                                                                                                         3%-p margin
                                                                                                                                                                                         improvement

                   Q1           Q2           Q3         Q4           Q1            Q2           Q3         Q4           Q1           Q2           Q3          Q4           Q4
                                                                                                                                                                         2017                               2018                                            8bn
                                     2015                                               2016                                              2017                            Pro                              outlook                                     Mobile messages
                                                                                                                                                                         forma

         1)      Adjusted for costs related to acquisitions, one-off cost and share based compensations
         2)      Pro forma revenue and EBITDA outlook figures. Includes full year effect of acquisitions. The above outlook for 2018 is calculated on LINK’s best estimate based on information available to LINK, and views and assessment of LINK, as of the date of this report.
                 LINK’s growth assumptions may deviate from the outcome resulting in material or immaterial deviations from the outlook. Further, LINK’s assumption relating to successfully acquire further businesses during 2018 is to a great extent outside the control of LINK.
                 LINK’s ability to successfully acquire new businesses at fair value, or at all, could materially affect the outlook figures correspondingly. Investors must therefore make their own calculation in relation to valuing LINK based on their own analysis and judgement
         3)      Please note that Link Mobility has signed terms sheets with SMS.it and Allterco regarding the Teracomm assets, i.e. the acquisitions are not closed

Copyright 2017 LINK Mobility                                                                                                                    23
Key investment highlights

                               The #1 European mobile messaging and mobile solutions company – well protected by high
                      1        barriers to entry

                               Annual organic growth of 20+%, backed by strong underlying market growth through increased
                      2        European mobile messaging penetration

                               The European consolidator with a proven roll-up acquisition model in a fragmented market with
                      3        attractive benefits of scale

                               Highly scalable and asset light business model with ~90%+ recurring revenues and ~90% cash
                      4        conversion

                      5        Experienced management team ready to take LINK Mobility to the next level

Copyright 2017 LINK Mobility                                             24
Thank you

www.Linkmobility.com
You can also read