2021 Half Year Results Presentation - TI Fluid Systems plc 9 August 2021 - TI Fluid Systems ...
←
→
Page content transcription
If your browser does not render page correctly, please read the page content below

2021 Half Year Results Presentation
TI Fluid Systems plc
9 August 2021

Disclaimer
This presentation contains certain forward-looking statements with respect to
the financial condition, results of operations and business of TI Fluid Systems
plc (the “Company”). The words “believe”, “expect”, “anticipate”, “intend”,
“estimate”, “forecast”, “project”, “will”, “may”, “should” and similar expressions
identify forward-looking statements. Others can be identified from the context
in which they are made. By their nature, forward-looking statements involve
risks and uncertainties, and such forward-looking statements are made only
as of the date of this presentation. Accordingly, no assurance can be given
that the forward-looking statements will prove to be accurate and you are
cautioned not to place undue reliance on forward-looking statements due to
the inherent uncertainty therein. Past performance of the Company cannot be
relied on as a guide to future performance. Nothing in this presentation should
be construed as a profit forecast.
The financial information in this presentation does not contain sufficient detail
to allow a full understanding of the results of the Company. For more detailed
information, please see the half year results announcement for the six months
ended 30 June 2021.

                                                                                     2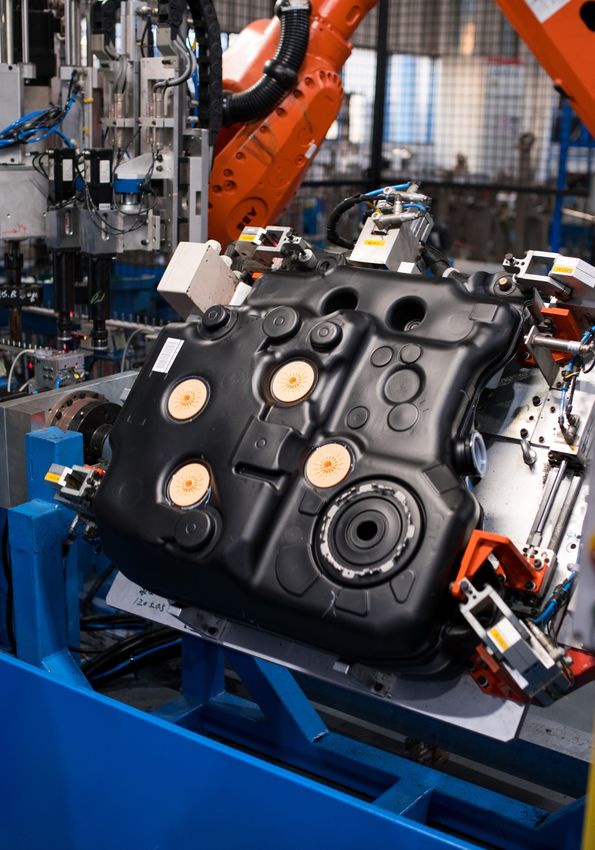
Agenda

     1   Key Highlights

     2   Fluid EVolution

     3   Finance

     3   Q&A

                           3
Key Highlights

                 4
Key Investment Propositions

       Experienced          Demonstrated above-           Significant growth      Strong revenue      Awarded the London
management team with          market growth with        opportunities aligned     growth, superior   Stock Exchange Green
 proven track record of     leading technologies,       with electrification of   margins and free       Economy Mark
    strong growth and           strong market           HEVs and BEVs and             cash flow
 financial performance       positions, global low-    TI’s strength in thermal      generation           Committed to
   and support of the      cost footprint (including   management systems                            significantly reduce our
      commitment to          China strength) and       and pressure resistant                        GHG emissions by 2039
enhanced diversity and          diversification             HEV fuel tanks
        inclusivity

                          Sustainable business model – ‘doing what we said we would do’
                                   and making the world a cleaner place to live
                                                                                                                                5
TIFS ESG Approach Update
TIFS is pleased to provide an update on its ongoing ESG focus and initiatives
• The Board established an ESG Steering Committee in March 2021 to provide direction and oversight
  of ESG strategy
• ISS Quality Score improvement will be used as one way to measure our overall ESG progress and is
  included as a vesting criteria of the Long-Term Incentive Plan
• Updated Greenhouse Gas (GHG) Reduction Target
    • Our target is to reduce our GHG emissions by 37.5% from our 2019 baseline by 2039
    • Target is based on absolute contraction approach, representing a reduction of 196k tonnes of
       CO2(e) Scope 1 and 2 combined emissions by 2039
    • Target is consistent with the Paris Agreement, is designed to meet the “Well Below 2 Degree”
       scenario and supports the UN Sustainable Development Goal 13 - Climate Action
• Various other ESG initiatives are underway – more to come

       Consistent with, and as an extension of, our updated GHG reduction target,
                     we ultimately aspire to become carbon neutral

                                                                                                     6
Key Highlights – 2021 Half Year Results
First half results demonstrate resilience with the ongoing light vehicle production recovery and volatile production schedules impacted by supply
chain disruption
Revenue continuing to outperform underlying global light vehicle production
• 3.5% outperformance above global light vehicle production volume increase of 29.2% versus prior period
Robust EBIT margin improvement despite volatile production schedules
(a)
• 8.4% Adj. EBIT margin
Significant Adj. Free Cash Flow generation
(b)
• €46 million in H1 2021
Continued execution of fixed cost reduction restructuring programme started in H1 2020
Successfully refinanced borrowings, reducing the weighted average cost of debt and extending debt maturities
Focus on highly engineered fluid storage, carrying and delivery systems for light vehicles
• Approximately 50% of first half 2021 total new business wins were on electric vehicle platforms
• Awarded a high-volume pressure resistant plastic fuel tank programme with a Japanese supplier in Asia Pacific
• Successfully launching HEV and BEV vehicle programmes with European, North American and Asian OEMS across all major light vehicle
production regions
• Our successful transition to electrified vehicles is becoming more and more evident
a) Adj. EBIT defined as Adj. EBITDA less depreciation, amortisation and impairment arising on tangible and intangible assets net of depreciation and amortisation arising on purchase
price accounting
b) Adj. Free Cash Flow defined as cash generated from operating activities, less cash used by investing activities, adjusted for acquisitions, movements in financial assets at fair value
through the profit or loss, cash payments related to IPO costs and cash received on settlement of derivatives and restructuring cash spend
Presentation subject to rounding
7
H1 2021 vs H1 2020 Revenue and Vehicle Production
                                               Revenue Outperformance Continues

                                                        North America                         Asia-Pacific                                          Global
                                     (a)
                         Europe

 Region
                                                                                                                                                             ~ 350 bps above
                                                                                                                                                             auto production

H1 2020 –       (b)

      (b)
 2021
                                                             Vehicle        TI
                         Vehicle       TI                                                    Vehicle
                                                           Production     Revenue                          TI                                Vehicle                  TI
                        Production   Revenue                                                Production   Revenue                                                    Revenue
                                                                                                                                            Production
                         (units)                             (units)
                                                                                             (units)                                          (units)
            •         Europe revenue 37.4% higher   •   North America revenue           •   Asia Pacific revenue 26.9%             •     Group revenue 32.7% higher
                      (or +9.0% above vehicle           30.7% higher (or -1.3%              higher (or -0.3% below                       (or +3.5% above vehicle
                      production)                       below vehicle production)           vehicle production)                          production)
            •         Successful launch of new      •   Strong revenue growth
                                                                                        •   Historic outperformance                •     Business model continuing to
                      business and favourable mix       offset by de-emphasis on
                                                                                            slowed down due to                           demonstrate consistent
                                                        powertrain and under-
                                                                                            programme ramp downs                         outperformance
                                                        indexation on full-size full-
                                                                                                                      a)   Europe vehicle production units include Africa and the Middle East
                                                        frame trucks and SUV                                          b)   Revenue at constant currency
                                                                                                                                                                                                8
                                                        platforms                                                     Source: July 2021 IHS Markit and company estimates
Fluid EVolution

                  9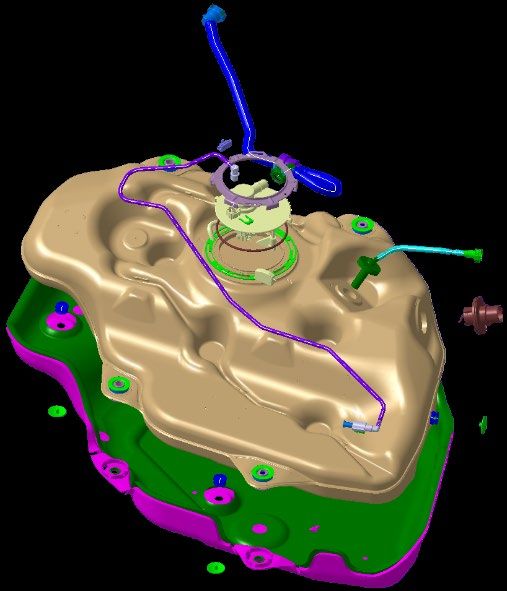
EV Wins Continue
                     EV Wins as % of Total Wins

                                                              • H1 2021 EV wins approximately
                                                                half of all total business wins for
                                                                the period

                                                              • Additional evidence of TIFS
                                                                electrification strategy
Non-EV wins                                                     progressing well
EV Wins
                         42%          47%          47%

              19%

              2018       2019         2020        2021 H1

     New business wins on EV continuing to support changing propulsion landscape – CPV’s on EV
                                       wins progressing well
                                                                                                      10
BEV Presence Robust
TIFS Content on Key BEV Launches
2021 – 2028a)
• Continued leading representation on 94
key BEV platforms identified by JP
Morgan to launch primarily in Europe
and North America between 2021 and
52% 2028
94
37% • 37% have TIFS thermal content with
12% of the 94 BEVs having TIFS
49 heat pump content
35
BEV Platform TIFS Content Thermal
Launches Content
2021 - 2028
TIFS thermal refrigerant and coolant product lines are well represented in key BEVs
a) JP Morgan Electric Cars – The EV Revolution is underway 6 April 2021, Content identified as having at least one TIFS product on specific key BEV platforms won and targeted to win 11HEV Fuel Tank Award
Leveraging our technology to continue to
drive share gain in HEV pressure resistant fuel tanks
• HEVs continues to offer CPV opportunity up to
€700 as an important element of our strategy
• We Continue to be awarded advanced
technology products required to reduce
emissions and improve fuel economy in hybrid
electric vehicles (HEV)
v
• Award of high-volume pressure resistant plastic
fuel tanks for a Japanese OEM HEV in Asia
Pacific
• TI’s unique technology, customer relationships,
global footprint and position as a leading fluid
systems provider contribute to securing new
HEV pressure resistant fuel tank new business
awards
12Finance
13Revenue Outperformance Continues
Continued outperformance of global vehicle production in the first half of 2021
Group Revenue (€m) Key Comments
YoY change +32.7% at constant currency
• Revenue increased by 32.7% at constant currency and by
28.7% at reported rates
• Global light vehicle production increase of 29.2%
• Revenue outperformance of + 3.5%
• Europe revenue continued to outperform regional vehicle
production
• Europe – 41% of the Group’s revenue with strong
BEV/HEV launch activity
• North America – 23% of the Group’s revenue; strong
revenue growth despite Powertrain de-emphasis
Global Auto Production (YoY) 29.2%
• Asia Pacific – 34% of the Group’s revenue broadly in line
with market growth
Source: July 2021 IHS Markit and company estimates 14Rapid Expansion of Adj. EBIT and Adj. EBITDA Margins
Margins rebound due to market recovery from COVID-19 impacts
Adj. EBIT (€m) (a) Key Comments
(a)
8.4% • Adj. EBIT of €128m or 8.4% margin
• Adj. EBIT 100m higher – 29.5% incremental impact
2.3%
• Global vehicle production volumes grew at 29.2%
• 350% increase in Adj. EBIT earnings
(b)
• Adj. EBITDA of €198m or 13.0% margin
Adj. EBITDA (€m) (b) • Strength of business model with ability to flex costs in
different volume environments
13.0%
9.3% • Maintaining commitment to financial resilience through all
economic cycles
• Restructuring plans commenced in 2020 continue to
be implemented in 2021
a) Adjusted EBIT is defined as Adjusted EBITDA less depreciation, amortisation and impairment arising on tangible and intangible assets net of depreciation and amortisation arising on purchase price accounting
b) Adjusted EBITDA defined as profit or loss before tax before net finance expense, depreciation, amortisation and exceptional impairment of tangible and intangible assets, net foreign exchange gains/(losses), net restructuring 15
charges and associate share of profits or losses and dividends received from associates.Segment Revenue and Adj. EBIT Margins
Both FCS and FTDS impacted by conversion on higher revenue
FCS Revenue (€m) FTDS Revenue (€m)
Adj. EBIT Margin 2.2% 8.6% Adj. EBIT Margin 2.5% 8.2%
• Revenue increase of 29.8% at constant currency • Revenue increase of 36.2% at constant currency
• At reported rates, YoY change of 24.9% • At reported rates, YoY change of 33.3%
• Adj. EBIT margin 640 basis points higher • Adj. EBIT margin 570 basis points higher
• YoY margin growth driven by market rebound from • Increase in margin reflects the conversion of higher
COVID-19 impacts particularly in Europe and Asia revenues as a result of recovery from COVID-19 impacts,
Pacific particularly in Europe and North America
16Adj. Net Income, Adj. Basic EPS and Dividend per Share
Adj. Basic EPS of 8.75 € cents with interim dividend of 1.93 € cents per share
Adj. Net Income Reconciliation (€m) Adj. Net Income (€m)
H1 2020 H1 2021
YoY change 214%
(Loss) / Profit for the Period (321) 11
Non-Controlling Interests (1) (1)
Net FX (Gains) / Losses (1) 8
Exceptional Asset Impairment 305 -
Exceptional Deferred Tax credit (29) (3)
Exceptional Finance expense - 12
Other Reconciling Items 7 18
(a)
Adj. Net Income (40) 45
Dividend (b)
Adj. Basic EPS (7.61) euro cents 8.75 euro cents
• 2021 interim dividend of 1.93 euro cents per share
• Payout of €10m on 519.3m shares outstanding
a) Adjusted Net Income defined as Profit or Loss for the period attributable to the ordinary shareholders before exceptional items adjusted to reflect associate dividends received and eliminate the impact of net restructuring
charges and foreign exchange gains or losses 17
b) Adjusted Basic EPS defined as Adjusted Net Income divided by the weighted average number of shares in issue in the periodAdj. Free Cash Flow Growth – Robust Business Model
Significant Adj. Free Cash Flow generation
Adj. EBITDA to Adj. Free Cash Flow Reconciliation (€m) Adj. Free Cash Flow (€m) (a)
1 H1 2020 H1 2021
Adj. EBITDA 110 198
Cash Interest (28) (23)
Cash Tax (21) (28)
Working Capital, Provisions and Other 42 (37)
PP&E and Intangibles (51) (64)
Cash Received on Settlement of Derivatives (17) -
• Able to maintain positive adjusted free cash flow
Adj. Free Cash Flow 35 46 generation through careful management of working
capital, tax and treatment of PP&E and intangibles
a) Adj. Free Cash Flow defined as cash generated from operating activities, less cash used by Investing activities, adjusted for cash movements in financial assets at fair value through the profit or loss, cash payments related to IPO
costs, net cash flows relating to restructuring and settlement of derivatives
18Strong Capital Structure and Liquidity
Capital Structure Evolution
€m Interest Rate Dec 2020 Jun 2021 Key Comments
Financial Liabilities
Secured Term Loan
US LIBOR+ 3.25%
Euribor + 3.25%
1,102 516 • Capital allocation priority remains on deleveraging
Unsecured Senior Notes 3.75% - 600 through free cash flow generation in the medium term
Revolver US LIBOR+ 3.25% 181 188
Unamortised Fees (25) (25)
• Refinancing carried out in April 2021
Total 1,258 1,279
(a)
Extended debt maturities
Cash and Cash Equivalents (487) (470)
Net Debt (exc revolver) 590 621 Issued inaugural European unsecured
Net Debt / Adj. EBITDA LTM 1.8x 1.5x
bond
Leverage (Net Debt / Adj. EBITDA)
Lowered weighted average cost of debt
a) Cash and cash equivalents includes financial assets at Fair Value Through Profit or Loss (“FVTPL”)
19H1 2021 Summary
TI Fluid Systems continuing to do what we say we will do
• Continue to protect health and safety of our employees and our sustainable business model
• Strong revenue outperformance of +350bps
• Robust Adj. EBIT of 8.4%
• Significant Free Cash Flow of €46m
• Strong balance sheet and cash position
• Electrification strategy progressing well
• Target to reduce our GHG emissions by 37.5% by 2039
Well positioned for 2021 and future opportunities 20Q&A
21Appendix
22High Level Income Statement
Adjustments to EBITDA and EBIT – non-cash and non-operational
Income Statement Summary Key Comments
€m H1 2020 H1 2021
Revenue 1,183 1,522 • Adjustments primarily relate to certain non-cash and non-
Adj. EBIT 28 128 operational expenses
Adj. EBIT % 2.3% 8.4%
PPA (28) (26) • Purchase Price Accounting (“PPA”) - depreciation and
D&A 110 96
amortisation arising on the fair value uplifts related to the
Adj. EBITDA 110 198
Bain Capital and Millennium acquisitions
Adj. EBITDA % 9.3% 13.0%
D&A (110) (96) • Net FX gains / losses - primarily FX impact from US to UK
Net FX Gains / (Losses) 1 (8) inter-company loans in USD
Exceptional Cost of Sales (305) -
Other Reconciling Items (8) (17) • Other Reconciling Items - primarily restructuring charges
(a)
Operating (Loss) / Profit (312) 77
incurred in the period
Net finance expense (41) (31)
Exceptional finance expense - (12)
Tax 3 (25)
Exceptional Deferred Tax Credit 29 3
Profit / (Loss) for the Period (321) 11
a) Other reconciling items include non-exceptional restructuring charges and adjustments for associate income 23Adj. Effective Tax Rate
Adj. Effective Tax Rate ~ 35%
Effective Tax Rate Adjustments (a) Key Comments
€m H1 2020 H1 2021 • Adjusted effective tax rate - approximately 35%
(Loss) / Profit before Income Tax (48) 45 • Adjustments to reported profit before tax – primarily
UK losses 43 26 relate to expenses in the UK that are either not deductible
Share of associate loss - 1 or not tax effected because of the UK loss position including
Adj. (Loss) / Profit before Income Tax (5) 72 interest, financing and operating costs
Income tax (credit)/charge (3) 25 • Adjustments to income tax – relate to changes arising in
Prior year tax provisions / adjustments 1 -
the year affecting items originally provided for in prior
Adj. Income Tax (2) 25
periods
Adj. Effective Tax Rate 41% 35%
a) Amounts shown exclude exceptional items
24You can also read