HY 2018 Results August 2018 Jeff Olsen - Chief Executive Officer - Half-year 2018 Results Presentation
←
→
Page content transcription
If your browser does not render page correctly, please read the page content below
MDR700 Drill Rig

HY 2018 Results
August 2018
Jeff Olsen – Chief Executive Officer
Important Notice and Disclaimer

 •   This presentation has been prepared by Boart Longyear Limited, ABN 49 123 052 728 (Boart Longyear or the Company).
     It contains general information about the Company’s activities as at the date of the presentation. It is information given in
     summary form and does not purport to be complete. The distribution of this presentation in jurisdictions outside Australia
     may be restricted by law, and you should observe any such restrictions.

 •   This presentation is not, and nothing in it should be construed as, an offer, invitation or recommendation in respect of
     securities, or an offer, invitation or recommendation to sell, or a solicitation of an offer to buy, securities in any jurisdiction.
     Neither this document nor anything in it shall form the basis of any contract or commitment. This presentation is not
     intended to be relied upon as advice to investors or potential investors and does not take into account the investment
     objectives, financial situation or needs of any investor. All investors should consider such factors in consultation with a
     professional advisor of their choosing when deciding if an investment is appropriate.

 •   The Company has prepared this presentation based on information available to it, including information derived from public
     sources that have not been independently verified. No representation or warranty, express or implied, is provided in
     relation to the fairness, accuracy, correctness, completeness or reliability of the information, opinions or conclusions
     expressed herein.

 •   This presentation includes forward-looking statements within the meaning of securities laws. Any forward-looking
     statements involve known and unknown risks and uncertainties, many of which are outside the control of the Company and
     its representatives. Forward-looking statements may also be based on estimates and assumptions with respect to future
     business decisions, which are subject to change. Any statements, assumptions, opinions or conclusions as to future
     matters may prove to be incorrect, and actual results, performance or achievement may vary materially from any
     projections and forward-looking statements.

 •   Due care and attention should be undertaken when considering and analysing the financial performance of the Company.

 •   All references to dollars are to United States currency unless otherwise stated, and financial results presented are not
     audited.

                                                                         HY 2018 Results – See page 17 for footnote descriptions            2
HY 2018 Highlights
- Strong improvement result of continued cost and productivity focus

                Industry leading safety performance
                ▪   LTIR – 0.15 (HY2017 – 0.20) 1
     Safety

                ▪   TCIR – 1.99 (HY2017 – 1.93) 1
                ▪   Focus to leading indicators to drive better safety outcomes

                Delivered on significant productivity improvements across the organisation
                ▪   15 additional rigs in the field (5%) and overall rig utilisation up 7%
  Performance

                ▪   Company-wide cost and productivity initiatives delivering improved margins
   Operating

                ▪   SG&A reduced by $10M YOY (18% reduction) despite 11% increased revenue
                ▪   Continued Investment in new technologies through the cycle;
                      ▪ Continued rollout of TruCore™ orientation tool,
                      ▪ Introduction of TruShot™ down-hole survey tool,
                      ▪ Deployment of TruScan™ on-site assay tool to multiple mining sites with exceptional results

                Stronger key financial metrics reflect efforts to improve the underlying business
  Performance

                ▪   6 consecutive quarters of financial and operational improvements.
   Financial

                ▪   Revenue up $38M (11%) to $394M driven by higher demand for services and products
                ▪   Adjusted EBITDA up $15M (71%) to $37M reflecting improved margins
                ▪   NPAT up $69M (81%) resulting in marginal loss of $16M compared to $85M YOY loss

                                                                    HY 2018 Results – See page 17 for footnote descriptions   3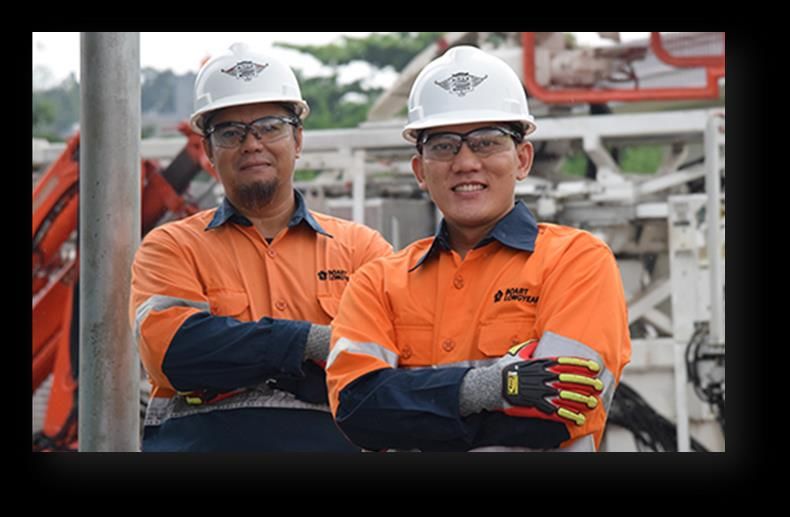
Drilling Services: HY 2018 Operations
- Productivity improvements leveraging higher volumes

                                                                                                                                           Change
                       ▪ Revenue - up 11% primarily from current clients expanding         Key Financials (US $M):   HY 2018   HY 2017
                                                                                                                                         Fav / (Unfav)
Financial Highlights

                         existing drilling campaigns
                                                                                           Revenue                    267       241          11%
                       ▪ EBITDA - up 14% driven by increased volume, improved
                                                                                           COGS                       227       209          (9%)
                         productivity and rig uptime
                       ▪ Pricing - seeing incremental but modest improvement in            SG&A                        12        15          18%
                         terms & price as utilisation rates increase across the industry
                                                                                           EBITDA                      39        34          14%
                       ▪ Commodities - gold and copper continue to drive revenues
                                                                                           EBITDA as % of Revenue     15%       14%

                       ▪ Operating Rigs3 - Average number of operating rigs
Operating Highlights

                         increased by 5% to 315 from 300
                       ▪ Rig Utilisation – Shifts per rig increased by 14% YOY
                         driving better utilisation of rigs
                       ▪ Metrics - KPI boards rolled out to all sites to monitor and
                         report on customer focused metrics
                       ▪ Onboarding - Implemented new onboarding training
                         packages focused on identifying site hazards and risks
                       ▪ Regions - significant improvements seen in APAC / EMEA.

                                                                                     HY 2018 Results – See page 17 for footnote descriptions        4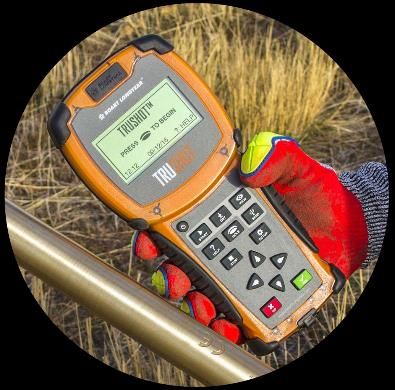
Global Products: H1 2018 Operations
- Continued growth with simplified sales footprint

                       ▪ Revenue - up 11% due to stronger tooling and rig sales      Key Financials (US $M):          HY 2018   HY 2017
                                                                                                                                            Change
                                                                                                                                          Fav / (Unfav)
                         across all regions
Financial Highlights

                                                                                     Revenue                           127       115          11%
                       ▪ COGS – up 6% reflecting increased efficiency and leverage
                                                                                     COGS                              100        94          (6%)
                         on increased volumes
                                                                                     SG&A                               16        19          16%
                       ▪ EBITDA - up $9M or 168% due to lower direct costs and
                         lower SG&A costs                                            EBITDA                             15        6          168%

                       ▪ Margins – EBITDA margin increased to 12% reflecting         EBITDA as % of Revenue            12%       5%
                         improved business performance                                                                                      Change
                                                                                     Pro Forma 4 Revenue (US $M)      HY 2018   HY 2017
                                                                                                                                          Fav / (Unfav)

                                                                                     Sales to BLY Drilling Services     30        25          19%

                                                                                     Pro Forma Revenue                 157       140          12%

                       ▪ Backlog – strong H1 with increase of 32% to $30M from
                         $23M in June 2017
Operating Highlights

                       ▪ Mix – Increases seen in Exploration Tooling and Drill Rig
                         sales
                       ▪ Throughput – Implemented plant efficiencies to increase
                         output that will support increased market demand.
                       ▪ Regions - stronger YOY regional performance in across
                         APAC, EMEA and LAM
                       ▪ Footprint – continued growth despite simplification and
                         rationalisation of operating footprint

                                                                                HY 2018 Results – See page 17 for footnote descriptions                   5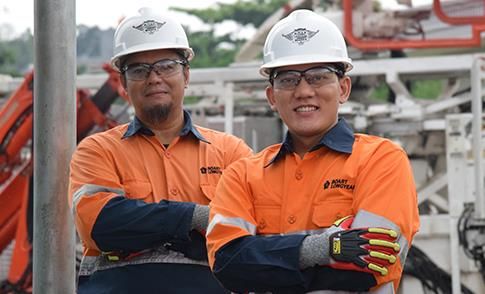
Leading innovation in the industry
- Investment in tools to improve drill productivity and data collection
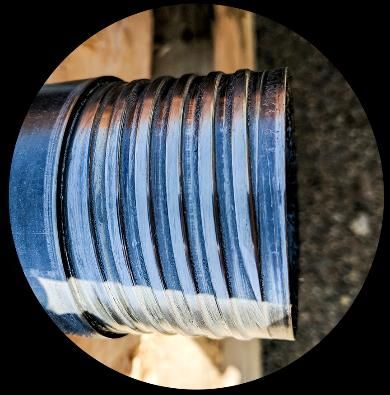
XQTM Rods TruCoreTM TruScanTM TruShotTM
(Deep-hole Drilling) (Core Orientation) (On-site Assay) (Down-hole Survey)
• Quick-start, double- • Highly accurate core • Proprietary XRF onsite • Survey tool launched
thread design orientation data assay technology by successfully in June 2018
BLY trained techs
• Increased strength • Provides consistent • Immediately accessible
and load capacity results for geologists
• Real-time data and high-quality 3D hole path
bridges gap between data
• Designed for deep • Reduces manual
portable and lab
hole and rod handling handling for increased • Optimized for driller field
applications driller safety • Field proven deployment
HY 2018 Results – See page 17 for footnote descriptions 6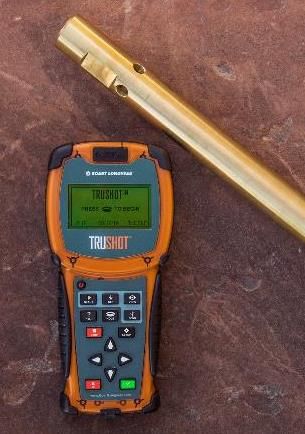
Salt Lake City Headquarters

Financial Overview
Brendan Ryan – Chief Financial Officer
Consolidated Results Summary: HY 2018
  - Volume increasing along with continued operational improvements

(US $M)   Consolidated Revenue Bridge
                                             • Revenue increased $38M (11%), driven by volume
                                               increases across both Drilling Services and Products
                                             • YOY increase in bidding activity & product backlogs

      Consolidated Adjusted EBITDA2 Bridge
                                             • Adjusted EBITDA up $16M (71%) driven by:
                                                   • Flow through from increased volumes
                                                   • Improvements from ongoing productivity initiatives
                                                   • Further reduction in SG&A
                                             • Statutory EBITDA higher Year on Year by $40M

               Net Profit After Tax2
                                             • Adjusted NPAT improved by $44M
                                             • Statutory NPAT improved by $67M with 2017 impacted by
                                               one-off restructure costs.

                                              HY 2018 Results – See page 17 for footnote descriptions     8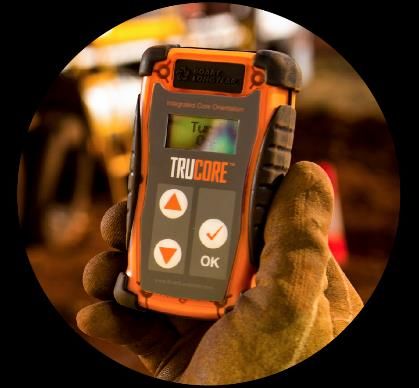
Year-Over-Year Comparison
  - Strong improvement result of continued cost and productivity focus

                        Statutory                                                              Adjusted2
                                                     Change                                                                 Change
(US $M except EPS)           HY 2018    HY 2017                    (US $M)                          HY 2018    HY 2017
                                                   Fav / (Unfav)                                                          Fav / (Unfav)
Revenue                          394        356            11%     Revenue                              394        356            11%

Gross Margin                      64         51            26%     Adjusted Gross Margin                 68         53            27%

   GM as % of Revenue           16%        14%                        Adj. GM as % of Revenue          17%        15%

Operating Margin                  10        (39)           NMF     Adjusted Operating Margin             18         (5)           NMF

   OM as % of Revenue            3%       (11%)                       Adj. OM as % of Revenue           5%        (1%)

EBITDA                            28        (12)           NMF     Adjusted EBITDA                       37         21            71%

   EBITDA as % of Revenue        7%         -3%                       Adj. EBITDA as % of Revenue       9%         6%

NPAT                             (16)       (85)           81%     Adjusted NPAT                        (10)       (54)           82%

   NPAT as % of Revenue         (4%)      (24%)                       Adj. NPAT as % of Revenue        (2%)      (15%)

EPS (cents)                     (0.1)      (9.1)           99%

                                                                     HY 2018 Results – See page 17 for footnote descriptions         9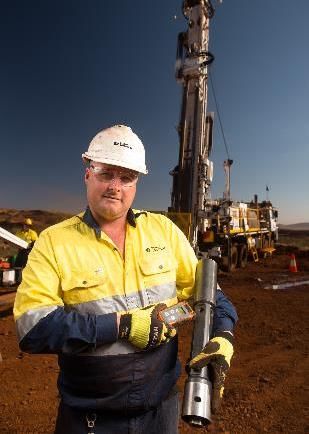
HY 2018 Financial Highlights
- Focus on continued optimisation of the business

                   Moody’s and Standard & Poor improve outlook in H1
 Credit Rating

                   ▪   Reviews completed by both rating agencies through H1
                   ▪   Reaffirmed Caa2/CCC+ rating and upgraded outlook to stable (from negative)
                   ▪   Aim to continue to work with agencies to ensure ratings reflect BLY continued improvement

                   Focus on releasing cash from the business for re-investment
 Cash Management

                   ▪   Net cash flow used in operating activities down 79% to $12M (from $58M)
                   ▪   Additional focus has resulted in material improvements in working capital
                   ▪   Optimising global footprint will release additional cash through further inventory reductions
                   ▪   Company continued to invest in capital and technological advancements as we continue to focus on
                       our strategy of being technology leader in the industry

                   Partial Resolution with Canadian Revenue Authority (CRA)
 Canadian Tax

                   ▪   Successfully resolved US$73 million of US$95 million of the Canadian tax assessments for the 2007-
                       2014 tax years
                   ▪   Pathway forward to resolve remaining US$22 million that is under appeal with the CRA.

                                                                          HY 2018 Results – See page 17 for footnote descriptions   10
Business Overview Jeff Olsen – Chief Executive Officer
Improving Leading Indicators

                                                                                                                  ▪ Mining industry debt ratings are improving
Debt Ratios

                                                                                                                  ▪ Improved industry balance sheets will result in increased
                                                                                                                    drilling activity for reserve / resource replenishment

                                    MSCI World Metals & Mining Index5                                            ▪ Suggests increasing investor interest in mining sector
Mining Indices

                  400.00                                                                                         ▪ Commodity market adversely impacted by escalation of
                  300.00                                                                                           “trade war” and resultant impact on Global uncertainty and
                  200.00                                                                                           GDP growth.
                  100.00
                                                                                                                 ▪ Supply deficit expected across some commodities if
                    0.00
                                                                                                                   exploration activity does not grow

                           Equity Raisings by Junior Miners (Q2 2013 - Q2 2018)5                                 ▪ Junior Miner equity raisings have plateaued
Equity Raisings

                  $6.0
                                                                                                                 ▪ Activity by junior miners lagging in the recovery
                  $4.0

                  $2.0

                  $0.0
                           Q2 Q3 Q4 Q1 Q2 Q3 Q4 Q1 Q2 Q3 Q4 Q1 Q2 Q3 Q4 Q1 Q2 Q3 Q4 Q1 Q2
                           '13 '13 '13 '14 '14 '14 '14 '15 '15 '15 '15 '16 '16 '16 '16 '17 '17 '17 '17 '18 '18
                   United States and Canada        Asia / Pacific                  Europe
                   Africa / Middle East            Lat in Ameri ca and Caribbean

                                                                                                                      HY 2018 Results – See page 17 for footnote descriptions 12
Key focus areas
- Continued focus on delivery of improved results
Continue to be an industry leader
Safety
▪ Simplify safety systems and standards
▪ Focus on leading indicators
▪ Deliver everybody home safely each day
Customer is at the core of the Company’s strategic priorities
Operations
▪ Reduce costs and improve efficiencies with our drilling and products customers through new technologies and
products
▪ Continue to build and harvest the operational efficiency improvements made in H1 2018
▪ Focus on building commercial intelligence and fleet readiness ahead of market demands
Create value through improved EBITDA
Financial
▪ Improve performance through focus on costs, efficiencies and market growth opportunities
▪ Focus on managing working capital to release cash for growth
▪ Manage capital prudently to maximise return to shareholders
ASX Listing to be maintained and no change to Management or Operations
Re-Domiciliation
▪ Upon implementation Boart Longyear will become a wholly-owned subsidiary of a new “Boart Canada”
▪ Eligible shareholders will own Boart Canada CHESS Depository instruments that hold the same economic
benefit and have substantially the same voting rights as current Boart Longyear shares.
▪ Re-domiciliation is consistent with the Company’s overall strategies including making the group structure more
efficient & minimising costs
▪ Opens access to larger pool of capital via Canadian Institutional investors
HY 2018 Results – See page 17 for footnote descriptions 13Appendix
Key Performance Indicators by Quarter

                                        Quarters ended 2018                    Quarters ended 2017                                     Quarters ended 2016
                                          Q2          Q1          Q4             Q3             Q2           Q1           Q4             Q3           Q2          Q1

Total Com pany
Revenue (US$ millions)                      206.4       187.8      183.7           199.2          192.5       163.7        156.9          175.0        168.7       141.8
EBITDA (US$ millions)                          15.3        13.0    (20.1)             (4.5)          (7.6)        (4.4)    (15.3)             13.8         15.5    (12.4)
                  2
Adjusted EBITDA (US$ millions)                 21.1        15.5         5.8           15.9           12.8          8.6          1.3           17.2         19.8        (6.3)
Operating Profit (Loss)                         9.6         0.3    (27.5)          (21.5)         (16.9)      (21.8)       (25.5)             (5.5)         3.4    (33.2)
Profit (Loss) from Trading Activities          22.6         0.5         7.1            4.0            7.4         (8.5)        (7.7)          (0.8)         7.8    (23.2)
Net cash flow s (used in) provided by
operating activities                        (12.0)         -           37.9        (34.2)         (18.3)      (39.4)            5.5           16.6     (22.5)      (50.0)
Net Debt (US$ millions)                     649.7       615.7      598.9           595.8          753.2       718.4        675.8          674.3        670.1       639.6
SG&A (US$ millions)                            21.7        23.0        20.2           28.6           27.2         27.4         28.7           28.1         28.9        27.0
# of employees                              4,990       4,882      4,604           4,812          4,636       4,444        4,337          4,626        4,629       4,611

Global Drilling Services
Revenue (US$ millions)                      145.2       121.7      122.6           136.6          134.1       107.3        104.5          123.7        122.2           97.3
EBITDA (US$ millions)                          27.1        11.8        11.0           23.8           23.8         10.5          8.2           20.0         21.5         1.9
Average # of drill rig3                        672         677         702            715            718          738          878            878          889         911
Average rig utilisation3                       49%         44%         43%            46%            45%          38%          32%            35%          34%         28%
# of employees                              3,763       3,647      3,320           3,511          3,338       3,146        3,011          3,307        3,349       3,300

Global Products
Revenue (US$ millions)                         61.2        66.1        61.0           62.7           58.4         56.4         52.4           51.3         46.5        44.5
EBITDA (US$ millions)                           7.9         7.4        (0.2)           5.8           (0.1)         5.8          2.1            5.2          4.3         1.8
Average backlog (US$ millions)                 29.9        32.0        31.3           27.0           23.7         21.7         19.3           12.8         11.3        14.9
# of employees                                 946         947         976            979            983          974      1,001              988          960         974

                                                                                              HY 2018 Results – See page 17 for footnote descriptions 15
Diversified End-Market Exposure
H1 2018 Total Revenue by Type – Products & Services FY 2018 Total Revenue by Region – Products & Services
FY 2018 Drilling Services Revenue by Stage FY 2018 Drilling Services Revenue by Commodity
HY 2018 Results – See page 17 for footnote descriptions 16Footnote Disclosures
• Footnote 1: Per 200,000 work hours.
• Footnote 2: Loss from Trading Activities, Adjusted Gross Margin, Adjusted Operating Loss, Adjusted
SG&A, Adjusted EBITDA and Adjusted NPAT Loss are non-IFRS measures and are used internally by
management to assess the underlying performance of the business and have been derived from the
Company’s financial results by adding back significant items (i.e., charges relating to recapitalisation,
impairments, restructuring, and employee and related costs). In the case of Pro Forma Adjusted EBITDA,
additional adjustments are made to account for one-time items. In the case of Adjusted NPAT, additional
adjustments are made to account for the tax effect of significant items and other tax write-offs and, in the
case of Loss from Trading Activities, adjustments are made to Adjusted Operating Loss to remove other
expense/income.
• Footnote 3: Operating rigs defined as the number of weekly operating rigs generating revenue.
Utilisation figures based on operating rigs divided by rigs held in the fleet.
• Footnote 4: Transactions between segments are carried out at arm’s length and are eliminated on
consolidation.
• Footnote 5: Source: S&P Global Market Intelligence
17You can also read