Drive Shack Inc. Third Quarter 2019 - Seeking Alpha
←
→
Page content transcription
If your browser does not render page correctly, please read the page content below
Drive Shack Inc. Third Quarter 2019

Disclaimers
IN GENERAL. This disclaimer applies to this document and the verbal or written comments of any person presenting it. This document, taken together with any such
verbal or written comments, is referred to herein as the “Presentation.”

FORWARD-LOOKING STATEMENTS. Certain items in this Presentation may constitute forward looking statements within the meaning of the Private Securities
Litigation Reform Act of 1995, including, but not limited to, statements regarding Drive Shack Inc.’s (NYSE: DS; “DS Inc.” or the “Company” and “we,” “us” and “our,” as
applicable) (a) statements relating to returns on our investments, (b) anticipated future sales of our owned golf courses, including statements relating to the timing and
amount of anticipated proceeds, (c) our growth, cyclicality, margins and other projections relating to our results and our industry, plans and expectations to optimize the
operation of, and grow, our existing leased and managed golf courses, (d) redeployment of cash from our generated liquidity, (e) targeted multiples, yields and returns,
(f) our ability to terminate or restructure leases and (g) the Company’s current business plan and expectations relating to our Drive Shack sites, including (i) the number
of venues that we may be able to develop, (ii) timing and frequency for opening venues, (iii) financial performance of these venues and capital expenditure costs, (iv)
the growth of the golf, golf entertainment, and eatertainment industry and business, and (v) our ability to enhance and integreate technology. These statements are
based on management's current expectations and beliefs and are subject to a number of risks, trends and uncertainties that could cause actual results to differ
materially from those described in the forward-looking statements, many of which are beyond our control. We cannot give any assurances that management’s current
expectations will be attained. For a discussion of some of the risks and important factors that could cause actual results to differ materially from such forward-looking
statements, see the sections entitled “Risk Factors” and “Management’s Discussion and Analysis of Financial Condition and Results of Operations” in the Company’s
periodic reports filed with the Securities and Exchange Commission (“SEC”), which are available on the Company’s website (www.http://ir.driveshack.com). In addition,
new risks and uncertainties emerge from time to time, and it is not possible to predict or assess the impact of every factor that may cause actual results to differ from
those contained in any forward-looking statements. Accordingly, you should not place undue reliance on any forward-looking statements contained in this Presentation.
Forward-looking statements speak only as of the date of this Presentation. We expressly disclaim any obligation to release publicly any updates or revisions to any
forward-looking statements contained herein to reflect any change in expectations with regard thereto or change in events, conditions or circumstances on which any
statement is based.

PAST PERFORMANCE; NO OFFER; NO RELIANCE. Past performance is not a reliable indicator of future results and should not be relied upon as the basis for
making an investment decision. This Presentation does not constitute an offer to sell, or a solicitation of an offer to buy, any security. Any such offer would only be made
by means of formal offering documents, the terms of which would govern in all respects. You should not rely on this Presentation as the basis upon which to make any
investment decision.

NON-GAAP FINANCIAL INFORMATION. This Presentation may include information based on financial measures that are not recognized under generally accepted
accounting principles (“GAAP”), including EBITDA margin. You should use non-GAAP information in addition to, and not as an alternative to, financial information
prepared in accordance with GAAP, which is included in the Company’s filings with the SEC. The Company has not reconciled its EBITDA expectations set forth in this
presentation to net income (loss), as items that impact such measures are out of the Company’s control and/or cannot be reasonably predicted. Accordingly, a
reconciliation is not available without unreasonable effort.

CAUTIONARY NOTE REGARDING ESTIMATED / TARGETED RETURNS AND GROWTH. Targeted returns and growth represent management’s view and are
estimated based on current and projected future operating performance of our location in Orlando and other targeted locations, comparable companies in our industry
and a variety of other assumptions, many of which are beyond our control, that could prove incorrect. As a result, actual results may vary materially with changes in our
liquidity or ability to obtain financing, changes in market conditions and additional factors described in our reports filed with the SEC, which we encourage you to review.
We undertake no obligation to update these estimates. See above for more information on forward-looking statements.

                                                                                                                                                                               1
Drive Shack Inc. – Third Quarter Highlights
Gen 2.0 Venues ▪ Since July, opened 3 new venues in Raleigh, Richmond and West Palm Beach
Open and ▪ All 3 venues significantly outperformed initial expectations, beating plan by +21%
Outperform ▪ In the process of making operational updates across the platform based on early learnings
Urban Box ▪ Made substantial strides in creating our next concept – the Urban Box (indoor, putting-based)
Development ▪ Successfully progressing towards our goal to open 3 Urban Box stores by YE 2020
Progressing ▪ Expertise applied to new Urban Box format, an already proven business model in Europe
American Golf ▪ Existing traditional golf business continues to perform well
Success ✓ AGC’s public program, Players Club, grew +6% (~40K total members) compared to Q3 ’18
Continues ▪ Achieved our goal to sell 24 owned courses by YE 2019 for total proceeds of $170M(1)
1) To date as of November 8, 2019
Based on management’s current views and estimates. See “Disclaimers” at the beginning of this Presentation for more informati on on forward-looking statements.
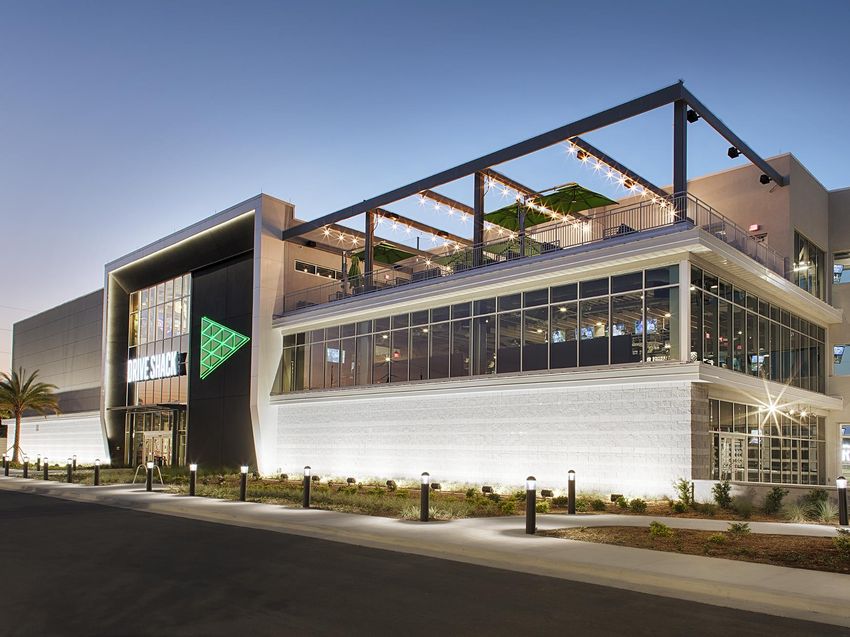
2Entertainment Golf – Strong Gen 2.0 Opening Results(1)
▪ Generation 2.0 venues have opened and the operating results are extremely strong(2)
▪ Raleigh opened August 23rd (Q3)
▪ Richmond opened September 20th (Q3)
▪ West Palm Beach opened October 18th (Q4)
▪ To date, Gen 2.0 venues generated $6.5M of total revenue, beating our plan by ~21%(3)
▪ Based on this performance, we expect to exceed our Q4 plan
▪ On pace to achieve average EBITDA of $4M to $6M and development yields of 10-15% in 2020(4)
Gen 2.0 Venues Exceed Revenue Plan
$3M Plan Results
$2M
$1M
$M
$0
Aug. Sept. Oct.
Raleigh Raleigh and Raleigh, Richmond
Richmond and West Palm
1) To date as of November 8, 2019.
2) Official opening date is considered the grand opening date of each venue and excludes days of soft open.
3) Revenue of $6.5M excludes revenue earned during 4 days of soft open days at each venue.
4) Development yields are based on 2020 total site EBITDA divided total site development costs at ~$35M development cost per site.
Based on management’s current views and estimates. See “Disclaimers” at the beginning of this Presentation for more informati on on forward-looking statements.
3Entertainment Golf – Operational Updates
Beta Site Updates
▪ Closed Orlando in September to retrofit with 2.0 enhancements and will reopen in December
• New TrackmanTM ball tracking technology and enhanced gaming will provide a more engaging guest experience
• We expect this to extend the length of visit, resulting in an increased spend per visit
Platform-wide Updates
▪ Actively refining the game selection, quality, and overall gaming experience
• Testing and developing new games for roll out beginning in Q4 2019 – this process will be ongoing
▪ Revamping the food & beverage offerings based on guest feedback and sales trends
• We will refresh our menu in Q1 2020 to feature more restaurant-quality options
▪ Rolling out online reservations in Q2 2020 to help alleviate long guest wait times
Based on management’s current views and estimates. See “Disclaimers” at the beginning of this Presentation for more informati on on forward-looking statements.
4Entertainment Golf – Urban Box
▪ Urban Box will focus on providing a social and tech-enhanced mini golf experience with great food and
beverage
• Will take the same expertise used to develop our core stores and apply it to smaller indoor locations across
50+ markets in the US
▪ New format significantly increases store growth potential due to vast availability of real estate, shorter
development timelines, less capital risk, and higher development yields
▪ Since announcing the UB format, we have focused on 4 key deliverables, all of which are underway:
• Secure technology for ball tracking and automatic scoring; develop course hole prototypes for tech integration
• Work with architects and course designers to determine venue format, layout and aesthetic
• Identify potential sites and create test fits
• Begin trademark registration process for official name of Urban Box store
▪ Actively exploring markets across the US – expect to have 3 venues open by YE 2020
Based on management’s current views and estimates. See “Disclaimers” at the beginning of this Presentation for more informati on on forward-looking statements.
5Entertainment Golf – Development Strategy
▪ Our strategy is to continue developing our “Core” Drive Shack venues in key markets
▪ Four sites already open in Orlando, Raleigh, Richmond, West Palm Beach
▪ Four additional sites committed in New Orleans, Chicago, Newport Beach, Manhattan
▪ We are looking at markets across the U.S. that meet our land and demographic requirements:
Core Stores Urban Box
▪ ~12 acres ▪ ~20K square feet
▪ ~600K to 1M people within a 30 minute drive ▪ 225K people within a 5-mile radius
▪ Highway visibility or high-traffic corridors ▪ Densely populated urban cores near other bars, restaurants
and entertainment facilities with heavy foot traffic
CHICAGO, IL
MANHATTAN, NY
RICHMOND, VA
RALEIGH, NC
NEWPORT BEACH, CA
Open Now
ORLANDO, FL
In Development WEST PALM BEACH, FL
Potential Markets NEW ORLEANS, LA
Based on management’s current views and estimates. See “Disclaimers” at the beginning of this Presentation for more informati on on forward-looking statements.
6Drive Shack Inc. – Our Differentiated Offering
1. Exclusive arrangement with TrackmanTM – the most widely adopted and recognized golf tracking
technology
2. Ability to innovate games due to our proprietary gaming software – plan to roll out new offering of
games every quarter
▪ Our gaming software has been designed to consistently refresh, update, and roll out new games
3. Launching new product innovation – the Urban Box (indoor, mini golf focus), an already proven
concept in Europe
4. Only company to offer a truly integrated traditional + entertainment golf proposition
▪ Unique ability to takeover existing ranges/courses (like Manhattan) and build new Drive Shacks
▪ Opportunity to unlock top sites by leveraging operational and municipal experience of AGC
5. Players Club, AGC’s public subscription program, continues to grow members, +6% (~40K
members) vs. Q3 ‘18
▪ Advanced data collection maximizes “on-peak” rates through our demand pricing model
▪ Subscription model allows AGC to achieve occupancy levels of ~74%, 20+ points higher than national average
Based on management’s current views and estimates. See “Disclaimers” at the beginning of this Presentation for more informati on on forward-looking statements.
7Entertainment Golf – Attractive Unit Economics
▪ Initial results from Gen 2.0 venues on track to achieve or exceed our target economics
▪ Target site-level EBITDA for Core Venues of $4 to 7 million and Urban Box of $2 to 3 million
Target Unit Economics
Core Venues Urban Box
$ in millions
72- to 90-Bay+ Mini Golf
Size (sq. ft.) 50K - 60K+ ~20K
Development Cost(1) $25 - $40 $6 - $10
Total Revenue $15 - $25 $7 - $11
Site-level EBITDA $4 - $7 $2 - $3
Development Yields 10 – 20% 25 – 35%
1) Development cost target is inclusive of all construction costs, soft costs, and start-up costs.
Based on management’s current views and estimates. See “Disclaimers” at the beginning of this Presentation for more informati on on forward-looking statements. There can be no assurance that we will
achieve Target Site Economics and actual results may differ materially.
8Entertainment Golf – Site Additions
▪ Plan to scale footprint to ~30 sites by the end of 2022
▪ Continue to build Core DS venues, adding 1 to 4 venues annually in 2021+
▪ Rapidly scale development of Urban Box venues, adding 7 to 10 annually in 2021+
▪ Development of new venues will cost ~$350 to $375 million(1)
▪ Expect to fund development with cash, debt and additional AGC course monetization
Target Sites Additions Target Sites Ramp(2)
2020 2021 2022 Urban Box Core DS
30
New Sites Additions 3–6 8 – 12 10 – 15
10
Core DS 1–2 1–3 2–4
18
Urban Box 2–4 7–9 8 – 11
7
Development Cost(1) ~$60M ~$130M ~$175M 8 20
4 5 11
4 3
Total Development Costs of Today 2020 2021 2022
~$350 to $375 million
1) Development cost target is inclusive of all construction costs, soft costs and start-up expenses.
2) Total Sites assumes the midpoint of new sites additions. 30 total sites include 4 Core DS venues currently open, plus adding 1 Core DS and 3 Urban Boxes in 2020, 2 Core DS and 8 Urban Boxes in
2021, and 3 Core DS and 9 Urban Boxes in 2022.
Based on management’s current views and estimates. See “Disclaimers” at the beginning of this Presentation for more informati on on forward-looking statements. There can be no assurance that we will
achieve Target Site Additions and actual results may differ materially.
9The Go-Forward Business
▪ Transformation from a traditional golf owner/operator to an entertainment operator is nearly complete
▪ Project total company run-rate revenue of ~$570M and EBITDA of ~$95 by 2022
Illustrative Run-Rate Revenue & EBITDA(1)
($ in millions)
$570
Entertainment Golf American Golf
$424
$380
$307
$239
$127
$180 $185 $190
2020 2021 2022
Run-Rate Total Company
$25 $55 $95
EBITDA(2)
1) Assumes revenue average for Core DS per sites of $20M and Urban Box per average of $9M; Assumes EBITDA average for Core DS per sites of $5M and Urban Box per average of $2.5M.
2) Run-Rate Total Company EBITDA includes Core DS Site EBITDA, Urban Box Site EBITDA, AGC Course EBITDA, less total company SG&A.
“Run-Rate” represents annualized results for each site, as if it was opened for the full year.
Based on management’s current views and estimates. See “Disclaimers” at the beginning of this Presentation for more informati on on forward-looking statements. There can be no assurance that we will
achieve development, revenue, or EBITDA projections and actual results may differ materially.
10Growth and Shareholder Value
▪ Our illustrative valuation indicates upside potential of ~2 to 4x our current share price
Total Company EBITDA: Run Rate 2022 Illustrative Valuation
($ in millions, except per share data)
Valuation indicates significant upside potential
$35 $40
$95 Multiple Enterprise Value
$50 10x $950
12x $1,140
15x $1,425
$50
Net Debt(1): ~$365M
Implied Valuation(2): ~$9 to $16/share
Core DS Urban Box AGC SG&A Company ~2 to 4x of Current Share Price(3)
10 Sites 20 Sites $190M Rev. 5-10% of EBITDA
@ $5M @ $2.5M @ ~18.5% Margin Total Rev.
EBITDA / Site EBITDA / Site
1) Net Debt assumes $250M of new net debt from DS venues and AGC courses plus existing Junior Subordinated Notes & Preferred Stock of total $113M.
2) Implied valuation based on 67M shares outstanding.
3) Current share price of ~$4 refers to the closing share price on November 8, 2019.
“Run-Rate” represents annualized results for each site, as if it was opened for the full year.
Based on management’s current views and estimates. See “Disclaimers” at the beginning of this Presentation for more informati on on forward-looking statements. There can be no assurance that we will achieve Run Rate
EBITDA and share price projections and actual results may differ materially.
11Financial Results & Appendix:
12AGC – Course Sales & Portfolio Update(1)
▪ Achieved our goal to sell 24 owned courses for total proceeds of ~$170M
▪ Additional long term course sales from 2 potential courses with estimated value of ~$45M to $65M
▪ Leveraging scalable platform to add higher-margin management contracts
▪ Successfully added 14 new management contracts for ~$2M of annual cash flow over the past year(2)
▪ Expect annual revenue of ~$180M and course-level EBITDA margin of ~15-20% by 2020
American Golf Portfolio Mix
YE 2018 YE 2019
# of Properties # of Properties
Owned 13 Monetize 2
Leased 36 Maintain 36
Managed 17 Multiply 22
Total 66 60
Optimized portfolio to generate:
✓ Annual revenue of $180M
✓ Course EBITDA margins of ~15-20%
Based on management’s current views and estimates. See “Disclaimers” at the beginning of this Presentation for more informati on on forward-looking statements.
1) To date as of November 8th, 2019.
2) Added 14 new management contracts since December 2018.
133Q 2019 GAAP Financial Results
▪ 3Q 2019 GAAP Loss of $13 million, or $0.20/share vs. GAAP Loss of $0.23/share in 3Q 2018
▪ 3Q 2019 YTD GAAP Loss of $44 million, or $0.65/share vs. GAAP Loss of $0.59/share in 3Q 2018 YTD
GAAP Financial Results
3Q 2019 3Q 2018
($ in millions) (basic share) ($ in millions) (basic share)
GAAP Loss ($13) ($0.20) ($15) ($0.23)
3Q 2019 YTD 3Q 2018 YTD
($ in millions) (basic share) ($ in millions) (basic share)
GAAP Loss ($44) ($0.65) ($39) ($0.59)
Note: Per share represents per weighted average basic share unless otherwise noted. All per share amounts are represented on a weighted average basis.
14Consolidated Statement of Operations
($ in thousands, expect per share data)
3 months ended 3 months ended 9 months ended 9 months ended
Statement of Operations
30-Sep-19 30-Sep-18 30-Sep-19 30-Sep-18
Revenues:
Golf operations $60,797 $68,928 $162,889 $191,632
Sales of food and beverages 13,885 18,491 37,360 53,451
Total revenues $74,682 $87,419 $200,249 $245,083
Operating costs:
Operating expenses 63,454 70,330 169,897 194,751
Cost of sales – food and beverages 3,856 5,180 10,458 15,413
General and administrative expense 12,755 10,149 37,981 29,611
Depreciation and amortization 5,723 4,495 15,769 14,358
Pre-opening costs 4,350 245 7,229 2,048
Impairment and other losses 1,872 4,172 6,077 5,645
Realized and unrealized (gain) loss on
- 48 - (283)
investments
Total operating costs $92,010 $94,619 $247,411 $261,543
Operating Loss ($17,328) ($7,200) ($47,162) ($16,460)
Other income (expenses):
Interest and investment income 191 467 799 1,382
Interest expense, net (2,061) (4,290) (6,008) (12,940)
Other income (loss), net 7,341 (3,052) 12,955 (7,157)
Total other income (expenses) $5,471 ($6,875) $7,746 ($18,715)
Loss before income tax ($11,857) ($14,075) ($39,416) ($35,175)
Income tax expense - 162 -
162
Net loss ($12,019) ($14,075) ($39,578) ($35,175)
Preferred dividends (1,395) (1,395) (4,185) (4,185)
Loss Applicable to Common Stockholders ($13,414) ($15,470) ($43,763) ($39,360)
Per WA Basic Share ($0.20) ($0.23) ($0.65) ($0.59)
15Consolidated Balance Sheet
($ in thousands)
Assets As of 9/30/2019 As of 12/31/2018
Current Assets:
Cash and cash equivalents $24,816 $79,235
Restricted cash $3,163 $3,326
Accounts receivable, net $5,243 $7,518
Real estate assets, held-for-sale, net $27,833 $75,862
Real estate securities, available-for-sale $2,914 $2,953
Other current assets $18,615 $20,505
Total Current Assets $82,584 $189,399
Restricted cash, noncurrent $931 $258
Property and equipment, net of accumulated depreciation $185,737 $132,605
Operating lease right-of-use assets $220,197 -
Intangibles, net of accumulated amortization $18,208 $48,388
Other investments $23,648 $22,613
Other assets $4,601 $8,684
Total Assets $535,906 $401,947
Liabilities
Current Liabilities:
Obligations under finance leases $6,222 $5,489
Membership deposit liabilities $10,766 $8,861
Accounts payable and accrued expenses $38,032 $45,284
Deferred revenue $7,627 $18,793
Real estate liabilities, held-for-sale $21 $2,947
Other current liabilities $28,697 $22,285
Total Current Liabilities $91,365 $103,659
Credit facilities and obligations under finance leases - noncurrent $14,397 $10,489
Operating lease liabilities - noncurrent $191,442 -
Junior subordinated notes payable $51,194 $51,200
Membership deposit liabilities, noncurrent $93,988 $90,684
Deferred revenue, noncurrent $6,170 $6,016
Other liabilities $3,694 $5,232
Total Liabilities $452,250 $267,280
Stockholders' Equity
Preferred Stock $61,583 $61,583
Common Equity $22,073 $73,084
Total Stockholders' Equity $83,656 $134,667
Total Liabilities & Stockholders' Equity $535,906 $401,947
16You can also read