JMP SECURITIES TECHNOLOGY CONFERENCE - FEBRUARY 2018 - Telaria

Page created by Gordon Farmer
 
CONTINUE READING
JMP SECURITIES TECHNOLOGY CONFERENCE - FEBRUARY 2018 - Telaria
JMP SECURITIES TECHNOLOGY CONFERENCE

FEBRUARY 2018
JMP SECURITIES TECHNOLOGY CONFERENCE - FEBRUARY 2018 - Telaria
SAFE HARBOR STATEMENT
         This presentation is for informational purposes only and is not an offer to sell securities or a solicitation of an offer
         to buy any securities, and may not be related upon in connection with the purchase or sale of any security. Sales
         and offers to sell Telaria, Inc. securities will only be made in accordance with the Securities Act of 1933, as
         amended, and applicable SEC regulations, including written prospectus requirements.

         This presentation contains forward-looking statements that involve risks, uncertainties, assumptions and other
         factors that could cause actual results and the timing of certain events to differ materially from those set forth in
         or implied by such forward-looking statements. All statements other than statements of historical fact contained
         in this presentation are forward-looking statements, including, but not limited to, statements related to Telaria’s
         future financial results, growth potential, or future profitability, including financial guidance, statements with
         respect to the growth of the industry or market in which Telaria participates, and statements with respect to the
         development or adoption of the company’s solutions. In some cases, you can identify forward-looking statements
         by terminology such as “may,” “will,” should,” “expects,” “plans,” “anticipates,” “believes,” “estimates,” “predicts,”
         “potential,” or “continue” or the negative of these terms or other comparable terminology.

         These statements are only current predictions and are subject to known and unknown risks, uncertainties and
         other factors that may cause our or our industry’s actual results, levels of activity, performance or achievements
         to be materially different from those anticipated by the forward-looking statements. These forward-looking
         statements are subject to a number of risks, including those described under the heading “Risk Factors” and
         elsewhere in Telaria’s filings with the Securities and Exchange Commission (the “SEC”), including its Annual Report
         on form 10-K for the year ended December 31, 2017. Although we believe that the expectations reflected in the
         forward-looking statements are reasonable, we cannot guarantee future results, levels of activity, performance or
         achievements. Except as required by law, we are under no duty to update or revise any of the forward-looking
         statements, whether as a result of new information, future events or otherwise, after the date of this presentation.

2
                                                                                                                                     NYSE: TLRA
JMP SECURITIES TECHNOLOGY CONFERENCE - FEBRUARY 2018 - Telaria
STRATEGY OVERVIEW   CEO: Mark Zagorski
JMP SECURITIES TECHNOLOGY CONFERENCE - FEBRUARY 2018 - Telaria
OUR MISSION
    To become the single, essential seller platform
        for the monetization and management
              of premium video anywhere.

4
                                                      NYSE: TLRA
JMP SECURITIES TECHNOLOGY CONFERENCE - FEBRUARY 2018 - Telaria
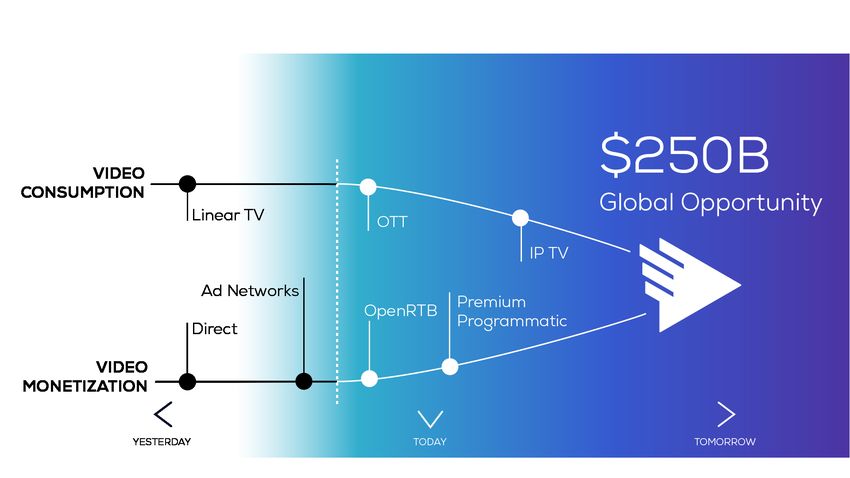
A MISSION DRIVEN BY CONVERGING TRENDS

                                                                                                                                                        *

                                                                                                                                           THE LEADER TO OWN
                                                                                                                                           THIS OPPORTUNITY

5
    Source: MAGNA ADVERTISING FORECAST WINTER UPDATE (DEC. 4, 2017), DIGITAL TV RESEARCH OTT AND PAID TV FORECAST REPORT (December 2017)                NYSE: TLRA
JMP SECURITIES TECHNOLOGY CONFERENCE - FEBRUARY 2018 - Telaria
VIDEO CONSUMPTION | THE DAWN OF DIGITAL
        Linear declines. Digital accelerates.                                                        Cord cutting proliferates.                             Demographics drive
M ED I A
                             11:50
                                                          12:09                                           CTV benefits.                                        the future.
CON SUMPTION
(Units inhours:minutes)                                                          CAGR (2014-2019)
                                                                                                                                                          Decrease in Linear TV Viewing 2012 - 16
                                                                          Total               1%
                                                             3:47                                                                                                     Q’2’12-Q2’16
                             4:20
                                                                          Traditional TV:     3%
                                                                                                                               33.2%                         -24%
                                                                                                                                                              2-11
                                                                                                                                                                                            -38%
                                                                                                                                                                                                12-17
                                                                          Mobile Video:       13%
                                                             0:39                                                           Increase in pay-TV
                                            101mins          0:24         Desktop Video:
                             0:21                                                             1%                           cancellations in 2017
               63mins        0:23                            0:38                                                                                                                                       Age Range
                                                                          CTV:                15%                               22mm total
                                                                                                       77%
                             0:19
                                                                                                                                                    -3%
                                                                                                                                                    65+
                                                                                                    of TV households                                                 Total US
                             4:01                            4:35                                                                                                        e
                                                                                                                                                                       -14%                              -37%
                                                                                                     have a pay-TV                                                                                       18-24
                                                                                                       subscription                                -6%
                                                                          Other Digital:      3%
                                                                                                                                69%                50-64

                                                                                                                              of all digital
                             2:26
                                                             2:06         Non-Digital:        3%
                                                                                                                           viewers have an                   -18%                          -30%
                                                                                                                           OTT subscription                  35-49                         25-34
                             2014                         2019

                   DesktopVideo          MobileVideo            TraditionalTV
                                                       (1)
                          Non-Digital      OtherDigital             CTV

                               Source: Bank of America Merrill Lynch Research                               Source: eMarketer July 2017                               Source: BI intelligence
 6
                                                                                                                                                                                                 NYSE: TLRA
VIDEO MONETIZATION | AD DOLLARS FUEL THE REVENUE FIRE
      Digital video ad spend grows                               OTT/CTV becomes the focus                                         Programmatic accelerates
                                                                                                                                          the trend
Digital Video Ad Spend
                                                                48% of agency buyers plan to shift                                  74% of digital video ad spend is
     US                                   Global                TV dollars into OTT                                                    Is going programmatic
     (CAGR ‘16-’20: 17%)                  (CAGR ‘16-’20: 25%)

                                                                                                                                                                             74%
                                                                $12B in OTT global ad spend in                                                                     69%
                                                                2016; $29B in 2022 – increase of                                                      60%
                                                                                                                                         39%
                                                                142%
                                                                                                                                  12%

                                                    $42.0                                                                         2014    2015        2016        2017       2018
    $10.7          $17.1              $19.8
                                                                                                                                                 % of total digital
            2016                                 2020                                                                                            video ad spending

               Source: eMarketer (August 2017)                   Sources: Digital TV Research 2017, Advertiser Perceptions 2017           Source: eMarketer (October 2017)

                              THE NEXT WAVE OF OTT MONETIZATION WILL BE ADS, NOT SUBSCRIPTIONS

7
                                                                                                                                                                         NYSE: TLRA
AD TECH HAS EVOLVED, AND SO HAVE WE
         Tremor Video                                                     Telaria

                                                                                                            Highlights
    Highlights
                                                    CTV SOLUTION                                            Independent Video
    Ad network                                       LAUNCHED                                   2017        Monetization Platform (focus
                                                                                             30 billionth   on OTT and Tier-1 video
    High-function buying
                                                                                                            publishers)
    DSP & SSP                                                                                 SSP video
                                                                            Sept. 2017       impression     136 employees across 10
    340 employees across 16
                                                                            Rebranded        monetized      global offices
    global offices
                                                                2016         as Telaria                     Streamlined overhead
    High touch sales, high comp                                First $1
    overhead, driven by scale, not                  2015        million                                     Transparent SSP transaction
    margin                                         First $1                                                 fees
                                                              spend day
    Broad competitive set                          million                                PRIVATE MARKET    Revenue reported net
                                       2014        spend
                                     First SSP                                             MAJORITY OF      Narrow competitive set
    Strategy                                       month
                                       video                                                 REVENUE
                                     monetized                                                              Strategy
    Programmatic marketplace;                                          BUYER
    two platforms servicing both                                                                            Focused self-serve
    buyers / sellers of video in                                     PLATFORM
                                                                                                            programmatic platform
    open marketplaces                                                SOLD FOR                               tailored to private
                                              OPEN
                                                                       $50M                                 marketplaces and CTV
                                           MARKETPLACE
    Core Clients                         100% OF REVENUE                                                    Core Clients
    Buyers and sellers of                                                                                   Sellers of premium video
    premium video                          NEW BRAND, CLEAR STRATEGY, SINGULAR FOCUS
8
                                                                                                                            NYSE: TLRA
CONNECTING ECOSYSTEM TO MAXIMIZE PROGRAMMATIC RETURN
      Publishers                                            DSPs             Agencies
                                                                           & Advertisers
    90 OF COMSCORE TOP                                 ALL LEADING VIDEO
      100 PUBLISHERS                                        BUYERS

                             TELARIA IS PAID ON
                             EACH TRANSACTION

                                  Management
                                Yield Optimization
                               Insights & Analytics
                                   Diagnostics

9
                   95% RETENTION RATE OF SELLERS & BUYERS                              NYSE: TLRA
WHY WE WIN

              Tech                       Team                        Traction
                                                                   + Tailwinds

      Differentiated for CTV;   Industry leaders who drive    Leading the trends that are
          efficient scaling.      growth and outcomes.            transforming tech.

       Wins head-to-head        Minimal HC expansion to         Well positioned to take
            contests                support revenue          advantage of OTT momentum.
                                      acceleration.

10
                                                                                     NYSE: TLRA
TECHNOLOGY | LEADING SOFTWARE THAT SCALES

     PRODUCT                                                Flexible system built to manage “TV
                                                            style” viewing surges with 260ms avg
                                               Volatility
     Exceeds core demands                     Management    response time
     of video publishers

     Brand safety tools                                               Cloud based backbone
     Exclusive real-time diagnostics                                  that manages 5 billion+
                                                                      of daily requests with
                                                                      minimal capital costs

                                                                  API–driven platform plugged
     Live performance data                                        into dozens of ecosystem
     AI-driven analysis of                                        partners (DMPs / Ad Servers /
     billions of data points                                      DSPs / Bidders / Tags / etc.)

                                                 Yield
                                                                 ARCHITECTURE
     Industry’s only Buyer UI                                    Manages volatility and
     Multiple deal options to drive results                      scales for tomorrow
11
                                                                                            NYSE: TLRA
TEAM | SEASONED LEADERS, BILLIONS IN VALUE CREATION

      CEO: Mark Zagorski           CFO: John Rego           CSO: Doug Campbell           COO: Katie Evans             CRO: Rick Song

                      CMO: Jen Catto            GC: Aaron Saltz              VP, Product:              VP, Engineering:
                                                                            Craig Berlingo              Rama Roberts
                             BRINGING +170 YEARS OF COLLECTIVE PUBLIC AND PRIVATE EXPERIENCE

12
                                                                                                                                  NYSE: TLRA
TRACTION | AT THE FOREFRONT OF KEY TRENDS

                                        Quality &
               CTV                                                  Consolidation
                                      Transparency
      Big and getting bigger.     A massive run to premium.       Creating client conflict.
                                Clear, transactional SaaS fees.
         Telaria’s tech is                                           Opportunity for
         optimized for it.             It’s in our DNA.           independent players.

13
                                                                                              NYSE: TLRA
BEST POSITIONED TO SEIZE MARKET OPPORTUNITY
                          Independent

                                            CTV / Video Focused

14
                                                           NYSE: TLRA
BEATING MARKET COMPS | EFFICIENT GROWTH FORTIFIES LEADERSHIP

                                                Growth - 2017 Net Revenue Growth
                    50.4%          51.9%
                                                                                                Median : 38.3%
                                                46.7%
                                                             38.6%        38.0%        27.1%
                                                                                                      25.5%

     ($ in 000’s)
                                   $432.3
                                            Productivity - 2017 Net Revenue per Employee
                    $319.7
                                               $296.5                                          Median: $238.0
                                                             $266.7
                                                                          $209.3
                                                                                      $209.0
                                                                                                      $180.5

                             (1)

15
                                                                                                              NYSE: TLRA
OUR FOCUSED STRATEGY | A 2020 PERSPECTIVE

              Execute                     Expand                  EBITDA

                                                               Continue to deliver
       • Premium, fraud-free       • Software extensions to
                                                               bottom-line results
         inventory                   drive sticky SaaS
       • CTV penetration           • Ecosystem partnerships
       • International growth in   • Acquisitions: Accretive
         high value markets           or bolt on tech

16
                                                                                     NYSE: TLRA
EBITDA | THE PAYOFF IS PROFIT

      + We become ESSENTIAL to our partners

      + We build SCALE & MOMENTUM as the industry goes programmatic

      + We LEAD the race to capitalize on massive global digital video ad spend

      = We build EXCEPTIONAL VALUE for our stakeholders & shareholders

17
                                                                           NYSE: TLRA
FINANCIALS   CFO: John S. Rego
A SUCCESSFUL SOFTWARE PLATFORM

                     Exponential Growth

                     Net Revenue Reporting

                     High Gross Margins

                     Lean Headcount

                     Stable, Predictable Overhead

                     Low Capital Expenditures

                     High EBITDA Margins
19
                                                    NYSE: TLRA
EXCEPTIONAL GROWTH

             Yearly Revenue Growth                                            Quarterly Revenue Growth
                  (2015-2017)                                                       (2015-2017)

                                                                                                                                              $15.0
                                 $43.8
                                                                                                                       $12.7

                                                                                           $9.9                                       $10.4

                    $29.1
                                                                                                                $7.6
                                                                     $6.1           $5.7
                                                              $5.4                                                             $4.8

                                                                                                         $2.8
      $9.6
                                                                             $1.3
                                                       $0.8

     2015          2016          2017                 Q1 '15 Q1 '16 Q1 '17   Q2 '15 Q2 '16 Q2 '17    Q3 '15 Q3 '16 Q3'17       Q4 '15 Q4 '16 Q4'17

                                         ($ in millions)                        2015              2016                 2017

20
                                                                                                                                          NYSE: TLRA
HIGH GROSS MARGINS
            Millions                                        All historical periods are pro-forma

           $50.0
         45,000                                                                         92.5%
           $45.0
         40,000                          92.0%                      92.0%
                                                                                        92.0%
            $40.0
         35,000
            $35.0                                                                       91.5%
         30,000
            $30.0
         25,000                                                                         91.0%
            $25.0
         20,000                                                                         90.5%
            $20.0
          15,000
             $15.0
                       90.0%
                                                                                        90.0%
          10,000
             $10.0

             $5.0
                                                                                        89.5%
           5,000
             $0.0
              -                                                                         89.0%
                        2015                  2016                   2017
                                                     Gross Profit
                               Gross Margin
21
                                                     Revenue
                                                                                                   NYSE: TLRA
STABLE, PREDICTABLE, OVERHEAD

                                               136 Heads
                       2%                 4%               People

                       3%            8%
                                                           Marketing

                           7%                              Public Company Costs

                                4%
                                                           IT

                                      73%
                                                           Professional fees

                                                           Office Overhead

                                                           General overhead

      Excludes non-cash items
22
                                                                                  NYSE: TLRA
SIGNIFICANT OPERATING LEVERAGE
                     $20.0

                                                                                               $15
                      $15.0
                                                                           $13

                                                      $10
                      $10.0
                                                                                                                            Adjusted
     Millions

                                    $6
                                                                                                                            EBITDA (1)
                                                                                            20% EBITDA Margin
                       $5.0
                                                                         3% EBITDA Margin

                                                                                                                            Revenue
                      $0.0

                      ($5.0)

                     ($10.0)
                                     Q1 '17                 Q2 '17               Q3 '17              Q4 '17

                (1) Adjusted EBITDA is a non-GAAP financial measure. Please see the discussion in the section called ”Non-GAAP Financial
                Measures” and the reconciliations included at the end of this presentation.
23
                                                                                                                                           NYSE: TLRA
STRONG LIQUIDITY & CAPITAL RESOURCES

                       Millions                                                              December 31, 2017

                       Cash & Cash equivalents                                                         $76.3

                        Total Current Assets                                                          $138.1

                        Total Current Liabilities                                                     $60.9

                             Working Capital                                                           $77.2
                                                             (1)
                        Unused Credit Facility                                                        $25.0

                       Capital Resources                                                              $102.2

24      (1) Reflects Company’s amended credit line with SVB which was effective on January 26, 2018
                                                                                                                 NYSE: TLRA
MINIMAL WORKING CAPITAL REQUIREMENTS

                    85

                    80

                    75
         Days

                    70

                    65

                    60

                    55

                    50

                         Q1’16   Q2’16   Q3’16   Q4’16   Q1’17   Q2’17   Q3’17   Q4’17

                DSO’s     61      70      61     65       84     73       76     73
                DPO’s     52      51      61     61       69     71       80     75

25
                                                                                         NYSE: TLRA
2018 GUIDANCE

          Millions                                               Q1’18                                   FYE ‘18

          Revenue                                              $8.5 - $10.0                             $58.0 - $62.0

          Adjusted EBITDA
                                (1)                           $(4.5) - $(3.5)                           $5.0 - $8.0

          EBITDA Margin                                                                                 9% - 13%

        (1) Adjusted EBITDA is a non-GAAP financial measure. Please see the discussion in the section
            called ”Non-GAAP Financial Measures” and the reconciliations included at the end of this
            presentation.

26
                                                                                                                        NYSE: TLRA
MAINTAINING LONG-TERM FINANCIAL TARGETS

                                                                            3 YR. TARGET

       Revenue (CAGR)                                                            30%-35%                                Exponential Growth

        Gross Margin (average)                                                      90%                                 High Margins

        Adjusted EBITDA Margin                                                   25%-30%                                High EBITDA Margins
        (average) (1)

        Headcount                                                                160-180                                Lean Headcount

        Net Operating Loss (NOL)
        Carry Forward                                                          $101 million

        Capital Expenditures                                              Approx $500K/ Yr                              Low Capital Expenditures

       (1) Adjusted EBITDA is a non-GAAP financial measure. Please see the discussion in the section called ”Non-GAAP
       Financial Measures” and the reconciliations included at the end of this presentation.

27
                                                                                                                                                   NYSE: TLRA
INVESTMENT HIGHLIGHTS
      The Right Strategy & Market Position
         Independent, seller platform with execution, expansion and EBITDA
         Scale and Stickiness with sellers and buyers of premium video
         Laser focused on premium, CTV partners

      The Right Tech
         Speed, control, and analytics, mission-critical sellers demand
         Scalability required to efficiently grow

      The Right Team
         A proven track record of value building
         Committed, supportive and in it to win

      The Right Financials
         High gross margin (90%+), high growth business

28       Operating leverage that delivers EBITDA (+20%) strength
                                                                             NYSE: TLRA
APPENDIX

29
                NYSE: TLRA
NON-GAAP FINANCIAL MEASURE

         To supplement its consolidated financial statements, which are prepared and presented in accordance with U.S. generally
         accepted accounting principles (“GAAP”), Telaria reports Adjusted EBITDA, which is a non-GAAP financial measure. We
         define Adjusted EBITDA as net loss before total interest expense and other income (expense), net, provision for income
         taxes, and depreciation and amortization expense, and adjusted to eliminate the impact of non-cash stock-based
         compensation expense, acquisition related costs, mark-to-market expense, executive severance, retention and recruiting
         costs, disposition related costs, expenses for transitional services and other adjustments. We use Adjusted EBITDA for
         financial and operational decision making and as a means to evaluate period-to-period comparisons. We believe that the
         use of Adjusted EBITDA provides useful information about our operating results, enhances the overall understanding of our
         past financial performance and future prospects, and allows for greater transparency with respect to a key metric that is
         used by management in its financial and operational decision making. Non-GAAP financial measures should be considered
         in addition to results and guidance prepared in accordance with GAAP, but should not be considered a substitute for, or
         superior to, GAAP results. The non-GAAP financial measure included in this presentation has been reconciled to the nearest
         GAAP measure in the table following the financial statements attached to this presentation. With respect to our
         expectations under “Guidance” above, reconciliation of Adjusted EBITDA guidance to the closest corresponding GAAP
         measure is not available without unreasonable efforts on a forward-looking basis due to the high variability, complexity and
         low visibility with respect to the costs and charges excluded from this non-GAAP measure, in particular, the measures and
         effects of stock-based compensation expense specific to equity compensation awards that are directly impacted by
         unpredictable fluctuations in our stock price. We expect the variability of these costs and charges to have a significant, and
         potentially unpredictable, impact on our future GAAP financial results.

30
                                                                                                                                          NYSE: TLRA
NON-GAAP RECONCILIATION

                                                                                              Telaria, Inc.
                                                             Reconciliation of Net Loss from Continuing Operations to Adjusted EBITDA
                                                                                            (in thousands)
                                                                                              (unaudited)

                                                                                                                        Q1 17           Q2 17          Q3 17          Q4 17
                                           Net loss from continuting operations                                          (9,561)       (6,803)          (3,273)          (63)

                                           Adjustments:
                                           Depreciation and amortization                                                   1,021          990             984          1,591
                                           Interest and other expense (income), net                                          27             78            (651)        (646)
                                           Provision for income taxes                                                            9          76             (29)        (403)
                                           Stock-based compensation expense                                                 744            752           1,534         1,691
                                           Acquisition-related costs (1)                                                   825            985               -              -
                                           Mark-to-market expense           (2)                                              55             93              -              -
                                           Executive severance, retention and recruiting costs                               30           302             887            202
                                           Disposition related costs (3)                                                     -            300             600            129
                                           Expenses for transitional services (4)                                            -              -             364            541
                                           Other adjustments        (5)                                                     102             -               -              -

                                           Total adjustments                                                              2,813         3,576           3,689          3,105

                                           Adjusted EBITDA                                                              (6,748)        (3,227)             416        3,042

       (1)   Reflects acquisition-related costs incurred in connection with our acquisition of TVN. Includes compensation-related expenses related to contingent consideration payments that were paid to certain TVN sellers that are subject to
             continued employment.
       (2)   Reflects expense incurred based on the Company’s re-measurement of the estimated fair value of earn-out payments that were paid in connection with the acquisition of TVN and which are not conditioned on continued employment
             with the Company.
       (3)   Professional fees incurred in connection with the Company’s sale of its buyer platform in August 2017.
31     (4)   In connection with the sale of the Company’s buyer platform, the Company entered into a transitional services agreement with the acquirer. Reflects cost incurred providing such transitional services.
       (5)   Reflects amounts accrued in connection with a one-time change in the Company’s employee vacation policy.                                                                                                                      NYSE: TLRA
You can also read