JUNE 2020 INVESTOR PRESENTATION - TSXV: ASG US: AROSF - Lytham Partners
←
→
Page content transcription
If your browser does not render page correctly, please read the page content below
JUNE 2020
INVESTOR PRESENTATION
TSXV: ASG
US: AROSF
FORWARD LOOKING DISCLAIMER

This presentation contains certain statements that may be deemed "forward-looking statements."

All statements in this document, other than statements of historical fact, that address events or developments that the Company expects to occur, are
forward looking statements. Forward looking statements are statements that are not historical facts and are generally, but not always, identified by the
words "expects", "plans", "anticipates", "believes", "intends", "estimates", "projects", "potential" and similar expressions, or that events or conditions
"will", "would", "may", "could" or "should" occur.

Although the Company believes the expectations expressed in such forward-looking statements are based on reasonable assumptions, such statements
are not guarantees of future performance and actual results may differ materially from those in the forward-looking statements. Factors that could
cause the actual results to differ materially from those in forward looking statements include, failure to successfully negotiate or subsequently close
such transactions, inability to obtain required shareholder or regulatory approvals, uncertainty with respect to findings under exploration programs and
general economic, market or business conditions. Investors are cautioned that any such statements are not guarantees of future performance and
actual results or developments may differ materially from those projected in the forward- looking statements.

Forward looking statements are based on the beliefs, estimates and opinions of the Company's management on the date the statements are
made. The Company undertakes no obligation to update these forward-looking statements in the event that management's beliefs,
estimates or opinions, or other factors, should change.

                                                                                                                                                             2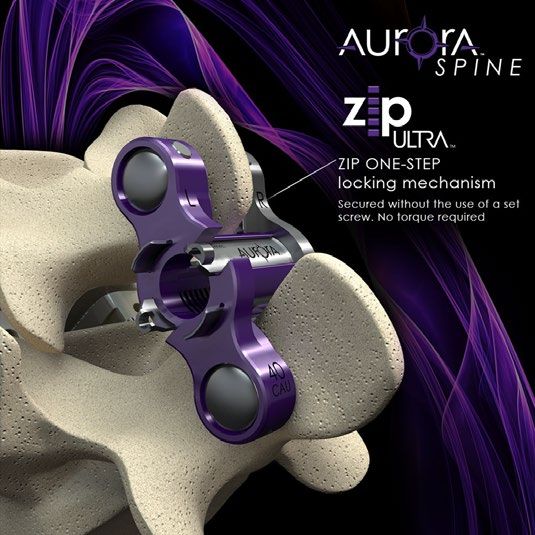
COMPANY OVERVIEW

            Aurora Spine has developed a portfolio
            of solutions for the spinal implant market
            through a series of innovative, minimally
            invasive, regenerative spinal implant
            technologies.
            ►          Headquarters in Carlsbad, CA

            $11.2 M                                                                           27.5%
            Record FY19 Revenue                                                               5-Year Revenue CAGR

             $10 M                                                                           $2.8 M
             Market Cap*                                                                     Pro Forma* Cash Balance
                                                                                             At Dec. 31, 2019
All numbers USD unless noted. *As at December 31, 2019, cash of $444,741. Subsequent to year end, completed a private placement of 8,932,000 common shares with net proceeds of
US $1,637,799. A director of the Company subscribed to and received 1,579,000 shares in exchange for cash of US $300,010. The Company also received government loans under PPP
of US $450,888 and a US $10,000 grant.                                                                                                                                            33
RECENT ACCOMPLISHMENTS

  Strong Revenue Growth
  ► 28% Y/Y growth in FY 2019 to $11.2 million, a new record.

  Ongoing Conversion Away from Low-Margin 3rd Party Products to High-Margin Proprietary Products
  ► The Company has acquired or brought in house key products that were previously 3rd party products which
     will significantly drive gross margin expansion.

  Advanced Product Development
  ► Recently finalized product designs for the Posterior SI Joint fusion products and the ZIP-Flex interlaminar
     fixation device. These products are an important part of numerous new product launch offerings for 2020
     expected to drive incremental revenue growth.

  Expansion into Pain Market
  ► The Company has recently ramped efforts to expand its product offering into the pain market, a robust
     market that is growing year over year.

  Strengthened Balance Sheet
  ► In February 2020, the Company completed a private placement of USD $1.7 million (CDN $2.3 million).
  ► The Company applied for and received USD $450,888 under the CARES Act in the form of a Payroll Protection
      Program loan.
                                                                                                                  4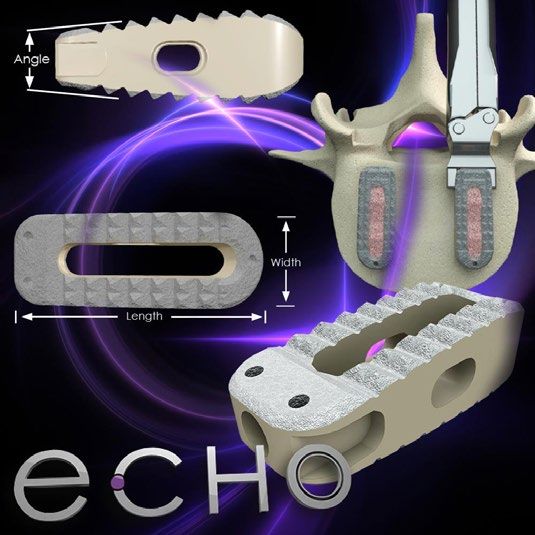
REVENUE GROWTH

                                              $11.2

                                       $8.7

                         $6.8
$ in USD

                                $6.0
                  $4.9

           $2.6

           2014   2015   2016   2017   2018   2019
                                                      5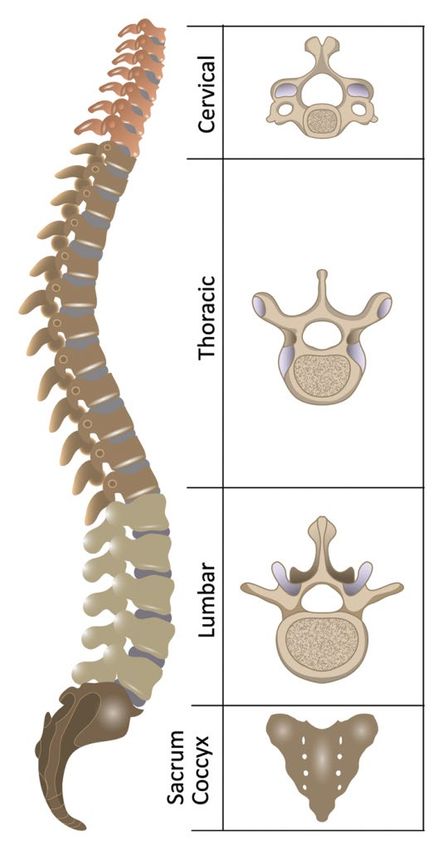
SPINE SURGERY MARKET OVERVIEW

►   Majority of spine surgery is targeted at relieving pain caused by disc
    injury or disease

►   Most surgeries involve damaged disc remediation or removal

►   Removal necessitates fusing together of the vertebrae above and below
    the damaged area

►   Vertebrae must be held in place to ensure bone growth (fusion) between
    the vertebrae

Fusion Devices        Cages            Plates       Stand-Alone     Lumbar Screws   6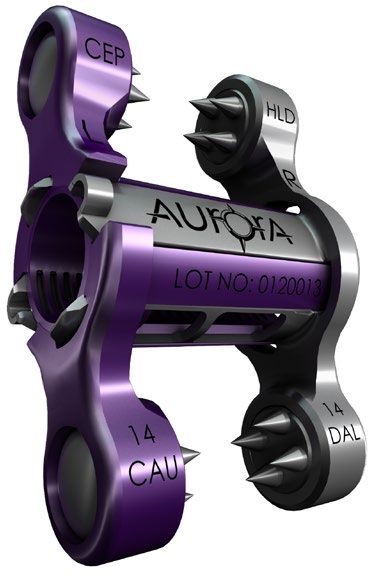
ADDRESSABLE MARKET OPPORTUNITY

► An estimated $9.6 billion spine         SPINE SALES BY SEGMENT 1
  implant market in the U.S.                             ($Millions)

► Market growing at >3% annually

► 80% of the market supplied by 6
  companies

► Innovation comes from the other
  20%

► Successful innovators get
  acquired
                                    1. Source: ORTHOWORLD's The Orthopaedic Industry Annual Report (June 2020)

                                                                                                                 7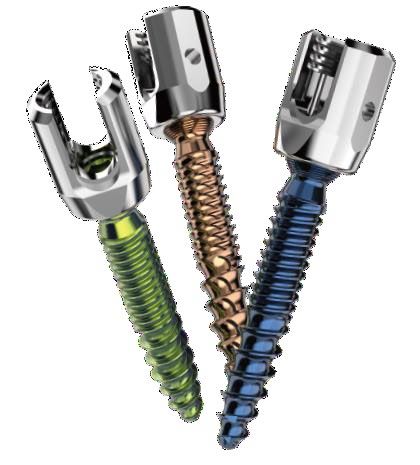
PRODUCT
PORTFOLIO
EXISTING PRODUCT PORTFOLIO
THE ZIP/SCREWLESS PRODUCT TINANO INTERBODY CAGES THIRD PARTY PRODUCTS
LUMBAR SCREWS
►Pedicle Screws are the largest
lumbar segment in spinal
hardware market
STAND-ALONE
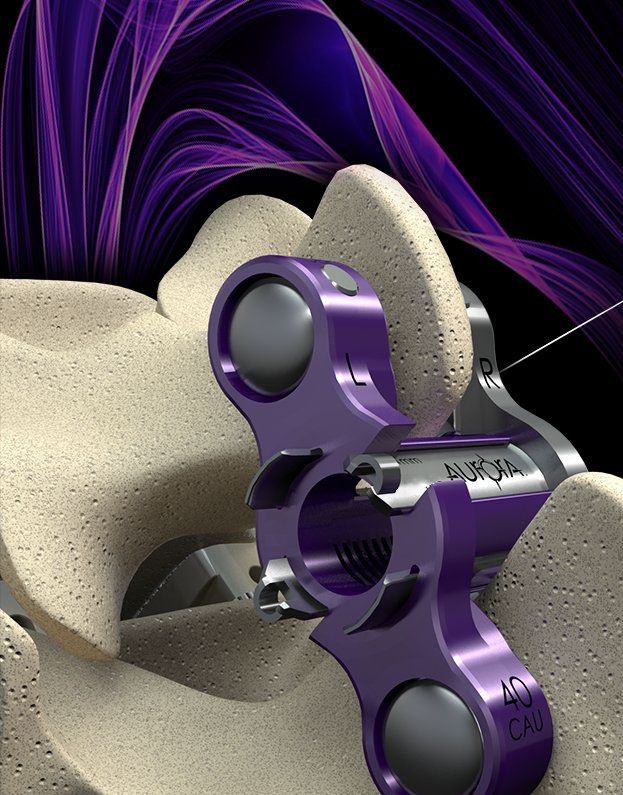
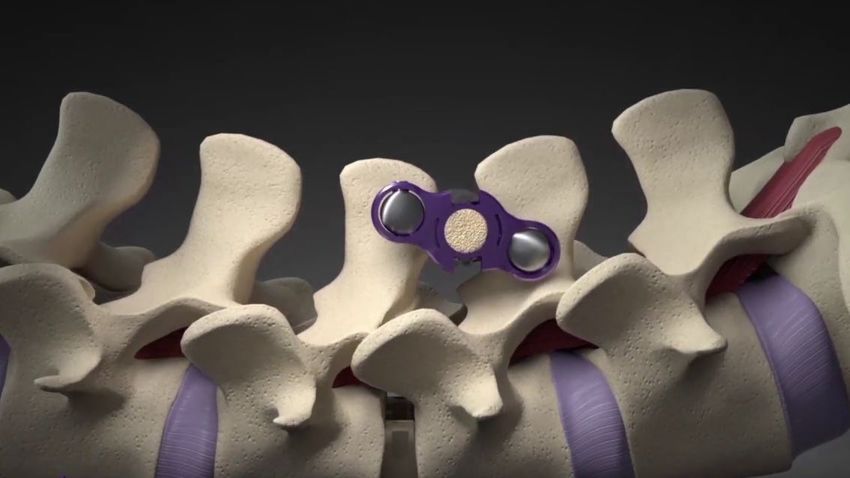
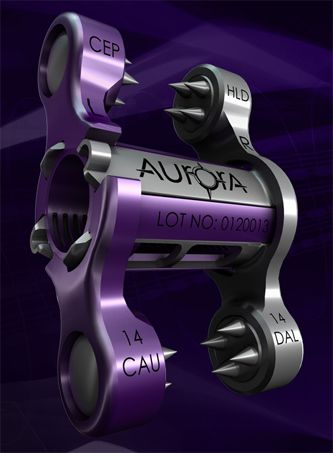
► The ZIP™ Aurora Spine's minimally ► TiNANO™ Aurora Spine's modern, ►Stand-Alone Cage & Screws is a
invasive interspinous fixation implant minimally invasive interbody fusion cages growing market segment
for spinal fusion and was developed with PEEK and coated with TiNANO®
as an alternative to pedicle screw titanium plasma spray coating.
fixation. CERVICAL PLATES
► Reduces OR time by 36%: 98 minutes ►Cervical Plates are the largest
vs. 153 minutes ISP vs. Pedicle cervical segment in spinal
Screws hardware market
► 40% less hospital stay: 1.9 days vs.
3.1 days ISP vs. Pedicle Screws BIOLOGICS
► 69% less blood loss vs. Pedicle ►Human bone allograft products
screws support spinal fusion
9
CASE STUDY / COMPETITIVE ADVANTAGE

Chronic back pain is something                    Minimally invasive ISP devices have been shown in
many people live with each day. It                several studies to have resulted in better outcomes when
is the leading cause of disability in             compared to pedicle screw procedures:
people under 45 years old and                     • Preserves normal anatomy
28% of adults with lower back pain                • Improved fusion and spine stabilization rates
report limited activity due to a                  • Shorter surgery times
chronic condition.                                • 50% lower estimated blood loss
                                                  • Decrease in length of hospital stay
Pedicle screw fixation has been                   • Fewer post-op complications
the most widely used method of                          • Less pain, anemia, infection and exacerbation
stabilization, however there has                             of co-morbidities
been an increase in the use of ISP                • Faster healing times
devices, such as the ZIP™ from                    • Overall decrease in costs for procedures
Aurora Spine, as a less invasive
alternative.

         Source: https://static1.squarespace.com/static/5644c9abe4b049bca5212d67/t/5661b130e4b0ae1476aee413/1449242928316/F220117_C-WhitePaper-IntersinousProcessFixation.pdf   10
KEY VALUE CREATION DRIVERS
FY 2019 REVENUE: PROPRIETARY VS 3RD PARTY

► 3rd Party Products
    ► 54% of all sales in FY 2019 are 3rd party
       products
        ► 100% screws; 41% lumbar cages;
           100% cervical plates

                                                  $ in USD
                                                                               $403,705
                                                                                               $3,887,951
► Conversion to Aurora Spine products expected
  to yield significant increase in contribution
                                                                                                                   $33,060
  margin.
                                                                              $1,866,194

                                                              $1,405,560                                         $1,329,233
                                                                                                                                     $990,641

                                                                                                                                                     $205,515
                                                                                                                                                      $70,950
                                                             Lumbar Devices   Lumbar Cages        Lumbar         Cervical Cages        Cervical      Biologics
                                                                                             Screws/StandAlone                    Plate/StandAlone
                                                                                                Proprietary      3rd Party                                       12
MARGIN EXPANSION:
NEW PRODUCT REPLACEMENT
APOLLO (CERVICAL PLATE) Additional Cervical & Thoracolumbar products in the R&D phase
APOLLO™ is a thin & lowprofile anterior cervical New Technologies for the Ortho, Neuro and Pain
plate with large windows that allow graft access Market will be developed:
& visualization.
► Through a series of R&D developments.
► Acquired Apollo Cervical Plate, the product is
projected to be 510(k) FDA Cleared Product in ► M&A transactions
late-Q4 2020
► Strategic 510(k) purchases
► Will replace current 3rd party product being
sold by Aurora
► 3rd party cervical plate products represent
about $1.1 million of annual revenue and
supports TiNANO™ cervical cage sales.
► Estimated Launch Q4 2020
13REVENUE GROWTH:
NEW PRODUCT DEVELOPMENT
SiLOTM Si Joint (PAIN MARKET) ZIPFlexTM EASiFXTM
SiLO™ Posterior Si Joint Fusion System ZIP FLEX™ is Aurora Spine's minimally invasive EASiFx is Aurora Spine's MIS Si Joint Fusion
posterior non-fusion interspinous implant for System with Fixation. Posterior Si Joint Fusion
► Addresses new market opportunity for Aurora motion preservation. System.
spine -- Joint Pain
► Sacroiliac joint (Si Joint) fusion is a surgical ► This product will compete with CoFLEX & ► A Crossover product: Ortho, Neuro, and Pain
procedure which fuses the iliac bone (pelvis) Vertaflex. Both products were key strategic Physician can all use this product.
to the spine (sacrum) for stabilization. acquisitions by RTI & Boston Scientific. ► Currently in Bio-mechanical testing. Requires
► The Global MIS Sacroiliac Joint Fusion market ► A Crossover product: Ortho, Neuro, and Pain FDA 501(k) approval.
is valued at US $150 million in 2018 and will Physician can all use this product. ► Estimated Launch Q2 2021
reach $450 million by the end of 2025, ► Estimated Launch Q3 2021
growing at a CAGR of 14.7% during 2019-2025.
► A Crossover product: Ortho, Neuro, and Pain
Physician can all use this product.
► Estimated Launch Q3 2020
14REVENUE GROWTH:
NEW MARKET EXPANSION - PAIN
The global pain management devices market size is expected to reach USD 14.55 billion by 2026 registering a
CAGR of 13.8%.
► Pain Management Physicians are reducing use of opioids and increasingly using mechanical devices such as the
ZIP™ & SiLO™.
► North America was the largest regional market in 2018 and held around half of the global revenue share owing
to the increased number of people affiliated with pain requiring management devices.
► Key companies in the global pain management devices market include B Braun Melsungen AG., Baxter
International, Inc., Boston Scientific Corp., Codman and Shurtleff, DJO Global LLC, Pfizer, Inc., Medtronic Plc,
Smiths Medical, Stryker Corp., and St. Jude Medical
15KEY VALUE CREATION DRIVERS
ZIPFlex
EASiFXTM
Q3 2021
SiLOTM
Si Joint Q2 2021
HYDRA
System Q3 2020
Apollo
Cervical Plate
SOLO Q4 2020
Existing Product
System
Q4 2020 Line to Pain
Interventionalist
Q2 2020
FY 2021
3RD Party Replacement Products New Product Introductions New Market Expansion
Gross Margin Expansion Revenue Driver Revenue Driver
16FINANCIALS
INCOME STATEMENT HIGHLGHTS

                                Revenue                                     Gross Profit Margins                                              Adjusted EBITDA
           $12                                       $11.2   60%   56.0%                                                      $2
                                                                           54.9%                                                                                         $0.9
                                                                                                   52.9%
                                                                                   50.1%                                      $1
           $10                                               50%
                                              $8.7                                                                            $0
                                                                                           42.7%
                                                                                                                              ($1)                                              ($0.6)
           $8                                                40%                                                                                       ($0.8)
                                $6.8                                                                                          ($2)                              ($1.3)
                                                                                                           31.8%
$ in USD

                                                                                                                   $ in USD
                                       $6.0                                                                                                   ($2.0)
           $6                                                30%                                                              ($3)
                         $4.9
                                                                                                                              ($4)
           $4                                                20%
                  $2.6                                                                                                        ($5)
                                                                                                                              ($6)
           $2                                                10%
                                                                                                                              ($7)
                                                                                                                                     ($6.9)
           $0                                                0%                                                               ($8)
                 2014    2015   2016   2017   2018   2019          2014    2015    2016    2017    2018    2019                      2014     2015     2016     2017     2018   2019

                 Successful execution of 3rd party to proprietary product strategy could result in a significant increase of
                 incremental gross margins on FY 2019 revenue base, and a return to Adjusted EBITDA profitability

                                                                                                                                                                                         18
BALANCE SHEET HIGHLIGHTS
$ in USD 12/31/2019 Pro Forma Adjustments*
Cash and cash equivalents $444,741 +$2,398,697
Accounts receivable, net $2,443,096
Inventory $1,529,474
Total current assets $4,679,528 +$2,398,697
Property, plant and equipment $1,155,249
Intangible assets $838,915
Total Assets $6,673,692 +$2,398,697
Current liabilities $2,523,223
Long-term debt (due to related parties) $2,100,000
Lease liabilities $282,444
Shareholders’ equity $1,768,025 +$2,398,697
Shares Outstanding 44,477,744 +10,511,000
*As at December 31, 2019, cash of $444,741. Subsequent to year end, completed a private placement of 8,932,000 common shares with net proceeds of US $1,637,799. A director of the Company subscribed to and
received 1,579,000 shares in exchange for cash of US $300,010. The Company also received government loans under PPP of US $450,888 and a US $10,000 grant.
19PEER COMPARISON INFORMATION
As of 6/10/2020 USD
SALES EV/SALES
Ticker Company Stock Price Enterprise Value (TTM) (TTM)
ASG/AROSF Aurora Spine Corporation $0.18 $9.18 $11.20 0.82
SALES EV/SALES
Ticker Company Stock Price Enterprise Value (TTM) (TTM)
MDT Medtronic $96.65 $151,645.48 $31,062.00 4.88
ZBH Zimmer Biomet $134.29 $35,361.24 $7,982.20 4.43
JNJ Johnson & Johnson (DePuy) $147.11 $402,793.81 $82,729.00 4.87
SYK Stryker $201.15 $82,919.66 $14,956.00 5.54
NUVA NuVasive $62.47 $3,205.98 $1,158.93 2.77
RTIX RTI Surgical $3.20 $401.61 $308.38 1.30
SPNE SeaSpine $11.44 $222.24 $159.04 1.40
OFIX Orthofix Medical $36.62 $648.99 $455.67 1.42
KIDS OrthoPediatrics $48.63 $766.29 $74.24 10.32
SIBN SI-Bone $17.51 $448.90 $69.13 6.49
Peer Group 4.34
Discount to Peer Group -81.14%
Note: Reflects pro forma increase in cash and shares outstanding to Enterprise Value
20INDUSTRY ACQUISITIONS
$465+ Million Acquisition MARLBOROUGH, Mass., May 9, 2019 -- Boston
Scientific (NYSE: BSX) today announced that it has
entered into a definitive agreement to acquire
Vertiflex, Inc., a privately-held company which has
developed and commercialized the Superion® Indirect
~$60 Million FY 2019 Sales Decompression System, a minimally-invasive device
used to improve physical function and reduce pain in
patients with lumbar spinal stenosis (LSS). The
procedure – primarily performed by physicians who
treat chronic pain patients with therapies including
7.8X Revenue
spinal cord stimulation and radiofrequency ablation –
is expected to reach $60 million in sales in 2019. The
transaction consists of $465 million in upfront cash
and additional payments contingent on commercial
milestones for the next three years.
212020 MILESTONES AND OBJECTIVES
Execute initiative to focus on new products.
► Full conversion to proprietary products slated by end of FY20 and FY21
Return to EBITDA profitability
► Aurora continues to focus on strategic product expansion, to significant increase incremental gross
margins on FY 2019 revenue base
New product introductions to drive revenue growth
► Expand sales focus into Pain Interventionalist market
► SiLO Si Joint launch in 2H:20
► EasiFix launch Q1:21
FDA approval of ZipFlex Q2 2021
► Goal to launch product in Q3 2021
Commence U.S. investor relations focus for the company
22MANAGEMENT TEAM
Trent Northcutt Laszlo Garamszegi Dave Meyer
Chief Executive Officer Chief Technology Officer VP & Chief Legal Officer
• 20+ years experience in • 20+ years experience in • 25+ years of legal experience
medical device market medical device market and 30+ business experience
• VP of Sales and Business • Co-inventor of the ZIP ISP • COO of Anthony Robbins
Development for Aphatec • Co-founder of several Companies
Spine, Inc. successful medical start-ups • Represented clients including
• VP of Spineart USA, Inc. • Co-inventor of 4Closure Pulte Homes, Chevy’s, Ross
• VP Sales and Operations at Laparoscopic Fascia Closure Dress for Less, Gymboree,
Lanx, LLC – responsible for Device; subsequently sold to Oakland Alameda County
launching Aspen ISP fusion Baxter Int’l (NYSE: BAX) Coliseum and Carruth Cellars
device • Holds 11 patents in US for
spinal implant designs
23BOARD OF DIRECTORS
David Rosenkrantz Trent Northcutt Jim Snow Mike Seid Daryl Maclellan Tracy Graf
Chairman CEO Board Member Board Member Board Member Board Member
• 18+ years • 20+ years experience • 23+ years executive • 17+ years of • President of • President of
experience in in medical device healthcare investment, finance, Desante Financial Carfinco Financial
investment banking market management and management and Services, Inc. and Group Inc. (TSX:
• Co-founded Patica • VP of Sales and start-up experience operations Managing Director CFN) since 1998
Corporation in 1993 Business Development • President and CEO experience of Maximum • Was General
• VP of Spineart USA, for Aphatec Spine, Inc. of Renaissance • President and Financial Services Manager of Graf
Inc. • VP of Spineart USA, Biologic and managing partner of Inc. Management and
• Focus on financing Inc. Medical Resources Axxcess Wealth • Was President of CIT Cattle Co. Ltd.
equity needs for • VP Sales and • Co-founded US Management Canada and • Board position with
small-cap, high Operations at Lanx, LLC Healthworks and • Director of Axxcess President of CIT Canadian Simmental
growth companies. – responsible for served as VP of Healthcare Group, Group Securities Association and
launching Aspen ISP M&A LLC, focus on early (Canada) Inc. director of
fusion device • Co-founded stage life science • Board member of Casablance Capital
Integrated and medical device the Canadian Corp.
Healthcare Services companies Financing Lease
(IHS) Association 24You can also read