STRUCTURAL CHANGE & DIGITALIZATION - SEPTEMBER 23, 2019 | STRÖER SE & CO. KGAA - STRÖER

Page created by Wallace Garner
 
CONTINUE READING
STRUCTURAL CHANGE & DIGITALIZATION - SEPTEMBER 23, 2019 | STRÖER SE & CO. KGAA - STRÖER
Structural Change & Digitalization
September 23, 2019 | Ströer SE & Co. KGaA
STRUCTURAL CHANGE & DIGITALIZATION - SEPTEMBER 23, 2019 | STRÖER SE & CO. KGAA - STRÖER
Agenda

01                  02                                 03
Structural Change   20 years of preparation            Statista
                    -Ready for the digital take-off-

                    • Location                         Building a DaaS Unicorn
                    • Hardware

                    • Sales Strategy & Timing

                    • Tech know how

                    • DOOH market landscape

                                                                                 2
STRUCTURAL CHANGE & DIGITALIZATION - SEPTEMBER 23, 2019 | STRÖER SE & CO. KGAA - STRÖER
OOH Market outperforming Ad Market – Ströer with unique Position
Index 2005 = 100

Index               Google scaling             Economic and                                                           Facebook scaling                               Amazon Media
                    their business             financial crisis                                                        their business                               Retail scaling their
 160
                                                                                                                                                                        business

                                                                                                                                                                                                   154   OOH
 150                                                                                                                                                                                   150
                                                                                                                                                                      150
                                                                                                                                                                                           CAGR
                                                                                                                                                                                           3.1%1
 140

                                                                                                                                                             134
 130                                                                                                                                            131                                        CAGR
                                                                                                                                                                                           1.5%1

                                                                                                                                                                                                   123
                                                                                                                                                                                                         Ad
 120                                                                                                                               120                                               121
                                                                                             117                                                                      119
                                                                                                                       116                                   117
                                   111                                                                     113                                      114
 110                                            111                                        109                                         112                                ~60%             ~40%
                                     107
                     106                                                                               108                108
        100                                     105                            106
                      102                                         102
 100                                                                       100
        100
                                                                                                                                                                            Ströer OOH Share
                                                                  96                                                                                                        Others
  90
    2005         2006         2007         2008           2009          2010          2011         2012            2013         2014         2015         2016     2017        2018e          2019e

                                                                                     Advertising Market2         OOH* Market3

1CAGR 2005 – 2019e

Source: 2 3Zenith Media/ZAW net; *OOH incl. billboard, transport media incl. Public Video and Infoscreen, at-retail-media incl. Mall Video, ambient media
**ZAW, Ströer Data                                                                                                                                                                  3
STRUCTURAL CHANGE & DIGITALIZATION - SEPTEMBER 23, 2019 | STRÖER SE & CO. KGAA - STRÖER
Robust long-term growth of Out of Home Segment in Germany

Market share of total
ad market in %

 8                                                                                              +121%
                                                                                                                                                                        7,7

                   Google scaling                 Economic and                                                    Facebook scaling                          7,1
                   their business                 financial crisis                                                their business                   7,0
 7

                                                                                                                                            6,3
                                                                                                                                                      Amazon Media
 6                                                                                                                                   5,8              Retail scaling
                                                                                                                                                      their business
                                                                                                               5,3         5,3

                                                                                      4,9          4,9
 5
                                                            4,5
                                                                         4,3
                                   4,0          4,0
 4
                      3,6
         3,4

 3
        2005         2006         2007         2008        2009         2010         2011         2012        2013         2014      2015   2016   2017    2018        2019e
                                                                                              OOH share*

Source: Nielsen Media Research, gross advertising without advertising mail
*OOH incl. billboard, transport media incl. Public Video and Infoscreen, at-retail-media incl. Mall Video, ambient media                                          4
STRUCTURAL CHANGE & DIGITALIZATION - SEPTEMBER 23, 2019 | STRÖER SE & CO. KGAA - STRÖER
Tectonic Shifts in classic German Media Landscape
Decline of Print going on, decline of TV becoming visible – OoH wins significantly

German advertising market Q1-Q2 2018 vs. Q1-Q2 2019

                   -1.3%                                                                  Total ad market:
                                                                                          - 0.7% gross*
                                                                                          - 2.5% net (estd.)

                                                       -3.7%
                                                                                                              2018   2019

                                                                          3.2%
                                                                                   8.8%
                                                                                                         < 1%

                TV                                  Print              Online    OoH                  Radio

Source: Nielsen Media Research Gross Advertising (Germany); *Nielsen                                          5
STRUCTURAL CHANGE & DIGITALIZATION - SEPTEMBER 23, 2019 | STRÖER SE & CO. KGAA - STRÖER
Better together: Facebook and OOH
More efficient than expected

 38% in the US have visited a Facebook Page or posted
   on FB after seeing an OOH ad, 25% have posted to
   Instagram
 Also applies for Germany
 Using a combination of the two channels extends the
   reach of campaigns to a broader and younger audience,
   advertisers reach more efficiently their objectives.
 Comparing different approaches, using both Facebook
   and OOH ads worked best –the combined impact is
   13% more efficient than expected and 15% more
   efficient than Facebook only.
 In addition to influencing consideration, Facebook and
   OOH also have a strong impact on buying.

https://specialreports.oaaa.org/facebook-combine-ooh-with-facebook-ads/   6
STRUCTURAL CHANGE & DIGITALIZATION - SEPTEMBER 23, 2019 | STRÖER SE & CO. KGAA - STRÖER
Two Key Business Approaches with a very different Profile

                                                vs
      LOCAL                                                        GLOBAL
      HEROES                                                       CHAMPIONS
   Local market specification know-how               Global tech-based standardisation
   Local execution quality                           Global premium content rights
   Local do-it-for-you solutions with strong         Global data-supported network
    local client access                                effects

          Strong barrier to entry                                Strong barrier to entry

                                                                                           7
STRUCTURAL CHANGE & DIGITALIZATION - SEPTEMBER 23, 2019 | STRÖER SE & CO. KGAA - STRÖER
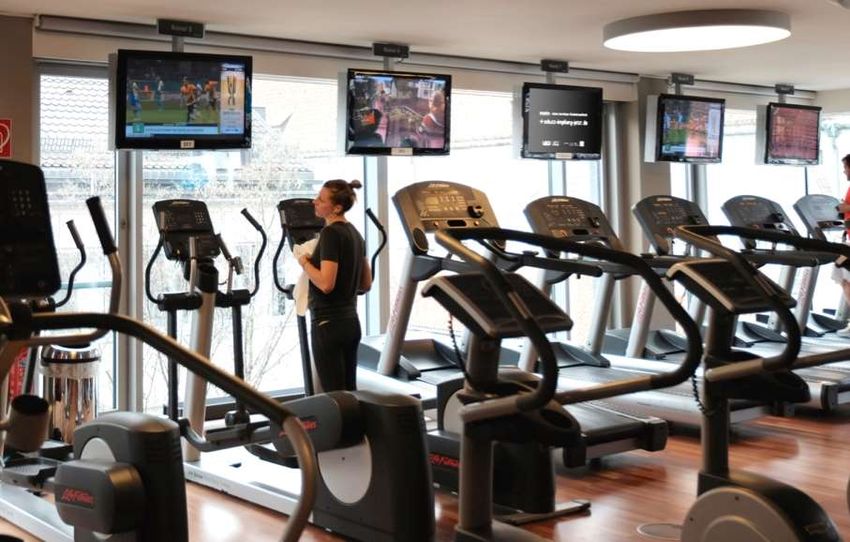
Market View: Quantitative Analysis
Almost 30% of the advertising market is regional expenditure
Net advertising spendings in € billion
  48.3
                                                                                                                              national
                                                                                                                                           Determination of regional
                                                                                                                                           advertising spendings by
                                                                                                                                           category:
                                                                                                                                           Proportion of regional expenditure
                                                                                                                                           in categories based on the
                                                                                                                                           Schickler Media Index

                                                                 Ströer OoH marketshare                                                    Deduction on the basis of:
                                                               regional: ~2% of regional ad
                                                                          market                                                             Studies & Publications
  34.9              2.6                                                                                                                      Project experience Schickler
(72.2%)          (19.5%)
                                      0.4              0.5                                                                                   market assessments
                                                                         0.7               1.2
                                    (3.0%)           (3.4%)                                                                   regional
                                                                       (5.1%)                                5.2
                                                                                         (8.8%)
                                                                                                          (39.0%)                            Ongoing updates of the
                                                                                                                                              Schickler market model
                                                                                                                               2.8
  13.4                                                                                                                       (21.2%)
(27.8%)

  Σ Ad-            Print          Radio/TV/           OOH             Directory         Direct-            Online          Fairs &
  market                           Cinema                             Services         marketing                          Sponsoring

Source: Schickler Research | Simplified presentation of categories | Adjusted for regional advertising spendings of national advertisers                          8
STRUCTURAL CHANGE & DIGITALIZATION - SEPTEMBER 23, 2019 | STRÖER SE & CO. KGAA - STRÖER
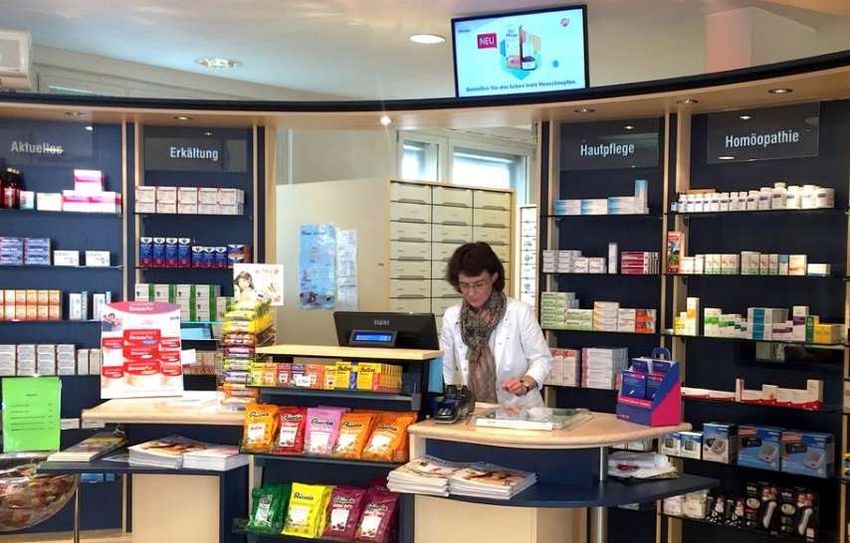
Steep and steady Growth of Ströer’s core financial KPIs
Revenues                                                                                                                                                              Op. EBITDA
m€                 Google scaling           Economic and                                             Facebook scaling                                                 m€
                   their business           financial crisis                                          their business                                       IFRS 16
                                                                                                                                                                         1   700
                                                                                                                                                                              Revenues
                                                                                                                                                                     1670
1.600                                                                                                                                              1582
                                                                                                                                                                             Adj. EBITDA
                                                                                                                                                                             600
1.400                                                                                                                                                                    1
                                                                                                                                                                      560
                                                                                                                                          1283

1.200                                                                                                                                                                        500
                                                                                                                                 1123

1.000
                                                                                                                                                                             400
                                                                                                                     824                                  368
  800
                                                                                                                                             327                             300
                                                                                                               721
                                                                          577                                                       283
  600                                                            531                           622
                               509         493
                                                                                     561                                                                                     200
                                                          470                                                              208
        359         440
  400
                                                                           132                                 148
                                118        103
                                                                   127                         118                                                                           100
                                                                                     107
  200                                                    100
        82          86

    0                                                                                                                                                                        0
     2005        2006        2007        2008          2009     2010     2011       2012     2013        2014           2015      2016     2017       2018       2019e

                                                                         Ströer Revenues   Ströer Op. EBITDA

1 Consensus as of 9/2019, Adj. EBITDAe incl. IFRS 16

Source: Ströer Data                                                                                                                                              9
STRUCTURAL CHANGE & DIGITALIZATION - SEPTEMBER 23, 2019 | STRÖER SE & CO. KGAA - STRÖER
Margin & Growth Profile: Unique Positioning amongst national Peers

                                            Organic revenue growth Av. (2014A – 2018A) vs. op. EBITDA margin Av. (2014A – 2018A)

                                    9%
                                                                                                                            Ströer OOH+
                                    8%                                                                                     (31%/8%)
           Organic Revenue Growth

                                    7%
                                    6%
                                    5%
                                    4%
                                    3%                                                Outfront Media¹
                                                                                     (30%/3%)                                                                   Lamar Advertising
                                    2%                                                                                               Peer Average²              (44%/3%)
                                                                                                                                    (33%/3%)

                                    1%                                     APG I SGA 3
                                                                          (25%/2%)
                                    0%
                                      15%              20%                         25%                         30%                         35%                         40%                         45%            50%
                                                                                                                    EBITDA Margin

                                                                                                                                                                                                         op. EBITDA Margin

Source: Public company filings, company information, IBES, broker research. Note: EBITDA margin for Outfront Media based on operating income before depreciation, amortization, net gain (loss) on
dispositions, stock-based compensation, restructuring charges and loss on real estate assets held for sale. 2 Includes Lamar Advertising, Outfront Media, APG I SGA (Organic revenue growth for 2014A,
2015A and 2018A only). 3 Organic revenue growth based on 2014A, 2015A and 2018A. 4 EBITDA margin based on operating income before depreciation, amortization, net gain (loss) on dispositions,
stock-based compensation, restructuring charges and loss on real estate assets held for sale.                                                                                                                10
Agenda

01                  02                                 03
Structural Change   20 years of preparation            Statista
                    -Ready for the digital take-off-

                    • Location                         Building a DaaS Unicorn
                    • Hardware

                    • Sales Strategy & Timing

                    • Tech know how

                    • DOOH market landscape

                                                                                 11
Location
Roadside – 20 years of securing locations
                             Portfolio Development                               Total Ströer share of large format
                                   Since 1998                                           premium locations*

 12000

 10000

                                                                                                                 Market
  8000                                                                                                           share
                                                                                                                 approx.
                                                                                                                 90%
  6000

  4000

  2000

     0

                                   #Mega-Light and Roadsidescreens

Source: Ströer data; * Premium locations for >9 sqm Megalight /Digital Screens

                                                                                                                      12
Location
Marketplace – Train stations & Malls
    INFOSCREEN                         DERG                                     Building up                             ECE Flatmedia
     Acquisition                     Acquisition                           Public Video Network                           Take-over

                  2004                 2005                                       2011                                     2012         …

                   1.000   Screens                       3.000   Screens                              5.000   Screens
                                         Station Video
     Infoscreen

                                                                                         Mall Video
                                                         2.000

                    500                                                                               2.500
                                                         1.000

                      0                                     0                                            0

                                                                                                                                  13
Location
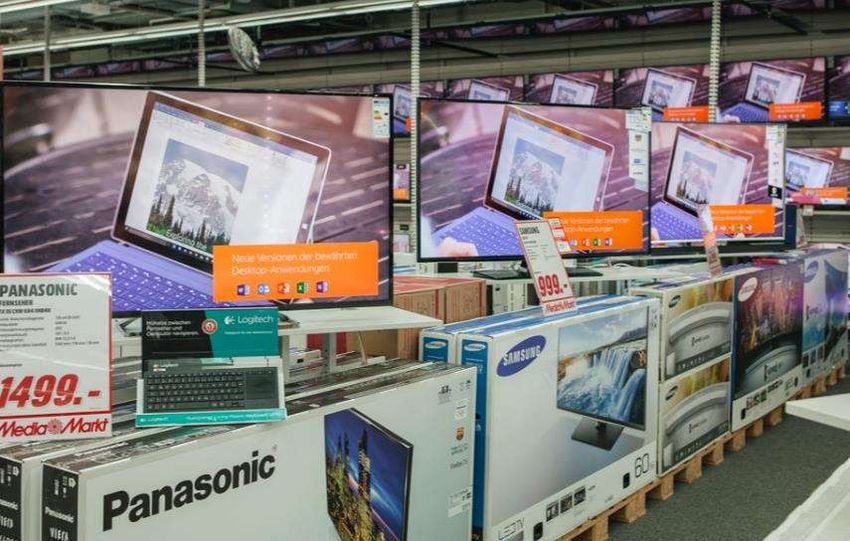
POS – UAM is the dominating player in DOOH longtail
                POS/Digital Signage: 73,000 screens in total

Mediamarkt-TV                Cinema Channel                Active-TV

 Apotheken-TV                McDonald‘s-TV                Taxi-Channel

                                                                         14
Hardware
Foundation of R&D and Sourcing office in China 10 years ago
                                    Panel Price                    Ströer uses own sourcing with priority Shanghai
                                   Development                      office (under native management, 100% Ströer
                                                                    employed)
                                                                   Prices for high quality LED Screens are constantly
                                                                    declining → more locations become efficient due to
                                                                    decreasing CAPEX per location
                                          - 62%

                                                                                                             Shanghai
                                                                                                        (Ströer Asia Office)

                                                                                                          Shenzhen
      2013           2014          2015      2016   2017   2018                                Zhuhai

Source: SMD outdoor pricelist 2013-2020                                                                             15
Hardware
Building up own sourcing expertise in China
                        Foundation
                        R&D Office

 Setup of R&D and Sourcing Office in People Republic of
    China
 Access to the largest LED manufacturing market
 Developing proprietary solutions
 Building up own Tech expertise

      Start in 2009

Germany is the digitally less penetrated OOH market in
Europe.
         Ströer has waited for the tipping point in panel
         prices to accelerate digitalization.

                                                            16
Sales Strategy & Timing
Building the only national sales force for local ad products globally
                       Strong growth of local &                        Local Market Know-How and execution quality
                          digital sales force                         Local presence enables short routes to the customer

 Sales team/FTEs        2016     2017    2018     e2019      e2020

Regional consultants     89      118     139          153+   160+

    Local sales          243     284     340          670+   850+

    “Digital only“
                         62       58     107          151+   160+
     consultants
  Ströer SME only
                         40       35      45           65     70+
 call center agents

      TOTAL              434     605     821      1,039+     1,235+

         Ströer customer mix (OoH revenues)
                                           Regional
                                           National

                               59%

                                                                                                                 17
Sales Strategy & Timing
Local Sales maximizes Monetization of digital roadside Assets without
cannibalization

Micro business                                                               Medium-sized

                 Event/cultural    Content            Regional key account

                                                                             18
Tech know how
Programmatic Public Video (PPV): Taking off since Q4/2018
     Historic developments and long-term market                       Continuous strong organic growth of I/O-business
                     education                                             with accelerated programmatic demand
                                                                    Absolute & relative development of revenue streams
    2016 (HY 2): First beta test with Vivaki and Active Agent to
     test market acceptance and define tech design
                                                                                                                                  25%
    2017: Optimisation of DOoH playout systems parallel to                                                                                    Programmatic
     synchronisation with online logics (e.g. 1:1 vs. 1:many) to                                                                               Traditional
     develop scalable technological setup
    2018: Continuous integration of market leading DSPs
     including on-going product enhancement and sales rollout
                                                                        Q1 2018            Q2 2018            Q3 2018           Q4 2018

    Broad range of DSPs integrated since mid 2018                                 Current features & product roadmap

                                                                                      live                                   Q2-4/2019
                                                                             Multi Geo-Fencing                             Dynamic Creative

                                                                               Event Targeting                            Public Re-Targeting

                                                                               Socio Targeting                           Full PMP Functionality

                                                                                                                                          19
Tech know how
Digital Dividend pays off - Incremental programmatic revenues
                                                                                         Programmatic Public Video 27/2018 – 37/2019
      Global digital programmatic ad spends 2019*
                                                                                                Sustainable growth of bookings
                                 Programmatic                           Programmatic
                                                                        Traditional    HY2 ‘18                                    YTD ‘19
                                 Traditional                                                                +63%

               65%                                            39%

              Global                                       Germany

              Ströer programmatic share in 2019**
                                 Programmatic                           Programmatic
                                 Traditional                            Traditional

               42%                                            24%
                                                                                       18-25
                                                                                       18-27
                                                                                       18-29
                                                                                       18-31
                                                                                       18-33
                                                                                       18-35
                                                                                       18-37
                                                                                       18-39
                                                                                       18-41
                                                                                       18-43
                                                                                       18-45
                                                                                       18-47
                                                                                       18-49
                                                                                       18-51
                                                                                       19-02
                                                                                       19-04
                                                                                       19-06
                                                                                       19-08
                                                                                       19-10
                                                                                       19-12
                                                                                       19-14
                                                                                       19-16
                                                                                       19-18
                                                                                       19-20
                                                                                       19-22
                                                                                       19-24
                                                                                       19-26
                                                                                       19-28
                                                                                       19-30
                                                                                       19-32
                                                                                       19-34
                                                                                       19-36
     Online programmatic                             OoH programmatic

Source: *Zenith Programmatic Marketing Forecast 2019; **Ströer data                                                          20
Tech know how
OS Data Solutions - Products & Solutions
                                                                           NEW                                          NEW

 Targeting                               Data Only                                Insights
   Over 50 Mio. UU NEU                  High-quality first party data for        Insight into customer structures and
                                            programmatic campaigns for agencies       motivations
   Retail & intent data    NEU
                                            and direct customers                   Analysis of brand interests
   Varied affinities                    High reach for target group              Identification of relevant target groups
   Socio-demographic data               Individual consulting
   Lookalike modelling
   Branding & performance orientated

                                                                                                                        NEW

Audience Measurement                    Customized Services                       CRM Onboarding
 Proof of quality and effectiveness     Customized audiences                     Cookie pools based on offline or CRM
 Reach of the campaign target group     Generating individual insights            data
 Reduction of spreading loss            Consulting by data experts with many     E-Mail and postal CRM onboarding
 Increase of campaign efficiency          years of professional experience        Highest data protection standards

                                                                                                                21
DOOH Market landscape
Best prepared for Growth Path of Out-of-Home Digitization
                    Investment volume OoH
              Clear focus on digitization of inventory                                         Public Video Network                Roadside Screens              POS/Digital Signage*

   Analog                                                          Roadside
    40%                                                            Screens
                                                                     34%                                                          Others                            Others
                                                                                                                      Others      (only few                         (strongly
                                                                                                                      (strongly   key players)                      fragmented)
                                                                                                                      fragmented)

                                                                                                                                                      Pipeline

                                                           Public Video                                 ~4.650                           ~340                          ~73,000
                                                              26%

                                                                                                       Screens                         Screens                         Screens

Source: Ströer data, https://www.dmi-org.com/downloads/Digital_Out_of_Home_Standorte_Screens.pdf; *excluding rights of promotion                                        22
Agenda

01                  02                                 03
Structural Change   20 years of preparation            Statista
                    -Ready for the digital take-off-

                    • Location                         Building a DaaS Unicorn
                    • Hardware

                    • Sales Strategy & Timing

                    • Tech know how

                    • DOOH market landscape

                                                                                 23
Statista
Building a global DaaS Unicorn

                                 24
Building a global DaaS Unicorn
Statista is the leading global Data as a Service (DaaS) Business
Statista – Overview

         Statista business model is based on:
                                                                                         22,500                                   40
 Subscription-based data marketplace with low churn
 Highly profitable with mid double-digit organic growth
 A global Blue Chip customer base across all key industries
 No direct competition                                                                     sources                           countries
                                                                                        Thereof 50% exclusive                 Top 4 countries:
             6 offices in international hubs                                          35% exclusive secondary            USA, UK, Germany, Asia
                                                                                15% free accessible secondary sources   US largest market since 2019

                                  AMS         HH WAW
                          NY
                                 Amsterdam Hamburg Warsaw
                                     PRS
                                                                 PVG
                                                                Shanghai                 80,000                          8.5 million
             LAX         New York LDN Paris                             HND
                                London        DXB              ICN      Tokyo
           Los Angeles                                         Seoul
                                              Dubai

                                                             SIN
                                                            Singapore

                                                                                             topics                       unique visitors
                         5 additional offices planned                                      on statista.com              monthly on our German and
                                                                                                                          international websites

                                                                                                                                       25
Building a global DaaS Unicorn
Statista is the leading global Data as a Service (DaaS) Business

      Tech           Media          Consulting      Corporate      Public Sector

                                                                          26
Building a global DaaS Unicorn
Statista is the leading global Data as a Service (DaaS) Business
Statista – KPIs

 Revenue                                                                                         More than 60% of sales generated outside Germany
                                                                                                 Share of account sales in 2018 (% of total)*

                                                                              200m€                     Europe                                               Americas

     Ströer acquisition                                 +35%
         Dec 2015                                       CAGR
                                                                                                                                                     37%

                                                                                                                  58%

    2015     2016     2017      2018    2019e 2020e 2021e 2022e 2023e

  Strong upside potential for both, number of users and ARPU                                                                                   5%
  1.7 million registered user: CAGR 2015 – 2019e of 35%
  In developed markets we expect EBITDA margins in the mid                                                                                                Rest of world
   thirties

* Non-GAAP sales according to management reporting. No defferal of unrealised income; CAGR = compounded annual growth rate                                   27
Disclaimer

This presentation contains “forward looking statements” regarding Ströer SE & Co. KGaA (“Ströer”) or the Ströer Group,
including opinions, estimates and projections regarding Ströer’s or the Ströer Group’s financial position, business
strategy, plans and objectives of management and future operations.
Such forward looking statements involve known and unknown risks, uncertainties and other important factors that could
cause the actual results, performance or achievements of Ströer or the Ströer Group to be materially different from future
results, performance or achievements expressed or implied by such forward looking statements.
These forward looking statements speak only as of the date of this presentation release and are based on numerous
assumptions which may or may not prove to be correct. No representation or warranty, express or implied, is made by
Ströer with respect to the fairness, completeness, correctness, reasonableness or accuracy of any information and
opinions contained herein.
The information in this presentation is subject to change without notice, it may be incomplete or condensed, and it may
not contain all material information concerning Ströer or the Ströer Group. Ströer undertakes no obligation to publicly
update or revise any forward looking statements or other information stated herein, whether as a result of new
information, future events or otherwise.

                                                                                                               28
29
You can also read