HEARTLAND VALUE FUND - Heartland Advisors
←
→
Page content transcription
If your browser does not render page correctly, please read the page content below
HEARTLAND
                                              VALUE FUND

An investor should consider the Fund’s investment objectives, risks, and charges and expenses carefully before investing or sending money.
    This and other important information can be found in the Fund’s prospectus. To obtain a prospectus, please call 800-432-7856 or visit
                                heartlandadvisors.com. Please read the prospectus carefully before investing.
                                        The Heartland Funds are distributed by ALPS Distributors, Inc.
Risk Disclosure:
The Value Fund seeks to capture long-term capital appreciation by investing in         Sector and Industry classifications are sourced from GICS®. The Global Industry
micro- and small-cap companies. The micro- and small-cap segment of the stock          Classification Standard (GICS®) is the exclusive intellectual property of MSCI Inc.
market is robust with thousands of publicly traded issues, many of which lack          (“MSCI”) and S&P Global Market Intelligence (“S&P”). Neither MSCI, S&P, their
traditional Wall Street research coverage. Thus, we believe this market is often       affiliates, nor any of their third party providers (“GICS Parties”) makes any
inefficient, mispricing businesses and offering opportunities for fundamental          representations or warranties, express or implied, with respect to GICS or the results
                                                                                       to be obtained by the use thereof, and expressly disclaim all warranties, including
research-minded investors such as Heartland. The Fund utilizes Heartland’s             warranties of accuracy, completeness, merchantability and fitness for a particular
disciplined and time-tested 10 Principles of Value InvestingTM, designed to capture    purpose. The GICS Parties shall not have any liability for any direct, indirect,
upside potential while minimizing downside risk.                                       special, punitive, consequential or any other damages (including lost profits) even if
The above guidelines are applied under normal market conditions, and may change        notified of such damages.
over time. The returns and charts presented show historical patterns and are not       Diversification does not eliminate the risk of experiencing investment losses.
intended to be indicative of any Heartland product, except as indicated.
                                                                                       Indices: Dow Jones U.S. Total Stock Market Index which comprises all U.S. equity
Past performance does not guarantee future results and there can be                    securities with readily available prices and includes sub indexes categorized by size
no assurance that historical patterns will continue, and if they did, how              segments which are based on full market capitalization rankings with Large-Cap
long they will continue. Current performance may differ due to market                  including stocks ranked 1-750, Mid-Cap including stocks ranked 501-1000, Small-
volatility.                                                                            Cap including stocks ranked 751-2500, and Micro-Cap including stocks ranked 2501
Because of ongoing market volatility, performance may be subject to substantial        and up. iShares Russell 2000 ETF: is an exchange-traded fund that seeks to
short-term changes. The value of the Fund’s investments will vary from day to day in   generate investment results that correspond to the general price and yield of an
response to the activities of individual companies and general market and economic     index. Russell 2000® Index: includes the 2000 firms from the Russell 3000® Index
conditions, which may cause loss of principal.                                         with the smallest market capitalizations. Russell 2000® Growth Index (“Growth”)
                                                                                       measures the performance of those Russell 2000® companies with higher price-to-
The Value Fund invests primarily in small companies selected on a                      book ratios and higher forecasted growth characteristics. Russell 2000® Value Index:
value basis. Such securities generally are more volatile and less                      measures the performance of those Russell 2000® companies with lower price-to-
liquid than those of larger companies. Value investments are                           book ratios and lower forecasted growth characteristics. S&P 500 Index: is an index
                                                                                       of 500 U.S. stocks chosen for market size, liquidity and industry group representation
subject to the risk that their intrinsic value may not be recognized                   and is a widely used U.S. equity benchmark. All indices are unmanaged. It is not
by the broad market.                                                                   possible to invest directly in an index.
The statements and opinions expressed in this document are those of the                Russell Investment Group: is the source and owner of the trademarks, service marks
presenter(s). Any discussion of investments and investment strategies represents       and copyrights related to the Russell Indices. Russell® is a trademark of the Russell
the presenter’s views as of the date created and are subject to change without         Investment Group.
notice. The opinions expressed are for general information only and are not intended
to provide specific advice or recommendations for any individual. Any forecasts may    Data Sourced from FactSet: Copyright 2019 FactSet Research Systems Inc.,
not prove to be true.                                                                  FactSet Fundamentals. All rights reserved.
Heartland Advisors defines market cap ranges by the following indices: micro-cap by    Definitions available on last page of presentation.
the Russell Microcap®, small-cap by the Russell 2000®, mid-cap by the Russell          All information is as of the most recent quarter-end unless otherwise noted.
Midcap®, large-cap by the Russell Top 200®.

                                                                       *Inception date: 12/28/1984
                                                           Source: FactSet Research Systems Inc. and Russell®
                    In the prospectus dated 5/1/2019, the Gross Fund Operating Expense for the investor class shares of the Value Fund is 1.07%.
Past performance does not guarantee future results. Performance represents past performance; current returns may be lower or higher. The investment return and
principal value will fluctuate so that an investor's shares, when redeemed, may be worth more or less than the original cost. All returns reflect reinvested dividends
and capital gains distributions, but do not reflect the deduction of taxes that an investor would pay on distributions or redemptions. Subject to certain exceptions,
shares of a Fund redeemed or exchanged within 10 days of purchase are subject to a 2% redemption fee. Performance does not reflect this fee, which if deducted
         would reduce an individual's return. To obtain performance through the most recent month end, call 888-505-5180 or visit heartlandadvisors.com.          HLF6509/0120
                                                                                                                                                                                2
Heartland Advisors

                     HLF6509/0120
                                3
As of 9/30/2019
*Amount team members have collectively invested in Heartland mutual fund products.
        Past performance does not guarantee future results.                          HLF6509/0120
                                                                                                4
There is no guarantee that a particular investment strategy will be successful .
Past performance does not guarantee future results. HLF6509/0120
5
HLF6509/0120
           6
There is no guarantee that a particular investment strategy will be successful. HLF6509/0120
7Holdings Data: Account Portfolio 9/30/2014 through 9/27/2019. Russell 2000® Value Index 10/1/2014 through 9/30/2019.
Holdings Data: Account Portfolio 930/2016 through 9/27/2019. Russell 2000® Value Index 10/3/2016 through 9/30/2019.
Source: FactSet Research Systems Inc. and Russell®. Performance attribution does not incorporate the effects of cash, unclassified securities or expenses. The total impact
may not equal the difference between the portfolio and benchmark returns. All indices are unmanaged. It is not possible to invest directly in an index.
Past performance does not guarantee future results. HLF6509/0120
8As of 9/30/2019
Source: FactSet Research Systems Inc., Russell® and Heartland Advisors, Inc.
Price-based statistics shown are calculated as weighted harmonic average unless otherwise noted.
1Weighted average. 2Excludes cash and cash equivalents. 3Based on 1-year returns and comparative statistics versus the Russell 2000® Value Index.
EV: Enterprise Value; EBITDA: Earnings Before Interest, Taxes, Depreciation and Amortization
Certain security valuations and forward estimates are based on Heartland Advisors' calculations. Certain outliers may be excluded.
Any forecasts may not prove to be true. Economic predictions are based on estimates and are subject to change.
Portfolio holdings are subject to change. Current and future holdings are subject to risk. HLF6509/0120
9
There is no guarantee that a particular investment strategy will be successful.
Diversification does not eliminate the risk of experiencing investment losses.
Past performance does not guarantee future results. HLF6509/0120
10I.
Source: Kenneth R. French © and CRSP, 12/31/1990 to 6/30/2019
Derived from the US Stock Database © 2019 Center for Research in Security Prices (CRSP), the University of Chicago Booth School of Business.
Large-Cap, Mid-Cap, Small-Cap and Micro-Cap are defined as all equity securities listed on NYSE, Amex, NASDAQ and NYSE Arca that existed during the time period
and were in the market capitalization deciles 1 through 2, 3 through 5, 6 through 8, and 9 through 10 respectively with 1 being the largest and 10 being the smallest.
Small-cap and Large-cap investing each have their own unique risks and potential for rewards and may not be suitable for all investors.
A small-cap investing strategy typically carries a higher liquidity risk than a large-cap investing strategy. The hypothetical example is for illustrative purposes only and does not
represent the returns of any particular investment. All indices are unmanaged. It is not possible to invest directly in an index.
Past performance does not guarantee future results. HLF6509/0120
11II
Source: FactSet Research Systems Inc., 6/30/1999 to 9/30/2019
Correlation table derived using Dow Jones U.S. Large-Cap Total Stock Market Index, Dow Jones U.S. Mid-Cap Total Stock Market Index, Dow Jones U.S.
Small-Cap Total Stock Market Index, and Dow Jones U.S. Micro-Cap Total Stock Market Index to represent their respective market capitalization ranges.
All indices mentioned are unmanaged. It is not possible to invest directly in an index
Past performance does not guarantee future results. HLF6509/0120
12III
*Prior to October 2009, index domestic equity ETF data included a small number of actively managed domestic equity ETFs.
Exchange Traded Fund (ETF)
Source: Investment Company Institute, 2019 Investment Company Fact Book, Washington, DC.
Data shows cumulative flows to and domestic equity mutual funds net share issuance of index domestic equity ETFs. Equity mutual fund
data includes net new cash flow and reinvested dividends. Data excludes mutual funds that invest primarily in other mutual funds. HLF6509/0120
13Source: © 2019 The Leuthold Group and Standard & Poor’s, December 1966 to September 2019
Study includes all actively managed domestic large cap equity mutual funds in the Morningstar database, including discontinued funds. Chart shows the
percent of funds and percent of fund assets outperforming the S&P 500 Index total return on a trailing 5-year basis after expenses, calculated quarterly.
The percent of assets is calculated as the total assets of outperforming funds divided by total assets of all funds. For funds with multiple share classes,
only one class is counted for performance measurement.
Economic predictions are based on estimates and are subject to change.
Past performance does not guarantee future results. HLF6509/0120
14IV
Source: FactSet Research Systems Inc., Russell®, and Heartland Advisors, Inc., 1/31/1979 to 9/30/2019, annualized return over rolling 10-year periods
Growth and value investing each have their own unique risks and potential for rewards, and may not be suitable for all investors. A growth investing strategy typically carries a
higher risk of loss and a higher potential for reward than a value investing strategy. A growth investing strategy emphasizes capital appreciation;
a value investing strategy emphasizes investments in companies believed to be undervalued. All indices are unmanaged. It is not possible to invest directly in an index.
Economic predictions are based on estimates and are subject to change.
Past performance does not guarantee future results. HLF6509/0120
15V
As of 9/30/2019
*Inception date: 12/28/1984.
Index source: FactSet Research Systems Inc. and Russell®, and Standard & Poor’s
The above chart represents a hypothetical example of an investment in the Value Fund representing historical returns.
In the prospectus dated 5/1/2019, the Gross Fund Operating Expense for the investor class shares of the Value Fund is 1.07%.
Past performance does not guarantee future results. Performance represents past performance; current returns may be lower or higher. The
investment return and principal value will fluctuate so that an investor's shares, when redeemed, may be worth more or less than the original cost.
All returns reflect reinvested dividends and capital gains distributions, but do not reflect the deduction of taxes that an investor would pay on
distributions or redemptions. Subject to certain exceptions, shares of a Fund redeemed or exchanged within 10 days of purchase are subject to a 2%
redemption fee. Performance does not reflect this fee, which if deducted would reduce an individual's return. To obtain performance through the
most recent month end, call 800-432-7856 or visit heartlandadvisors.com. HLF6509/0120
16As of 9/30/2019, Radian Group Inc. represented 2.99% of the Value Fund's net assets.
Source: FactSet Research Systems Inc. and Heartland Advisors, Inc.
Earnings Before Interest, Taxes, Depreciation and Amortization (EBITDA)
Certain security valuations and forward estimates are based on Heartland Advisors’ calculations. Statements regarding securities are not recommendations to buy or
sell the securities discussed, but rather illustrations of our value investment strategy. Such statements represent the portfolio manager’s view when made and are
subject to change at any time based on market and other considerations. Portfolio holdings are subject to change. Current and future holdings are subject to risk.
Past performance does not guarantee future results. HLF6509/0120
17As of 9/30/2019, Gorman-Rupp Company represented 0.83% of the Value Fund's net assets.
Source: FactSet Research Systems Inc. and Heartland Advisors, Inc.
There is no guarantee that a company will pay dividends.
Certain security valuations and forward estimates are based on Heartland Advisors’ calculations. Statements regarding securities are not recommendations to buy or
sell the securities discussed, but rather illustrations of our value investment strategy. Such statements represent the portfolio manager’s view when made and are
subject to change at any time based on market and other considerations. Portfolio holdings are subject to change. Current and future holdings are subject to risk.
Past performance does not guarantee future results. HLF6509/0120
18
HLF6509/0120
19HLF6509/0120
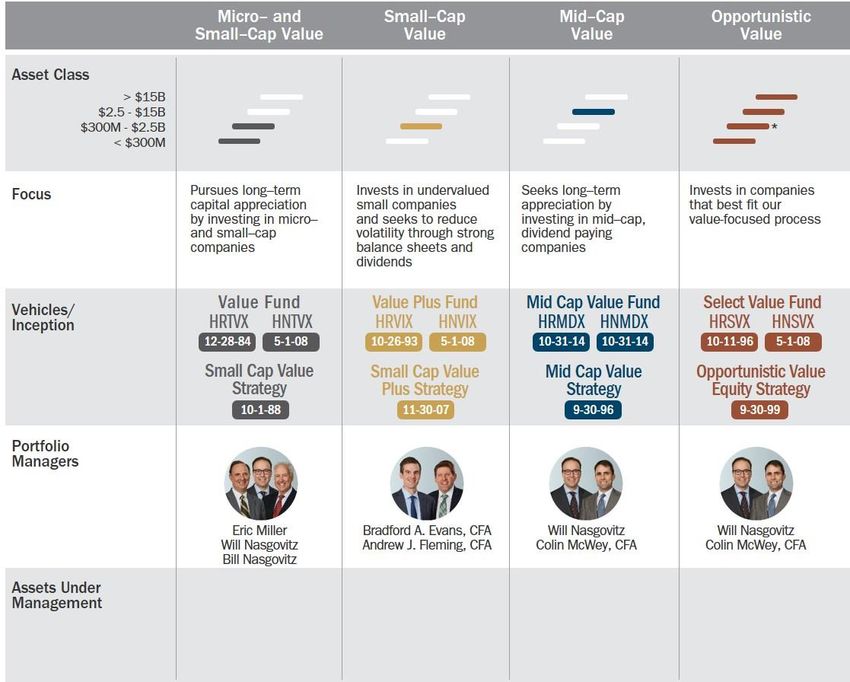
20The above individuals are registered representatives of ALPS Distributors, Inc. HLF6509/0120
21CFA® is a registered trademark owned by the CFA Institute.
The above individuals are registered representatives of ALPS Distributors, Inc., except those indicated with *. HLF6509/0120
221
Of the Fund’s assets
2
May hold cash equivalents during atypical markets
HLF6509/0120
23Index Source: FactSet Research Systems Inc. and Russell ®
Shown as a percent of equity investments. Index sector weightings do not include unassigned holdings.
Portfolio holdings are subject to change. Current and future holdings are subject to risk.
As of 9/28/2018, the Telecommunication Services Sector was broadened and renamed the Communication Services Sector under the Global Industry Classification Standard
(GICS) structure. Categorization of holdings under this renamed sector in the previous time period is shown for comparison purposes only. HLF6509/0120
24As of 9/30/2019
*Excludes cash equivalents
Portfolio holdings are subject to change. Current and future holdings are subject to risk.
For a complete list of the Fund’s portfolio securities visit heartlandadvisors.com. HLF6509/0120
25Source: Heartland Advisors, Inc., FactSet Research Systems, Inc. and Russell®, 9/30/1985 to 9/30/2019 for rolling returns, 12/28/1984 to 9/30/2019 for cumulative returns
Rolling returns computed monthly using 60- and 120-month moving windows.
In the prospectus dated 5/1/2019, the Gross Fund Operating Expense for the investor class shares of the Value Fund is 1.07%.
Past performance does not guarantee future results. Performance represents past performance; current returns may be lower or higher. The investment return and
principal value will fluctuate so that an investor's shares, when redeemed, may be worth more or less than the original cost. All returns reflect reinvested dividends
and capital gains distributions, but do not reflect the deduction of taxes that an investor would pay on distributions or redemptions. Subject to certain exceptions,
shares of a Fund redeemed or exchanged within 10 days of purchase are subject to a 2% redemption fee. Performance does not reflect this fee, which if deducted
would reduce an individual's return. To obtain performance through the most recent month end, call 888-505-5180 or visit heartlandadvisors.com.
HLF6509/0120
26As of 9/30/2019
*The Opportunistic Value products generally invest in securities with market capitalization greater than $500M.
There is no assurance that dividend paying stocks will mitigate volatility. There is no guarantee that a particular investment strategy will be successful.
The Heartland Funds are distributed by ALPS Distributors, Inc. Separately managed accounts and related advisory services are provided by Heartland Advisors,
Inc., a federally registered investment adviser. ALPS Distributors, Inc. is not affiliated with Heartland Advisors, Inc. HLF6509/0120
27Active Share is the percentage of a portfolio that differs from a benchmark index. NASDAQ is a global electronic marketplace for buying and selling securities, as
Allocation Effect of the Attribution Analysis is the portion of the portfolio excess well as the benchmark index for U.S. technology stocks. Nasdaq was created by
return attributed to taking different group positions from the benchmark. American the National Association of Securities Dealers (NASD) to enable investors to trade
Stock Exchange (AMEX) is the third-largest stock exchange by trading volume in securities on a computerized, speedy and transparent system, and commenced
the United States. Attribution Analysis provides an in-depth analysis of a operations on February 8, 1971. New York Stock Exchange (NYSE) is based in
portfolio’s return relative to a benchmark. Beta is a measure of the sensitivity of a New York City and considered the largest equities-based exchange in the world
portfolio's rates of return against those of the market. A beta less than 1 indicates based on total market capitalization of its listed securities. NYSE Arca is a
volatility less than that of the market. Book Value is the sum of all of a company’s securities exchange in the U.S. on which stocks and options are traded. Net
assets, minus its liabilities. Correlation is a statistical measure of how two Debt/Total Capital Ratio of a stock is calculated as a company's interest-bearing
securities move in relation to one another. A measure of 1 means the securities are liabilities minus cash or cash equivalents divided by its total capital, which is
highly correlated and move in conjunction. A measure of 0 means the securities represented by the company's debt and shareholders' equity, and includes
are not at all correlated and do not move in conjunction. Dividend Yield is a ratio common stock, preferred stock, minority interest and net debt. Passive
that shows how much a company pays out in dividends each year relative to its Management a style of management associated with mutual and exchange-traded
share price. Earnings Before Interest, Taxes, Depreciation and Amortization funds (ETF) where a fund's portfolio mirrors a market index. Price/Book Ratio of a
(EBITDA) measures a company’s financial performance. It is used to analyze and company is calculated by dividing the market price of its stock by the company's
compare profitability between companies and industries because it eliminates the per-share book value. Price/Cash Flow represents the amount an investor is
effects of financing and accounting decisions. Earnings Per Share is the portion of willing to pay for a dollar generated from a particular company's operations. It
a company’s profit allocated to each outstanding share of common stock. shows the ability of a business to generate cash and acts as a gauge of liquidity
Enterprise Value (EV) is the entire economic value of a company. Exchange and solvency. Price/Earnings Ratio (P/E) of a stock is calculated by dividing the
Traded Fund (ETF) is a security that tracks an index, a commodity or a basket of current price of the stock by its trailing or its forward 12 months’ earnings per share.
assets like an index fund, but trades like a stock on an exchange. ETFs experience Selection Effect of the Attribution Analysis is the portion of the portfolio excess
price changes throughout the day as they are bought and sold. Leverage is the return attributable to choosing different securities within groups from the
amount of debt used to finance a firm's assets. A firm with significantly more debt benchmark. Standard Deviation is a measure of volatility of returns and is
than equity is considered to be highly leveraged. Interaction Effect of the computed as the square root of the average squared deviation of the returns from
Attribution Analysis is the portion of the portfolio's excess return attributable to the mean value of the return. Tangible Book Value is the sum of all of a
combining allocation decisions with relative performance. company’s assets, minus its liabilities and intangible assets, such as goodwill.
Total Effect of the Attribution Analysis is the sum of all effects. The total effect
represents the opportunity cost of your investment decisions in a group relative to
the overall benchmark.
HLF6509/0120
28You can also read