First Quarter 2021 Earnings Conference Call - May 6, 2021 NYSE: TEN - Tenneco

Page created by Harvey Mcdaniel
 
CONTINUE READING
First Quarter 2021 Earnings Conference Call - May 6, 2021 NYSE: TEN - Tenneco
First Quarter 2021
Earnings Conference Call
May 6, 2021
NYSE: TEN
First Quarter 2021 Earnings Conference Call - May 6, 2021 NYSE: TEN - Tenneco
Safe Harbor
       Forward-Looking Statements
       This communication contains forward-looking statements. These forward-looking statements include, but are not limited to, (i) all statements, other than
       statements of historical fact, included in this communication that address activities, events or developments that we expect or anticipate will or may occur in the
       future or that depend on future events and (ii) statements about our future business plans and strategy and other statements that describe Tenneco’s outlook,
       objectives, plans, intentions or goals, and any discussion of future operating or financial performance. These forward-looking statements are included in various
       sections of this communication and the words “may,” “will,” “believe,” “should,” “could,” “plan,” “expect,” “anticipate,” “estimate,” and similar expressions (and
       variations thereof) are intended to identify forward-looking statements. Forward-looking statements included in this communication concern, among other things,
       future performance improvement plans; future financial and operating results; and other statements that are not historical facts. Forward-looking statements are
       subject to a number of risks and uncertainties that could cause actual results to materially differ from those described in the forward-looking statements, including
       the course of the COVID-19 pandemic and its impact on general economic, business and market conditions: our ability (or inability) to execute on our plans to
       respond to the COVID-19 pandemic and our previously announced Accelerate plan and to realize the anticipated benefits of these actions; our financial flexibility
       in addressing the impact of the COVID-19 pandemic; our ability to maintain compliance with the agreements governing our indebtedness and otherwise have
       sufficient liquidity through the COVID-19 pandemic; the possibility that Tenneco may not complete a separation of the Aftermarket & Ride Performance business
       from the Powertrain Technology business; the possibility that Tenneco will be unable to execute on its strategy and maintain compliance with the covenants in its
       Credit Agreement; supply chain disruptions, including constraints on steel and semiconductors and resulting increases in costs, impacting the Company, its
       customers or the automotive industry; the ability to retain and hire key personnel and maintain relationships with customers, suppliers or other business partners;
       as well as the risk factors and cautionary statements included in Tenneco's periodic and current reports (Forms 10-K, 10-Q and 8-K) filed from time to time with
       the SEC. Given these risks and uncertainties, investors should not place undue reliance on forward-looking statements as a prediction of actual results. Unless
       otherwise indicated, the forward-looking statements in this release are made as of the date of this communication, and, except as required by law, Tenneco does
       not undertake any obligation, and disclaims any obligation, to publicly disclose revisions or updates to any forward-looking statements. Additional information
       regarding these risk factors and uncertainties is detailed from time to time in the company's SEC filings, including but not limited to its annual report on Form 10-
       K for the year ended December 31, 2020.

       In addition, please see Tenneco’s press release issued on May 6, 2021 for factors that could cause Tenneco’s future performance to vary from the expectations
       expressed or implied by the forward-looking statements herein and for certain reconciliations of GAAP to non-GAAP results.

TENNECO INC. Q1 2021 EARNINGS
                                                                                                                                                                               2
First Quarter 2021 Earnings Conference Call - May 6, 2021 NYSE: TEN - Tenneco
Agenda

                                                                                                         Brian Kesseler, CEO
                                  Q1 2021 Highlights & Overview
                                                                                                         Kevin Baird, COO
                                  Enterprise & Segment Performance
                                                                                                         Matti Masanovich, CFO
                                  Balance Sheet & Outlook
                                                                                                         Kesseler
                                  Driving Shareholder Value Creation
                                                                                                         All
                                  Q&A

                                Non-GAAP Results:   Please see the tables that reconcile GAAP results with non-GAAP results at the end of this presentation and in
                                                    Tenneco’s financial results press release, which is incorporated herein by reference.
                                EBITDA:             EBITDA for purposes of this presentation means EBITDA including noncontrolling interests.

TENNECO INC. Q1 2021 EARNINGS
                                                                                                                                                                     3
First Quarter 2021 Earnings Conference Call - May 6, 2021 NYSE: TEN - Tenneco
First Quarter Highlights

                                                                        • Strong profit conversion on higher volume despite supply chain volatility and
                                                                          material cost headwinds
                         Strong Business Execution                      • Accelerate+ program delivering results
                                                                                 - Structural profitability improvement
                                                                                 - Expected incremental savings of $110M in 2021; $35M carryover into 2022

                                                                        • Solid quarter-end liquidity position at $2.1B; no balance drawn on $1.5B revolver
                                                                        • Extended $800M of debt maturities to 2029 at similar cost
                         Strengthening Balance Sheet
                                                                        • Refinancing clears path to address refinancing of credit facility and Term Loan A
                                                                          and Term Loan B in the future

                                                                        • Potential to unlock significant near-term value through debt reduction focus
                                                                        • Realigning product lines and investments to bolster core growth platforms
                         Driving Shareholder Value
                                                                                 - Motorparts, Performance Solutions* and CTOHI
                                                                                 - Shifting revenue mix to position enterprise for long-term sustainable growth

                                               Continuing positive performance momentum
TENNECO INC. Q1 2021 EARNINGS                 * Beginning in first quarter 2021, Ride Performance segment was renamed Performance Solutions - please see appendix for more details.   4
First Quarter 2021 Earnings Conference Call - May 6, 2021 NYSE: TEN - Tenneco
Tenneco – Q1 Overview
        Strong margin expansion and net leverage reduction

                  REVENUE

             $4.7B              • Up 23% YoY                                                                                      China
                                • Substrates $1,088M                                                                                      13%

                                                                                                      28%     AM & OES                                                        North
                                                                OE LV                                                    ROW                                            40%   America
                                • Up 13%(1) YoY, excluding    Emissions/    40%                                                   9%
              VA REVENUE          currency impact of $104M
                                                               Engine                Q1 2021

              $3.6B
                                                                                    VA Revenue                                                Q1 2021
                                • LV+14%(1); CTOHI +38%(1);                          By Product                                              VA Revenue
                                  AM&OES +1%(1)                                      Application                                                By Region

         Adjusted EBITDA        • Up $149M YoY
                                                                                                      17%
                                                                                                                                    38%

         $388M
                                                                                                            CTOHI        Europe
                                • 10.7% VA adjusted EBITDA                                                  & Other
                                                                                       15%
                                  margin, up 310 bps YoY
                                                                                      OE LV
                                                                             Suspension/NVH/Chassis
          NET LEVERAGE          • Seasonally better Q1
       improvement since YE       cash flow and higher

                 0.4X             EBITDA drove reduction                   60% non OE light vehicle ICE
                                  in net leverage to 3.9x

                                   Advantaged scale and diversification in product lines, end markets and regions

TENNECO INC. Q1 2021 EARNINGS                                                                                            Presentation footnotes available on page 22.                   5
First Quarter 2021 Earnings Conference Call - May 6, 2021 NYSE: TEN - Tenneco
Enterprise & Segment Performance

                                   6
First Quarter 2021 Earnings Conference Call - May 6, 2021 NYSE: TEN - Tenneco
Q1 Enterprise Performance
                                                                                                            VA REVENUE (1)
                                                    Motorparts                                      Q1 21 Substrate revenue $1,088M
                                                    $719M
                     Powertrain                                                                                                                          $3,643
                                                                            $ millions
                     $1,101M                                                             $3,136

                                     Q1 2021
                                    VA Revenue
                                      By Segment            Performance
                                                            Solutions
                                                            $787M

                        Clean Air                                                        Q1 20    Volume         Other               Currency             Q1 21
                        $1,036M                                                                    & Mix

                                                                                                           ADJUSTED EBITDA
           VA revenue $3.6B,        +13%(1)   YoY                                                 Q1 21 includes corporate costs of $47M
            • Strong commercial truck, off-highway and industrial markets                                                                                     $388
            • COVID-19 recovery in China
                                                                                         $239
           Adjusted EBITDA $388M, up 62% YoY
            • VA adj. EBITDA margin 10.7%, up 310bps vs. a year ago
            • Continued solid operating leverage on higher volumes
                                                                                         7.6%                                                             10.7%
            • Accelerate+ savings lifting operating performance
                                                                                         Q1 20    Volume       Operating            Currency                  Q1 21
                                                                                                   & Mix      Performance

TENNECO INC. Q1 2021 EARNINGS                                                                                  Presentation footnotes available on page 22.           7
First Quarter 2021 Earnings Conference Call - May 6, 2021 NYSE: TEN - Tenneco
Motorparts – Q1 Segment Performance
                                                                                                       REVENUE (1)
                                    APAC                               $ millions

                                        7%

                         EMEA 24%
                                        Q1 2021
                                        Revenue
                                         By Region
                                                      69%   Americas

                                                                                    Q1 20   Volume         Other                Currency               Q1 21
                                                                                             & Mix

                                                                                                     ADJUSTED EBITDA

                   Revenue $719M, +1%(1) YoY
                    • Adverse weather and supply chain constraints
                        mitigated growth; Q2 order book is strong

                   Adjusted EBITDA $105M, +44% YoY
                     • Adj. EBITDA margin 14.6%, up 430 bps YoY
                                                                                    10.3%                                                              14.6%
                     • Operating performance benefiting from
                       restructuring cost savings                                   Q1 20   Volume      Operating              Currency                Q1 21
                                                                                             & Mix     Performance

TENNECO INC. Q1 2021 EARNINGS                                                                           Presentation footnotes available on page 22.           8
First Quarter 2021 Earnings Conference Call - May 6, 2021 NYSE: TEN - Tenneco
Performance Solutions – Q1 Segment Performance
                                                                                                                                                       REVENUE (1) *

                          OES &
                          Aftermarket                                                                   $ millions
                                        14%

                      CTOHI &
                      Other   18%
                                              Q1 2021
                                              Revenue
                                        By Product Application

                                                                                                                     Q1 20*              Volume           Other               Currency             Q1 21
                                                             68%                                                                          & Mix
                                                                           OE LV
                                                                  Suspension/NVH/Chassis
                                                                                                                                                     ADJUSTED EBITDA*

                                                                                                                                                                                                       $47

               Revenue $787M, +14%(1) YoY*                                                                             $38
               Light Vehicle    +11%(1);   CTOHI    +45%(1);     AM/OES    +5%(1)

               Adjusted EBITDA $47M, +24% YoY*
                 • Adj. EBITDA margin 6.0%, up 30 bps YoY
                 • Operating leverage on higher volumes                                                                5.7%                                                                            6.0%

                                                                                                                     Q1 20*              Volume         Operating             Currency                 Q1 21
                                                                                                                                          & Mix        Performance

TENNECO INC. Q1 2021 EARNINGS                                       *Q1 2020 pro forma for segment realignment. Reconciliation is in the appendix.      Presentation footnotes available on page 22.           9
First Quarter 2021 Earnings Conference Call - May 6, 2021 NYSE: TEN - Tenneco
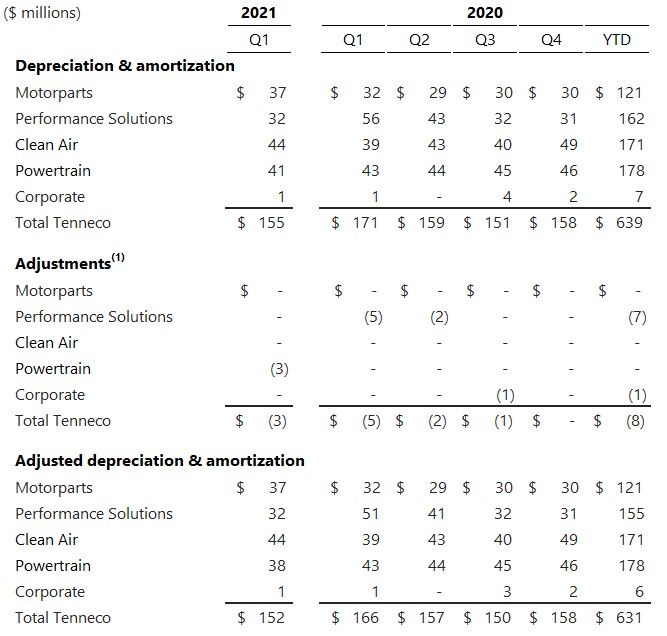
Clean Air – Q1 Segment Performance
                                                                                                                    VA REVENUE (1)
                                                                                                             Q1 21 Substrate revenue $1,088M
                                                OES
                                CTOHI &          3%
                                 Other                                               $ millions

                                      22%

                                                                          OE LV
                                             Q1 2021               75%
                                                                         Emissions
                                            VA Revenue
                                          By Product Application

                                                                                                  Q1 20    Volume         Other              Currency                Q1 21
                                                                                                            & Mix

                                                                                                                    ADJUSTED EBITDA

                    VA revenue $1.0B, +19%(1) YoY
                    Light Vehicle +13%(1); CTOHI +44%(1); OES +26%(1)
                                                                                                  $104
                    Adjusted EBITDA $157M, +51% YoY
                     • VA adj. EBITDA margin 15.2%, up 290 bps
                     • Solid profit conversion on higher volume
                                                                                                  12.3%                                                          15.2%
                     • China volume and CTOH growth benefitted
                       profit mix                                                                 Q1 20   Volume        Operating            Currency            Q1 21
                                                                                                           & Mix       Performance

TENNECO INC. Q1 2021 EARNINGS                                                                                         Presentation footnotes available on page 22.           10
Powertrain – Q1 Segment Performance
                                                                                                                                                      REVENUE (1) *

                                  OES                                                                  $ millions
                                        15%

                                                                 62%   OE LV
                                              Q1 2021                  Engine
                     CTOHI
                                              Revenue
                                23%     By Product Application
                     & Other
                                                                                                                     Q1 20*             Volume           Other               Currency             Q1 21
                                                                                                                                         & Mix

                                                                                                                                                    ADJUSTED EBITDA*
                                                                                                                                                                                                   $126

                  Revenue $1.1B, +16%(1) YoY*
                  Light Vehicle +16%(1); CTOHI +31%(1); OES -3%(1)                                                     $68

                  Adjusted EBITDA $126M, +85% YoY*
                    • Adj. EBITDA margin 11.4%, up 400 bps YoY
                    • Strong leverage on higher volume; favorable mix                                                 7.4%                                                                         11.4%
                    • Restructuring savings and higher JV income                                                     Q1 20*             Volume          Operating            Currency             Q1 21
                                                                                                                                         & Mix         Performance

TENNECO INC. Q1 2021 EARNINGS                                      *Q1 2020 pro forma for segment realignment. Reconciliation is in the appendix.       Presentation footnotes available on page 22.       11
2020 Outlook and Closing Comments

Balance Sheet & Outlook

                                         12
Strengthening Balance Sheet

                                Improved net leverage position                                                    Extended debt maturity profile

                  • Significant available liquidity of $2.1B*                                        • New $800M senior secured notes due
                    at quarter end                                                                     April 2029, issued on March 17, 2021
                       ‒ Available revolving credit facility capacity of                                   ‒ Proceeds used to redeem 2024 senior
                         $1.5B; revolver undrawn at quarter end                                              secured notes
                                                                                                           ‒ Offering was leverage neutral and
                  • Net leverage improved 0.4x since year-                                                   extended our maturity profile
                    end to 3.9x                                                                            ‒ Pricing similar to notes replaced
                       ‒ Q1 cash usage well below historical
                         seasonal pattern
                                                                                                                 See current debt maturity schedule and
                       ‒ Structural Q1 margin expansion                                                                leverage ratios in appendix

                                    Significant net leverage reduction and extended debt maturity profile

TENNECO INC. Q1 2021 EARNINGS                            * Liquidity as of 3/31/2021 consists of available revolving credit facility capacity of $1.5B (and cash balances of $0.6B)   13
2021 Full Year Outlook Raised and Q2 Outlook Initiated*
                                   Raised                                                 New

                                 FY 2021                                             Q2 2021
                                                           FY 2020                                                Q2 2020
                                OUTLOOK*                                            OUTLOOK*                                                       2021 Key Assumptions (at midpoint)
      Revenue                   $17.6 – 18.1B                                                                                                          • Global light vehicle build assumption of
                                                             $15.4B                $4.35 – 4.55B                     $2.6B
      (previous)                ($17.2 – 17.8B)                                                                                                          80M in 2021 (no change)
                                                                                                                                                           − More conservative than IHS Markit,
                                                                                                                                                             mostly in Europe and North America
      VA revenue                $13.5 – 14.0B
                                                             $12.0B                  $3.3 – 3.5B                     $2.0B
      (previous)                ($13.2 - 13.8B)                                                                                                        • Incremental margin (YoY) strongest in Q1
                                                                                                                                                            ‒ 2020 non-recurring temporary cost
                                                                                                                                                              actions - Q2 $100M; Q3 $50M
      Adjusted EBITDA           $1.35 - 1.45B
                                                            $1,045M                $325 – 355M                       $8M                               • Expect normal seasonality of cash flow
      (previous)                 ($1.3 - 1.4B)
                                                                                                                                                         with H2 inflow
                                                                                                                                                       • Cash taxes $140 – 160M (no change)
      Net   debt(1)
Driving Shareholder Value Creation Near and Long-Term
    Continuing performance momentum and accelerating value creation

             Disciplined Performance Focus                          Capital Structure Optimization                        Long-term Sustainable Growth

       • Execute Accelerate+ Program                      • Maintain strong liquidity position                        • Bolster core platforms to enable higher than
                                                          • Focus on free cash flow for debt service to                 market level growth
            − Structural Cost Reduction
                                                            unlock significant near-term value creation                  − Motorparts
            − $265M of run rate savings expected by end
              of 2021 (vs. 2019 baseline)                   potential                                                    − Performance Solutions
       • Lower Capital Intensity                          • Improving debt maturity profile                              − CTOHI
            − Mid-term annual capex targets of
Appendix

           16
Appendix:
       Q1 2021 Financial Results
                                                                                                                                                                                                                       ($ millions)

             (millions, except percents and per share data)
                                                                                            Q1 2021                  Free Cash Flow for debt service(2)                                                         Q1 2021

             Revenue                                                                          $4,731                 Cash from Operations                                                                          $(50)
                                                                                                                     Proceeds from deferred purchase price of
             VA revenue                                                                        3,643                                                                                                                 115
                                                                                                                     factored receivables(1)
             Adjusted EBITDA                                                                     388                 Capital expenditures                                                                            (95)
             VA adjusted EBITDA margin                                                         10.7%                 Payments to non-controlling interest partners                                                    (7)
             Interest expense                                                                     70                 Other investing / financing                                                                     (37)

             Adjusted tax expense                                                                 54                 Free Cash Flow for debt reduction                                                             $(74)

             Noncontrolling interest expense                                                      22               (2) Free Cash Flow for debt service represents cash flow from operations, plus the proceeds from deferred purchase
                                                                                                                        price of factored receivables less the amount of cash payments for property, plant and equipment and
                                                                                                                        payments to noncontrolling interest partners, as well as various other amounts. Free Cash Flow for debt service
             Adjusted net income                                                                  90                    is not a GAAP calculation and should not be considered as an alternative to operating cash flows as a measure
                                                                                                                        of liquidity. Tenneco has presented Free Cash Flow for debt service because it regularly reviews Free Cash Flow
                                                                                                                        for debt service as a measure of the company's performance and ability to reduce net debt. In addition,
             Diluted shares outstanding                                                         82.5                    Tenneco believes its investors utilize and analyze the company's Free Cash Flow for debt service for similar
                                                                                                                        purposes. However, the Free Cash Flow for debt service measure presented may not always be comparable to
                                                                                                                        similarly titled measures reported by other companies due to differences in the components of the calculation.

             Adjusted EPS                                                                      $1.09
           (1) See Proceeds from deferred purchase price of factored receivables in the investing section of the
               cash flow statement. GAAP requires reclassification of amount from Change in receivables in the
               Cash from operations section.

TENNECO INC. Q1 2021 EARNINGS
                                                                                                                                                                                                                                          17
Appendix:
       Debt Maturity Schedule and Leverage Ratio
                                                                                                                                                     ($ millions)

  $ millions
   $1,800
               Debt maturities, excluding subsidiary debt, as of March 31, 2021:                Book Net Leverage Ratio                          3/31/2021

                                                $1,598                                          Total Debt                                         $5,235
   $1,600

                                                                                                Total Cash Balances                                 $631
   $1,400
                                $1,250                                                 $1,300
                                                                                                Net Debt                                           $4,604
   $1,200
                                                                                                LTM Adjusted EBITDA                                $1,194
   $1,000
                                                                                                Net Leverage Ratio                                   3.9x
    $800

    $600
                                                                                                Bank Financial                                   3/31/2021
                                                              $500
                                                                                                Maintenance Covenants
    $400                                                                                        Senior secured net leverage ratio
                                                                                                                                                    2.62x
                       $187              $242                                                   (below max. 8.25x)
    $200       $145
                                                                                                Interest coverage ratio
                                                                                                                                                    6.10x
                                                                                                (above min. 1.50x)
       $0
                                                                                                (Bank covenant ratio required as of 3/31/2021)
               2021    2022      2023    2024       2025      2026    2027     2028    2029
                TLA due Oct. 2023                          $500M 7.875% Notes due Jan. 2029
                Revolver Borrowings due Oct. 2023          $800M 5.125% Notes due Apr. 2029
                $225M 5.375% Notes due Dec. 2024                                                Significant cushion on debt covenants
                TLB due Oct. 2025
                $500M 5% Notes due Jul. 2026

TENNECO INC. Q1 2021 EARNINGS
                                                                                                                                                                    18
Appendix:
       Depreciation and Amortization by Segment

                                    (1) Adjusted depreciation and amortization represents depreciation and amortization
                                    adjusted to eliminate the financial impact of decisions made for the long term benefit of the
                                    company and other items impacting comparability between the periods. Similar adjustments
                                    to depreciation and amortization have been recorded in earlier periods, and similar types of
                                    adjustments can reasonably be expected to be recorded in future periods. The company
                                    believes investors find the non-GAAP information helpful in understanding the ongoing
                                    depreciation and amortization of the business separate from items that may have a
                                    disproportionate positive or negative impact on the company's financial results in any
                                    particular period.

TENNECO INC. Q1 2021 EARNINGS
                                                                                                                                    19
Appendix:
       Explanation of Segment Changes in Q1
       Beginning with the first quarter of 2021, the Company changed the name of its Ride Performance segment to
       Performance Solutions. Relative to its predecessor name, management believes the new name better describes
       the broad offering of the segment’s products and solutions available to customers. The segment supplies
       mission critical products and applications to the automotive, commercial vehicle, aerospace, industrial, rail, two-
       wheel, and motorsports industries.

       Beginning with the first quarter of 2021, the Company transferred a business line previously managed within the
       Powertrain segment to the Performance Solutions segment. Management determined that the business line’s
       products, applications, diversification and solutions competency aligned better with the long-term strategic
       goals and positioning of the Performance Solutions segment. As such, prior period operating segment results
       and related disclosures have been conformed to reflect the Company's current operating segments. There is no
       impact to the consolidated financial statements of the Company as a result of this change. The company has
       provided a reconciliation of 2020 segment financials on page 21.

TENNECO INC. Q1 2021 EARNINGS
                                                                                                                             20
Appendix:
       Segment Recast Impact on 2020
        ($ millions)

                                            2020 Segment Performance                                                          2020 Segment Performance
                                              As Previously Reported                    Segment Change                                As Recast
                                                            Adjusted                  Total       Adjusted               Total         Adjusted    Adjusted
                                             Total           EBITDA                  Revenue       EBITDA               Revenue         EBITDA      EBITDA
                                          Revenue (a)          (b)                     (a)           (b)                  (a)             (b)      Margin (b)

             Powertrain:
                       Q1                  $       997       $     90                $     (81)      $     (22)         $     916        $     68            7.4%
                       Q2                  $       602       $    (21)               $     (42)      $      (7)         $     560        $    (28)          -5.0%
                       Q3                  $     1,007       $    124                $     (79)      $     (23)         $     928        $    101           10.9%
                       Q4                  $     1,120       $    152                $     (93)      $     (28)         $   1,027        $    124           12.1%
                    YTD 2020               $     3,726       $    345                $    (295)      $     (80)         $   3,431        $    265            7.7%

             Performance Solutions:
                       Q1                  $       588       $     16                $      81       $      22          $     669        $     38            5.7%
                       Q2                  $       336       $    (41)               $      42       $       7          $     378        $    (34)          -9.0%
                       Q3                  $       600       $     32                $      79       $      23          $     679        $     55            8.1%
                       Q4                  $       683       $     29                $      93       $      28          $     776        $     57            7.3%
                    YTD 2020               $     2,207       $     36                $     295       $      80          $   2,502        $    116            4.6%

             (a) Total revenue is equal to value add revenue for these segments.

             (b) See Tenneco’s earnings release dated May 6, 2021, for a description of why we present Adjusted EBITDA and Adjusted EBITDA margin. Refer to the Attachments to the earnings Press
             Release dated May 6, 2021, for U.S. GAAP reconciliations.

TENNECO INC. Q1 2021 EARNINGS
                                                                                                                                                                                                    21
Appendix:
       Tenneco Projections and Presentation Footnotes
         Tenneco’s revenue outlook is as of May 6, 2021. Revenue assumptions are based on projected customer production schedules, IHS Markit light vehicle
         production April 2021 forecasts, IHS Markit commercial truck February 2021 forecasts, Power Systems Research April 2021 forecasts and Tenneco
         estimates. Furthermore:
              • Projections are based on original equipment manufacturers’ programs that have been formally awarded to the company; programs where the
                company is highly confident that it will be awarded business based on informal customer indications consistent with past practices; and Tenneco's
                status as supplier for the existing programs and its relationship with customers.
              • Projections are based on the anticipated pricing of each program over its life.
              • Except as otherwise indicated, projections assume a fixed foreign currency value. This value is used to translate foreign business to the U.S. dollar.
              • Projections are subject to increase or decrease due to changes in customer requirements, customer and consumer preferences, the number of
                vehicles actually produced by our customers, and pricing.

         In addition to the information set forth herein, Tenneco’s projections are based on the type of information set forth under “Order Fulfillment” in Item 1 –
         “Business” as set forth in Tenneco’s Annual Report on Form 10-K for the year ended December 31, 2020. Please see that disclosure for further
         information.

         Certain elements of the restructuring and related expenses, legal settlements, substrate pricing, and other unusual charges we incur from time to time
         cannot be forecasted accurately. In this respect, we are not able to forecast corresponding GAAP measures without unreasonable efforts on account of
         these factors and other factors not in our control.

         Presentation Footnotes
         1)    Revenue comparisons measured at constant currency rates.
         2)    IHS Markit April 2021 global light vehicle production forecast.
         3)    Free Cash Flow for debt service represents cash flow from operations, plus the proceeds from deferred purchase price of factored receivables less the amount of cash payments for
               property, plant and equipment and payments to noncontrolling interest partners, as well as various other amounts. Free Cash Flow for debt service is not a GAAP calculation and should
               not be considered as an alternative to operating cash flows as a measure of liquidity. Tenneco has presented Free Cash Flow for debt service because it regularly reviews Free Cash Flow
               for debt service as a measure of the company's performance and ability to reduce net debt. In addition, Tenneco believes its investors utilize and analyze the company's Free Cash Flow
               for debt service for similar purposes. However, the Free Cash Flow for debt service measure presented may not always be comparable to similarly titled measures reported by other
               companies due to differences in the components of the calculation.

TENNECO INC. Q1 2021 EARNINGS
                                                                                                                                                                                                          22
You can also read