A&W Revenue Royalties Income Fund - Overview and Update TSE: AW.UN May 2021 - A&W Revenue Royalties ...
←
→
Page content transcription
If your browser does not render page correctly, please read the page content below

A&W Revenue Royalties Income Fund
        Overview and Update
                   May 2021
                  TSE: AW.UN

        CHOSEN AND TRUSTED FOR TRULY GOOD FOOD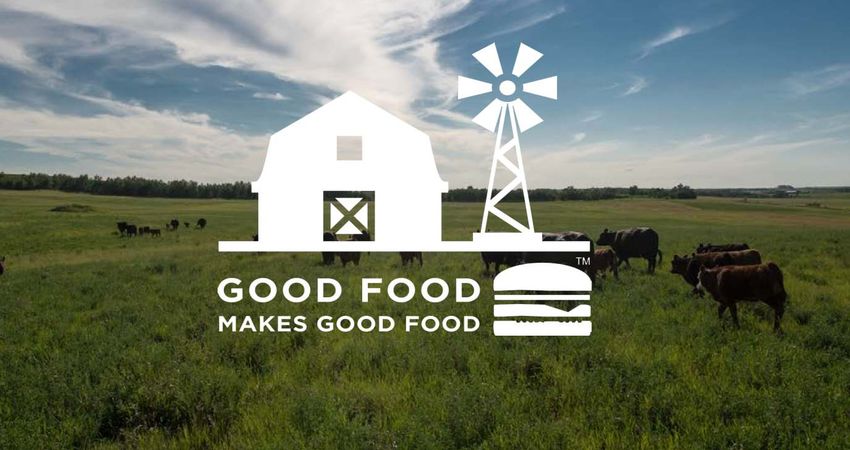
Document Overview

•   Business overview
•   Strategy
•   Climate
•   COVID-19
•   Financial highlights

                           2
A&W is Canada’s 4th Largest QSR & 2nd
                    Largest Burger QSR(1)
  $1.4 Billion in Total System
 Sales for all A&W Restaurants                                                              1,009 A&W restaurants delighting
            in 2020(2)                                                                      guests coast to coast and a strong
                                                                                            pipeline of new restaurants to fuel
                                                                                                      future growth(3)

                        1
                                             1

                                                                                                           16

                                       200
                            194
                            194                               44
                                                                                            171
                                                                                                                2
                                                  47
                                                                            289
                                                                                                                    25
                                                                                                         19

(1) Based on % of market share for 3 months ended Dec ’20. Source: NPD Group Inc.
(2) System Sales is a non-IFRS measure and is reported in respect of all A&W restaurants.
    See “Non-IFRS Measures”
(3) 1,009 A&W restaurants as at March 28, 2021
                                                                                                                                  3
65 Years of Constant Evolution

                                 4
Signature Products

                     5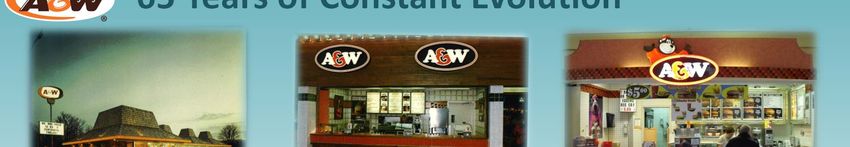
Menu Innovation

                  6
Canada’s #1 Root Beer

                        7
A&W Brew BarTM Nationwide Phased
                           Rollout Launched in 2021
        Now available at
           select A&W
         restaurants in
        Victoria, Calgary,
            Edmonton,
             Ottawa &
            Montreal!
        National rollout
           in progress.

TM   trademark of A&W Trade Marks Limited Partnership, used under licence
                                                                            8
565+ Freestanding Restaurants

             Cornwall, ON
                                9
155+ Convenience Locations

              Exeter, ON
                             10
85+ Urban Locations
11Market Leader for Burger Restaurants in Malls
12A&W Core Strengths
• Leadership Experience
– (24 years average experience)
• Strategy
– (A unique strength – 40+ years)
• Climate
13Annual Same Store Sales Growth(1) Trend
9.8%
10.0% 7.6%
COVID-19 began negatively
impacting A&W restaurant
4.1% sales on March 13, 2020
5.0% 3.4%
2.0%
0.0%
-5.0%
-5.6%
-10.0%
-15.0% -14.3%
2015 2016 2017 2018 2019 2020 Q1 2021
(1) Same Store Sales Growth is a non-IFRS measure. See “Non-IFRS Measures”.
14Quarterly Same Store Sales Growth(1) Trend
15.0% 10.3% Same Store Sales Growth (1) has trended upwards
each quarter since Q2 2020 when the
10.0% impact of the COVID-19 pandemic was at its peak
5.0% 1.2%
0.0%
-5.0% -1.9% -4.0% -5.6%
-10.0% -9.3%
-15.0% -12.7%
-20.0%
-25.0%
-30.0%
-31.6%
-35.0%
Q2 2019 Q3 2019 Q4 2019 Q1 2020 Q2 2020 Q3 2020 Q4 2020 Q1 2021
(1) Same Store Sales Growth is a non-IFRS measure. See “Non-IFRS Measures”.
15A&W’s Mission
16Strategic Thrusts
1 Be the convenience they crave
2 Build our financial health and success
3 Innovate our menu to win millennial visits
4 Be trusted as #1 for truly good food
5 Continue to successfully open new restaurants
171 Be the convenience they crave
• Create and deliver the excellent experience that
guests want today, through mobile, delivery and
drive-thru
182 Build our financial health and success
• Restore the financial health of restaurants most impacted
by the affects of COVID-19
• Grow restaurant profitability in Drive-thru restaurants
193 Innovate our menu to win millennial visits
204 Be trusted as #1 for truly good food
215 Continue to successfully open new restaurants
223
Top-Line Income Fund Structure

• Royalties are based on Gross Sales reported by restaurants in
  the Royalty Pool

      Gross Sales                                  Distributions
                                       Less Fund
       of Royalty            Royalty                     to
                    3%                 expenses
          Pool               Income    and taxes
                                                   Unitholders
      Restaurants

                                                                   24
Impact of COVID-19
• COVID-19 has adversely affected A&W restaurant operations and resulted in the temporary closure
of a large number of restaurants.
• At its peak impact, in Q2 2020, a total of 230 A&W restaurants (out of 971 restaurants in the Royalty
Pool) were temporarily closed due to public health measures in response to COVID-19.
• With COVID-19 case numbers across Canada on the rise throughout Q1 2021, including a surge in
the more easily transmittable variant strains of COVID-19, some of the A&W restaurants in operation
were once again restricted to drive-thru operations, take-out, delivery and mobile ordering only.
• As at March 28, 2021, 15 A&W restaurants in the Royalty Pool remained temporarily closed due to
restrictions. As at May 4, 2021, the number of temporarily closed A&W restaurants was 45.
• The temporarily closed A&W restaurants are expected to reopen when permitted to do so however
it is possible that there could be further temporary closures or that the number of restaurants closed
increases again as the situation evolves .
252020 and Q1 2021 Highlights
• Same Store Sales Growth(1)
– Q1 2021 -5.6%
– 2020 -14.3%
• Same Store Sales Growth(1) has trended upwards each quarter since Q2
2020 when the impact of the COVID-19 pandemic was at its peak
• Royalty income up +0.7% in Q1 2021 and down -9.1% in 2020
• Distributable Cash per Unit(2) down -16.5% in Q1 2021 and down
-13.2% in 2020
• 34 New restaurants (less 11 closures) added to the Royalty Pool on January
5, 2021 (37 net in 2020)
(1) Same Store Sales Growth is a non-IFRS measure. See “Non-IFRS Measures”.
(2) Distributable Cash per Unit is a non-IFRS measure. See “Non-IFRS Measures”.
26Fund Revenue, Expenses and Distributable Cash
$k 2019 2020 Q1 2020 Q1 2021
SSSG(1) 4.1% -14.3% -4.0% -5.6%
Gross Sales(2) 1,482,323 1,347,387 308,679 310,726
Royalty Income 44,470 40,422 9,260 9,322
Admin. Expense 791 994 193 206
Interest 2,267 2,177 509 606
Current tax 8,269 7,242 1,030 2,032
Distributable Cash(3) 33,143 30,009 7,528 6,478
(1) SSSG or Same Store Sales Growth is a non-IFRS measure. See “Non-IFRS Measures”.
(2) Gross Sales in this table is presented solely in respect of the A&W restaurants included in the Royalty Pool.
(3) Distributable Cash is a non-IFRS measure. See “Non-IFRS Measures”.
27Fund Taxes, Distributions, Surplus Cash
$k 2019 2020 Q1 2020 Q1 2021
Distributable Cash(1) 33,143 30,009 7,528 6,478
Refundable tax (407) (310) 177 (354)
Dist. to Unitholders (25,139) (21,350) (6,012) (5,314)
Dividends to Food Services (7,828) (6,811) (1,920) (1,915)
Net change in surplus (231) 1,538 (227) (1,105)
Surplus – beg of period 7,660 7,429 7,429 8,967
Surplus – end of period 7,429 8,967 7,202 7,862
(1) Distributable Cash is a non-IFRS measure. See “Non-IFRS Measures”.
28Fund Distributions and Payout
2019 2020 Q1 2020 Q1 2021
Distributable Cash per Unit(1) $1.863 $1.618 $0.406 $0.339
Refundable tax (paid) recovered (0.023) (0.017) 0.009 (0.019)
Cash generated after refundable tax 1.840 1.601 0.415 0.320
Payout ratio(2) 99.5% 93.8% 105.2% 111.5%
(1) Distributable Cash per Unit is a non-IFRS measure. See “Non-IFRS Measures”.
(2) Payout Ratio is a non-IFRS measure. See “Non-IFRS Measures”.
29Changes to Distribution Rates - 2020
• As a result of COVID-19, distributions were suspended for
three months beginning with the March 2020 distribution
• Distributions of $0.10 per unit recommenced with the June
2020 distribution paid July 31, 2020
• Special distribution of $0.30 per unit paid October 30, 2020
• Special distribution of $0.20 per unit paid December 31, 2020
30Changes to Distribution Rates - 2021
• Distribution rate increased from $0.10 to $0.135 per unit
beginning with the February 2021 distribution that was paid at
the end of March 2021
• Annualized distribution rate is now $1.62 per unit
31Annual Payout Ratio(1)
99.5%
100.0% 97.8%
98.0%
94.7%
96.0% 93.8%
94.0%
92.0% 90.3%
90.0%
88.0%
86.0%
84.0%
2017 2018 2019 2020 LTM Q1 '21
(1) Payout Ratio is a non-IFRS measure. See “Non-IFRS Measures”.
LTM = Last Twelve Months
32Royalty Pool Gross Sales
$1,600 $1,482
$1,363 $1,347 $1,349
$1,400 $1,189
$1,138
$1,200 $1,061
$957
$1,000 $856
(millions)
$794 $823
$710 $736 $777
$800
$599 $639
$539
$600 $456 $494
$384
$400
$200
$0
LTM = Last Twelve Months
33Number of Restaurants in Royalty Pool
994
1,000 971
934
950
896
900 861
838
850 814
790
800 760
737
750 715
700
700 676 685
654 660
638
650 620
604
585
600
550
34Forward Looking Information
Certain statements in this document contain forward-looking information within the meaning of applicable securities laws in Canada (“forward-looking information”). The words “anticipates”, “believes”, “budgets”, “could”, “estimates”,
“expects”, “forecasts”, “intends”, “may”, “might”, “plans”, “projects”, “schedule”, “should”, “will”, “would” and similar expressions are often intended to identify forward-looking information, although not all forward-looking information
contains these identifying words.
The forward-looking information in this document includes, but is not limited to: the strategic thrusts of A&W Food Services of Canada Inc. (“Food Services”), including, be the convenience they crave, build our financial health and success,
innovate our menu to win millennial visits, be trusted as #1 for truly good food and continue to successfully open new restaurants.
The forward–looking information in this document is based on various assumptions that include, but are not limited to: the general risks that affect the restaurant industry will not arise; no Class A exchangeable shares or Class B exchangeable
shares of the Company will be issued; there are no changes in availability of experienced management and hourly employees; there are no material changes in government regulations concerning menu labelling and disclosure and drive–thru
restrictions, franchise legislation or sales taxes; no publicity from any food borne illness; no material changes in competition; no material changes in the quick service restaurant burger market including as a result of changes in consumer taste or
health concerns or changes in economic conditions or unemployment, the COVID-19 pandemic or a disease outbreak; no material increases in food and labour costs; the continued availability of quality raw materials; continued additional
franchise sales and maintenance of franchise operations; Food Services is able to continue to grow same store sales; Food Services is able to maintain and grow the current system of franchises; Food Services is able to locate new retail sites in
prime locations; Food Services is able to obtain qualified operators to become A&W franchisees; no closures of A&W restaurants that materially affect the amount of the Royalty; no material impact on sales from closures of “anchor” stores in
shopping centres; no material changes in traffic patterns at shopping centres and other retail nodes; no material closures to shopping centres or other retail nodes in which A&W operates; no supply disruptions; franchisees duly pay service fees
and other amounts; no material impact from new or increased sales taxes upon gross sales; continued availability of key personnel; continued ability to preserve intellectual property; no material litigation from guests at A&W restaurants; Food
Services continues to pay the Royalty; the Company continues to pay dividends on the common shares and the Partnership continues to make distributions on its units in amounts sufficient to allow the Fund to continue to pay distributions on its
Units at current levels; the Company can continue to comply with its obligations under its credit arrangements; and the Company’s performance does not fluctuate such that cash distributions are affected.
The forward–looking information is subject to risks, uncertainties and other factors related to the quick service restaurant industry that include, but are not limited to: the general risks that affect the restaurant industry in general and the quick
service segment in particular, including competition with other well–capitalized franchisors and operators of quick service restaurants; risks related to changes in consumer preferences that adversely affect the consumption of quick service
restaurant hamburgers, chicken, fries, breakfast items or soft drinks; risks related to negative publicity, litigation or complaints from perceived or actual food safety events or other events involving the foodservice industry in general or A&W
restaurants in particular; risks related to changes in the availability and quality of raw materials, including A&W’s “better ingredients”; risks related to the possible lack of success of new products and advertising campaigns; risks related to
changes in climate or increases in environmental regulation; risks related to changes in Food Services’ ability to continue to grow same store sales, locate new retail sites in prime locations and obtain qualified operators to become A&W
franchisees; risks related to increases in closures of A&W restaurants adversely affecting the Royalty; risks related to decreases in traffic at shopping centers and other retail nodes; risks related to changes in Food Services’ ability to pay the
Royalty due to changes in A&W franchisees’ ability to generate sales and pay service fees and other amounts to Food Services; risks related to changes in government regulation that affects the restaurant industry in general or the quick service
restaurant industry in particular, including franchise legislation and sales tax legislation; risks related to changes in the availability of key personnel, including qualified franchise operators; risks related to changes in the ability to enforce or
maintain intellectual property; risks related to technological breakdowns, cybersecurity breaches and the security of consumer and personal information; risks related to the amplificatory effects of media and social media; risks related to global
health crises, disease outbreaks (including COVID-19), and other unexpected events which could affect Food Services’ and A&W franchisees’ supply chains, business continuity, and financial results; risks related to the availability and adequacy of
insurance coverage; and risks related to the occurrence of catastrophic events.
The forward–looking information is subject to risks, uncertainties and other factors related to the structure of the Fund that include, but are not limited to: risks related to dependence of the Fund on the Company, Partnership and Food Services;
risks related to dependence of the Partnership on Food Services; risks related to leverage and restrictive covenants; the risk that cash distributions are not guaranteed and will fluctuate with the Partnership’s performance and may be reduced or
suspended at any time; risks related to the unpredictability and volatility of Unit prices; risks related to the nature of units; risks related to the distribution of securities on redemption or termination of the Fund; risks related to the Fund issuing
additional units diluting existing Unitholders’ interests; risks related to income tax matters and investment eligibility; risks related to COVID 19; and risks related to the limitations of internal controls over financial reporting.
More information about the risks and uncertainties affecting the Fund and Food Services’ business can be found in the “Risk Factors” section of the Fund’s Annual Information Form dated February 16 2021, which is available under the Fund’s
profile on SEDAR at www.sedar.com
All forward-looking information in this document is qualified in its entirety by this cautionary statement and, except as required by law, the Fund undertakes no obligation to revise or update any forward-looking information as a result of new
information, future events or otherwise after the date hereof.
35Non-IFRS Measures
The Fund believes that disclosing certain non-IFRS financial measures provides readers of this document with important information regarding the Fund’s financial performance and its ability to pay distributions. By considering these
measures in combination with the most closely comparable IFRS measure, the Fund believes that investors are provided with additional and more useful information about the Fund than investors would have if they simply considered
IFRS measures alone.
References to “System Sales” in this document are calculated in respect of all A&W restaurants in Canada as reported by Food Services, as the amount of gross sales reported to Food Services by franchisees of such A&W restaurants
without audit, verification or other form of independent assurance, and the gross sales of A&W restaurants owned and operated by Food Services, after deducting, in each case, amounts for discounts for coupons and other promotional
offerings and applicable sales taxes. System Sales is a non-IFRS financial measures and does not have a standardized meanings prescribed by IFRS. However, Food Services believes System Sales of its franchisees and stores owned and
operated by Food Services is a key performance indicator for Food Services as it provides investors with an indication of the sales figures on which Food Services’ franchise revenues are based. Food Services’ method of calculating
System Sales may differ from those of other issuers or companies and, accordingly, System Sales may not be comparable to similar measures used by other issuers or companies. Note that the Fund also reports Gross Sales of A&W
restaurants in the Royalty Pool in its annual and interim financial statements. The Fund calculates “Gross Sales” reported by restaurants in the Royalty Pool on the same basis that Food Services calculates “System Sales”, with the
distinction that the Fund only calculates Gross Sales in respect of the A&W restaurants in the Royalty Pool in the given period. Accordingly, the difference in the Gross Sales reported by the Fund and System Sales reported by Food
Services is on account of the additional gross sales from A&W restaurants which are not in the Royalty Pool, which are included in the System Sales figures reported by Food Services and not in the Gross Sales figures reported by the
Fund.
References to “Same Store Sales Growth” in this document are calculated (i) in respect of A&W restaurants in the Royalty Pool as reported by the Fund, as the change in Gross Sales of A&W restaurants in the Royalty Pool that operated
during the entire 26 four-week periods, and (ii) in respect of all A&W restaurants in Canada as reported by Food Services, as the change of System Sales of all A&W restaurants in Canada that operated during the entire 26 four-week
periods. Same store sales growth is a non-IFRS financial measure and does not have a standardized meaning prescribed by IFRS. However, the Fund and Food Services each believe same store sales growth is a key performance indicator
for the Fund and Food Services as it provides investors with an indication of the change in year-over-year sales of A&W restaurants in the Royalty Pool, in the case of the Fund, and year-over-year sales of all A&W restaurants in the case
of Food Services. The Fund’s and Food Services’ methods of calculating same store sales growth may differ from those of other issuers or companies and, accordingly, same store sales growth may not be comparable to similar measures
used by other issuers or companies.
References to “Distributable Cash” in this document are calculated as the operating cash flows of the Fund, adjusted for net changes in items of working capital. Changes in items of working capital are excluded as the Fund’s working
capital requirements are not permanent and are primarily due to the timing of payments between related parties. No deduction is made for capital expenditures as the Fund has no capital expenditures. Distributable Cash is not a
recognized financial measure under IFRS. However, the Fund believes that Distributable Cash is a useful measure as it identifies the amount of actual cash generated to pay distributions to Unitholders and dividends to Food Services.
The Fund’s method of calculating Distributable Cash may differ from that of other issuers and companies and, accordingly, Distributable Cash may not be comparable to similar measures used by other issuers or companies. References
to “Distributable Cash per Unit” in this document are calculated as Distributable Cash divided by the weighted average number of Units of the Fund outstanding during the relevant period on a fully diluted basis.
References to “payout ratio” in this document are calculated by dividing the total of (i) distributions declared per unit plus (ii) accrued distributions per unit to the last day of the quarter or year, as applicable, by the distributable cash
per unit generated in that period. Payout ratio is not a recognized measure under IFRS. However, the Fund believes that payout ratio is a useful measure as it provides supplemental information regarding the extent to which the Fund
distributes cash as distributions when compared to its cash flow capacity. The Fund’s method of calculating its payout ratio may differ from that of other issuers and companies and, accordingly, the payout ratio may not be comparable
to similar measures used by other issuers or companies.
For a reconciliation of distributable cash to the nearest IFRS measure, see the Fund’s management discussion and analysis for the period ended March 28, 2021, filed under the Fund’s profile on SEDAR at www.sedar.com.
36Third Party Information
This document includes market information, industry data and forecasts obtained from independent industry publications, market research, surveys and other publicly available sources. Although the Fund’s management believes these
sources to be generally reliable, market and industry data is subject to interpretation and cannot be verified with complete certainty due to limits on the availability and reliability of raw data, the voluntary nature of the data gathering
process and other limitations and uncertainties inherent in any statistical survey. Accordingly, the accuracy and completeness of this information and data are not guaranteed. The Fund and Food Services have not independently verified any
of the data from third party sources referred to in this document nor ascertained the underlying assumptions relied upon by such sources.
3738
You can also read