Interim Results Presentation - FOR THE 26 WEEKS ENDED JUNE 2019 - Massmart
←
→
Page content transcription
If your browser does not render page correctly, please read the page content below

Interim Results
 Presentation
    FOR THE 26 WEEKS
     ENDED JUNE 2019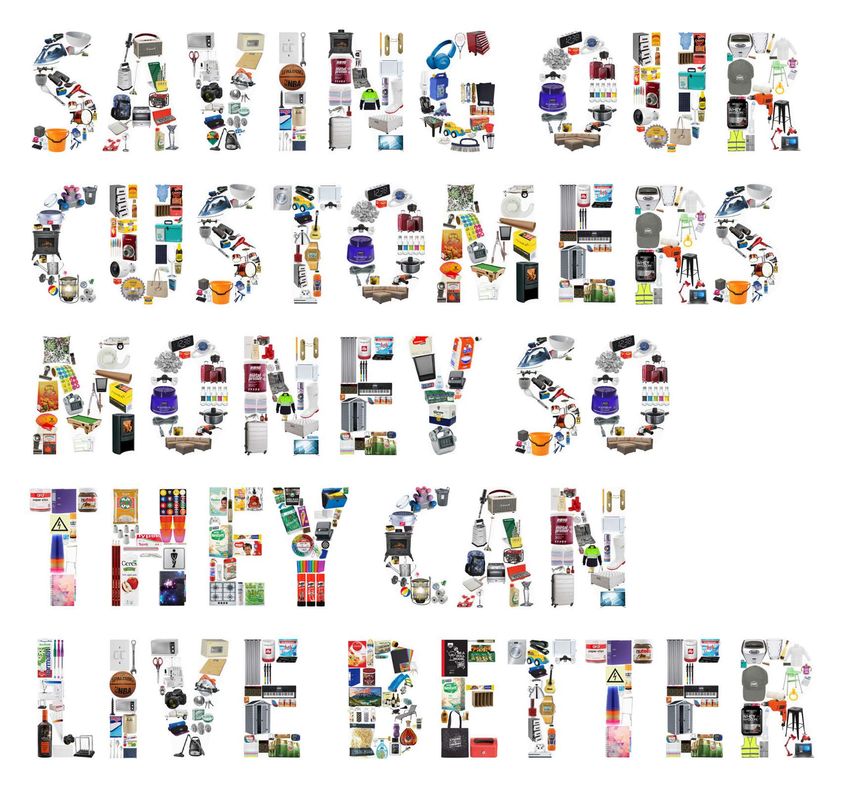
01
 FINANCIAL
  REVIEW
    02
OPERATIONAL
  REVIEW
    03
 ADDITIONAL
INFORMATION
01
Financial
 review
Income Statement
June 2019 like-on-like
Condensed Consolidated Income Statement
26 WEEKS 2626WEEKS
WEEKS 2626WEEKS
WEEKS
JUNE 2019 IFRS 16 JUNE
JUNE2019
2019 JUNE
JUNE2018
2018 ADJUSTED
Rm (REVIEWED) ADJUSTMENT (ADJUSTED)
(ADJUSTED) (REVIEWED)
(REVIEWED) % CHANGE
Revenue 43,909.4 - 43,909.4
43,909.4 41,688.4
41,688.4 5.3 • Depreciation
Sales 43,832.4 - 43,832.4
43,832.4 41,558.4
41,558.4 5.5
increased due to
Cost of sales (35,403.5) - (35,403.5)
(35,403.5) (33,416.3)
(33,416.3) (5.9)
Gross profit 8,428.9 - 8,428.9
8,428.9 8,142.1
8,142.1 3.5
right-of-use (ROU)
Other income 76.6 - 76.6
76.6 127.9
127.9 (40.1) assets
Depreciation and amortisation (1,548.4) 890.5 (657.9)
(657.9) (546.7)
(546.7) (20.3)
Employment costs (3,967.4) - (3,967.4)
(3,967.4) (3,653.8)
(3,653.8) (8.6) • Occupancy costs
Occupancy costs (644.6) (1,210.8) (1,855.4)
(1,855.4) (1,706.6)
(1,706.6) (8.7) decreased
Other operating costs (2,026.2) - (2,026.2)
(2,026.2) (1,698.5)
(1,698.5) (19.3)
Trading profit before interest and taxation 318.9 (320.3) (1.4)
(1.4) 664.4
664.4 (100.2) • Finance costs
Restructuring costs
Impairment of assets
-
(46.9)
-
- (46.9)
--
(46.9)
(110.3)
(110.3)
(8.5)
(8.5)
100.0
(451.8)
increased due to the
Insurance proceeds on items in PP&E 0.4 - 0.4
0.4 2.1
2.1 (81.0) recognition of the
Operating profit/(loss) before foreign exchange movements and interest 272.4 (320.3) (47.9)
(47.9) 547.7
547.7 (108.7) lease liability
Foreign exchange loss (157.1) 75.2 (81.9)
(81.9) 23.4
23.4 (450.0)
Operating profit/(loss) before interest 115.3 (245.1) (129.8)
(129.8) 571.1
571.1 (122.7) • Taxation – temporary
- Finance costs (921.9) 556.5 (365.4)
(365.4) (310.5)
(310.5) (17.7)
differences relate to
- Finance income 12.3 - 12.3
12.3 10.8
10.8 13.9
Net finance costs (909.6) 556.5 (353.1)
(353.1) (299.7)
(299.7) (17.8) IFRS 16
(Loss)/Profit before taxation (794.3) 311.4 (482.9)
(482.9) 271.4
271.4 (278.0)
Taxation (38.1) (64.8) (102.9)
(102.9) (81.4)
(81.4) (26.4)
(Loss)/Profit for the period (832.4) 246.6 (585.8)
(585.8) 190.0
190.0 (408.3)
(Loss)/Profit attributable to:
- Owners of the parent (836.1) 246.6 (589.5)
(589.5) 195.7
195.7 (401.2)
- Non-controlling interests 3.7 - 3.7
3.7 (5.7)
(5.7) 164.9
(Loss)/Profit for the period (832.4) 246.6 (585.8)
(585.8) 190.0
190.0 (408.3)
Balance Sheet impact
Condensed Consolidated Statement of Financial Position
                                                 DECEMBER
                                                     2018         IFRS 16              2019     JUNE 2019
                                                              AT ADOPTION   OPENING BALANCE
Rm                                                (AUDITED)   ADJUSTMENT          (ADJUSTED)   (REVIEWED)
                                                                                                            •   ROU assets recognised due to
ASSETS                                                                                                          IFRS 16 adoption entry
Non-current assets                               14,165.8      8,530.0           22,695.8      22,086.7
                                                                                                            •   Lease liability raised on a
Property, plant and equipment                     9,109.5               -         9,109.5       8,820.5
                                                                                                                present value basis of future lease
Right-of-use asset                                 537.7       8,530.0            9,067.7       8,571.6
                                                                                                                commitments
Goodwill and other intangible assets              3,656.3               -         3,656.3       3,745.8
Investments and other financial assets             119.2                -           119.2         143.6
                                                                                                            •   Other non-current liabilities and
Deferred taxation                                  743.1                -           743.1         805.2
                                                                                                                provisions decreased to remove
Current assets                                   20,605.2       (118.1)          20,487.1      17,353.9
                                                                                                                the full operating lease smoothing
                                                                                                                liability which is allocated against
Non-current assets classified as held for sale       11.6               -             11.6        166.7
                                                                                                                the ROU asset
Total assets                                     34,782.6      8,411.9           43,194.5      39,607.3
EQUITY AND LIABILITIES
Total equity                                      6,528.6       (227.1)            6,301.5      5,280.3
Non-current liabilities                           3,694.5       8,784.3          12,478.8      11,502.5
Interest-bearing borrowings                       1,606.0               -          1,606.0      2,267.6
Lease liability                                    648.1      10,060.6           10,708.7       9,056.6
Deferred taxation                                    76.7               -             76.7          86.5
Other non-current liabilities and provisions      1,363.7     (1,276.3)               87.4          91.8
Current liabilities                              24,559.5       (145.3)          24,414.2      22,814.5
Total equity and liabilities                     34,782.6       8,411.9          43,194.5      39,607.3
Gross profit
                                     Sales                                               margin

                     R43.8bn                                                       19.2%
Like-on-like                  2018: R41.6 billion                                         2018: 19.6%

 Financial
 summary                Trading loss before
                          interest and tax                                           Headline loss
                      (excl restructure costs)                                  (excl restructure costs)
  26-week basis

                        -R1.4m -R550.0m
                         2018: R664.4 million profit                            2018: R283.5 million earnings

                  Like-on-like basis excluding IFRS 16 impact in both periods
Our poor performance in summary

Weaker sales growth:               Margin pressure                                                Expenses
                                   (down 36bps*, approx. R160m)                                   (up 110bps*, approx. R900m)

• Continued consumer pressure:     • Greater participation of lower-margin                        • People, property & depreciation
   • GDP -3.2% Q1                    Food & Liquor sales                                            within expectations (75% of total)
   • Unemployment 29%              • Increased customer-led promotional                             apart from employee insourcing
• Low food inflation                 sales mix                                                    • Some pressure from 3.1% new space
• 2nd quarter slow-down, despite   • Slower than expected recovery in our                         • Other expenses higher than
  Easter                             margin-management in Game and                                  expected: security, generators’ diesel
                                     Masscash                                                       and maintenance, bad debts, credit
                                                                                                    card usage, new store pre-opening
                                                                                                    costs, IT support costs
                                                    * As a percentage of sales
                                    Like-on-like basis excluding IFRS 16 impact in both periods
Sales by geography and category
             Continued tough trading environment

  Total Group: R43.8 bn                         Group Food &
                                                Liquor sales      h   8.2%         Group
                                                                                   Durables sales   h   2.7%
  SA Sales                                                         Food & Liquor                        Durables

  91.1%                                                            56%                                  44%
  h 4.9%                                                           h 7.9%                               h 1.3%

  Ex-SA Sales                                                      Food & Liquor                        Durables

  8.9%                                                             52%
                                                                    h 14.6%
                                                                                                        48%
                                                                                                        h 8.8%
  h 11.8%      h 6.4%        Constant
                             Currency

             26-week like-on-like basis excluding IFRS 16 impact in both periods
Gross profit margin

                                   • Lower sales participation
  Jun 18              Jun 19         of higher-margin Durable
                                     Goods products

19.6%              19.2%           • Increased lower-margin
                                     promotional sales
                                     participation
R8.1 billion                       • Weak margin
                    R8.4 billion
                                     management in Game
                                     and Masscash
                                   • Stock aging in Game
Cost pressures
                                                Total expenses grew at 11.8%, comparable expenses at 9.2%

             Depreciation                                 Employment costs                  Occupancy costs                  Other operating expenses

     h 20.3%                                                  h 8.6%                        h 8.7%                         h 19.3%
        h 15.4% COMPARABLE                                    h 7.2% COMPARABLE             h 6.5% COMPARABLE               h 14.3% COMPARABLE

 • Re-assessment of useful lives                        • 46,500 FTEs (8% growth) due       • Net 3.1% trading space       • Increased credit card expenses
   (IFRS) in 2018. Excluding this                         to in-sourced temporary             increase since June ‘18        and security costs (weak economy)
   increase is 9.3%                                       contractors to permanent staff:   • Pressure from increased        R50m
 • Completion of SAP Hybris                               increase to benefits costs          municipal & electricity      • IT system implementations in
   in Makro                                             • Impact of new stores                tariffs including costs of     change management mode: costs
 • Net 16 stores opened since                                                                 generators (load-              expensed no longer capitalised
   June ’18 with space growth                                                                 shedding)                      R50m
   of 3.1%                                                                                                                 • Pre-opening expenses R53.5m
                                                                                                                             (2018: R18.6m): 7 new stores
                                                                                                                             opened (June 2018: 5 new stores)
Like-on-like basis excluding IFRS 16 impact in both periods
Forex, interest and tax
Rm JUN 2019 JUN 2018 MOVEMENT
• Currency weaknesses
Foreign exchange loss/(gain) 81.9 (23.4) 105.3 in Zambia & Nigeria
• Increased average levels
Net finance costs 353.1 299.7 53.4 of borrowing
• Impairment of deferred
Tax expense 102.9 81.4 21.5 tax assets and limited
recognition of further
deferred tax assets
Like-on-like basis excluding IFRS 16 impact in both periodsSales performance
Total sales h5.5%. Comparable sales h3.6%
Massdiscounters Masswarehouse Massbuild Masscash
R9.4bn R13.4bn R6.7bn R14.3bn
2018: R9.1bn 2018: R12.9bn 2018: R6.4bn 2018: R13.1bn
h3.0% SALES h3.7% SALES h5.0% SALES h9.1% SALES
• Product inflation of 0.8% • Product inflation of 2.9% • Product inflation of 2.8% • Product inflation of 3.6%
• Good Food growth in Game (9%): • Good sales growth in Liquor • Slow sales growth in SA stores: • Good Wholesale sales growth
contributes 20% of total sales (11.9%) negative construction growth in 13.3%, benefitted from inflation
• Ex-SA sales grew 5.8% in Rands • Durable sales impacted by 3 consecutive quarters • Retail sales growth 2.9% in very
and was relatively flat in constant deflation • Good ex-SA growth of 25.5%, competitive environment
currencies • New Makro store opened in and 19.2% in constant • Good ex-SA growth 14.6% and
• Game SA sales up 3.5% and Cornubia in March ‘19 currencies (new stores) 10.4% in constant currencies
customer count up 5.5%Gross margin
Gross margin % down 36bps
Massdiscounters Masswarehouse Massbuild Masscash
R2.2bn R2.4bn R2.1bn R1.7bn
2018: R2.2bn 2018: R2.3bn 2018: R2.0bn 2018: R1.6bn
23.3% i20bps 17.5% i19bps 31.1% h23bps 12.0% i33bps
• Increased inventory provisions • Lower sales participation in • Higher retail contribution driving • Lower collection of rebates and
• Gen Merch sales pressure with Gen Merch higher margin margin support
higher Food participation • Stabilising Massfresh trading • Competitive Retail market
taking longer than anticipatedSG&A expenses
Total SG&A expenses h11.8%. Comparable expenses h9.2%
Massdiscounters Masswarehouse Massbuild Masscash
R2.6bn R2.0bn R1.8bn R1.9bn
2018: R2.3bn 2018: R1.8bn 2018: R1.7bn 2018: R1.7bn
h11.1% EXPENSES h9.0% EXPENSES h9.4% EXPENSES h14.4% EXPENSES
• Net new stores: 8 • Net new stores: 1 • Net new stores: 7 • Re-assessment of useful lives
7 Game: 2 ex-SA, 5 peri-urban SA (6.5% space growth) (1.8% space growth) (IFRS) in 2018
(1.3% space growth) • Pre-opening costs • Pre-opening costs • Other costs relating to bad
• Employment costs impacted by R13.8m (June 2018: R0m) R32.1m (June 2018: R17.3m) debts, equipment and credit
in-sourcing temporary staff • Security contractors card costs
• Occupancy costs due to rates and • Credit card costs • Employment costs impacted by
utilities increases and self in-sourcing temporary staff
generated power costs
• SAP IT project costs, supply chain
& logistics
Like-on-like basis excluding IFRS 16 impact in both periodsDivisional performance
Trading profit before interest and taxation i100%
Massdiscounters Masswarehouse Massbuild Masscash
-R396.1m R336.4m R250.2m -R190.4m
2018: -R95.3 million 2018: R484.7 million 2018: R280.5 million 2018: -R4.1 million
Like-on-like basis, excluding IFRS 16 impact in both periods
The 'trading profit before interest and tax' above is the amount per the condensed consolidated income statement less the BEE transaction IFRS 2 charge and excludes restructure costs.Working capital
57
Inventory days
56
Creditor days
10
Debtor days
i3 days i4 days no change
R12.6bn
R12.7bn
R11.1bn
R11.0bn
R2.4bn
R2.4bn
2019 2018 2019 2018 2019 2018
• Actively driving lower stock levels • Mix change with higher Food • Monitoring trade debt carefully
despite 16 new stores purchases (with lower funding days)Management discipline
in a tough environment
Rm JUN 2019 JUN 2018
• EBITDA down 22.7%
EBITDA 12-month rolling 2,648.9 3,429.6
• Net debt below last year
Net debt 7,036.3 7,157.2
• Improved cash utilised in
Total equity 5,280.3 6,021.8 operations despite lower
profitability
Gearing ratio 0.61 0.58
Cash utilised in operations (3,711.0) (3,891.5)
Like-on-like basis excluding IFRS 16 impact in both periods02 Operational review
Household consumption
               Consumer spending on Durables decreasing as at March 2019 (year-on-year Q1)

                                                                   SERVICES         NON-DURABLES

                                                                   h0.8% h1.0%
                                                                   SEMI-DURABLES    DURABLES

                                                                   h1.8% i1.5%
                                                                                    Source: South African Reserve Bank
Consumer prioritising Food     Consumer delaying spend for                                   Real figures from Q1 2019
over Durables                  promotions and prioritising value
Strategic priorities
Improve profitability of Massdiscounters & Masscash
Drive structurally lower operating costs
Implement a Group DC-services & -network function: reduce cost-to-serve by 1%
Invest in online sales and grow Africa
Drive VAS customer offerings
Responsible businessFixing our controllables
Game Masscash Massfresh
• Weak margin management • Weak margin management • Slower than expected sales
• SAP implementation delay & margin recovery
• New leadership, incl. Merchandise Director • New leadership • New leadership
• Rebuilding capacity & processes post-2018 • Improving capacity & processes • SAP system redesigned with improved
restructure for better margin management post-2018 restructure for better business rules
& control margin management & control
• Improved focus on trading disciplines
• SAP implementation delayed to Q2 2020 • Strong supplier support
due to concerns at 3rd party System
Integrator. Engaged constructively, with
SAP supportLeveraging Group scale for efficiency
Group–wide transport, logistics,
planning & storage
Making good progress in establishing multi-
tenanted group Distribution Centre Network,
which will enable cost effective availability by
leveraging group scale
Savings achieved particularly through focus on
Final Mile deliveries to customers
Objective to reduce cost to serve by 1%
Supplier onboarding through Massmart
Distribution Network grew by 5%, with further
growth planned for H2Focus on
omnichannel
Online sales represents
0.8% sales participation Group online highlights
h 20% h 36%
Online sales down 14%
• SAP Hybris implementation issues in
Makro causing system downtime
Basket size Online traffic growth
• Builders Warehouse:
h 20% 316
• Decreased sales on water
harvesting equipment post 2018
Western Cape drought
• Positive sales growth in every Articles available Unique customer Builders Click & Collect
other category online collection points delivery expanded into Africa
(2 in Botswana) and all Builders
stores in major metros
(21,300 articles available)
SA Retail’s first Whatsapp
chatbot/virtual assistant in MakroAfrica footprint
Nigeria
Ghana
Uganda
Kenya 12
Countries
R3.9bn Sales
Tanzania
48
Stores
242,678
m2 of retail space
Zambia
Malawi
17%
e
Builders
i qu
b
Game am
oz of total space is ex-SA
Masscash Namibia M
Botswana
NEW
LesothoVAS growth
A competitive range of
Financial Services are now
available across all divisions
h 12%
growth in sales
h 50% h 22% h 16% h 322% h293%
Total money RCS credit business RCS loans business Increase in Bill payments
collected electricity sales (excl. SABC & RCS)Private Label
Continued focus on Group collaboration and sourcing of Private Label
products to offer customers good quality products at low price points
Group collaboration focused on reducing product costs to save
• New Builders branded
customers money products & increased brand
exposure sales up 9% and
margin up 22%
FOOD GEN MERCH HOME IMPROVEMENT
• Growth in sport continues: new
21 54 37 range of Trojan health
equipment sales up 27.1% and
Brands in portfolio Brands in portfolio Brands in portfolio margin up 36.1%
6.6% 11.9% 20.5%
Sales penetration Sales penetration Sales penetration
2018: 6.1% 2018: 11.8% 2018: 19.7%Key performances
Good liquor growth Durables demand soft, Click-and-collect
strong market share in Botswana Cross collaboration
h 13.6% 40% +2 stores R100 deals
Increased liquor Market shares in Large Focus on Game & Makro
participation Domestic Appliances* omnichannel
* Source: GFK SA (June 2019)Responsible business
ENERGY
SAVING
Achieved R1bn milestone Almost 8 million kWh of Only retailer in South Africa to
from small manufacturers renewable energy generated partner with the United Nations
participating in our SDP Development Programme
• Anticipated energy savings of (UNDP) to promote energy
• Import substitution focus improves R20 million as a result of renewable efficient appliances
on shelf availability e.g. toilet seats, energy interventions over the next
nails and chefware five years
• Major appliances sales growth
of 72.1% at full margin during
promotionExceptionally strong consumer awareness
Metropolitan consumer intent to shop poll
% of consumers who intend
Category to shop at Massmart
Black Friday deals 50%
TVs & electronics 72% Consumer
2nd choice
Large appliances 72% Consumer
1st choice
Outdoor & camping 66%
Small appliances 64%
Health & fitness 58%
Consumer
Patio & garden 54% 2nd choiceOutlook
• Sales growth for the period subsequent to June 2019
on a like-on-like basis for the 33 weeks to 18 August
2019 were R55.8bn, representing total sales growth of
5.0% and comparable sales growth of 3.2%. Estimated
product inflation of 2.6%.
• Assuming no further deterioration in the SA consumer
economy for 2019, Massmart expects basic earnings
per share for Dec 2019 to be at least 50% below last
year’s of 410.6 cents excl. IFRS 16 and at least 100%
below incl. IFRS 16
• On the same basis, Massmart expects headline
earnings per share for Dec 2019 to be at least 50%
below last year’s of 416.5 cents excl. IFRS 16 and at
least 100% below incl. IFRS 16
Any reference to future financial performance included in this document has not been reviewed
or reported on by the Group’s external auditors. The auditor’s report does not necessarily report
on all of the information contained in this announcement/financial results. Shareholders are
therefore advised that in order to obtain a full understanding of the nature of the auditor’s
engagement they should obtain a copy of the auditor’s report together with the accompanying
financial information from the issuer’s registered office.www.massmart.co.za/interimresults2019
03
         Additional
        information

Condensed Consolidated Income Statement
         Tax rate reconciliation
          Cash flow statement
           Capex per category
            Capital expansion
              Store portfolio
  Forecast stores: Jul 2019 – Dec 2022
            Number of shares
Condensed Consolidated Income Statement Extract from Reviewed Consolidated Results for the period ended 30 June 2019
Tax rate reconciliation

                                                                                    JUN 2019     JUN 2018
RM                                                                                (REVIEWED)   (REVIEWED)

Standard tax rate                                                                    28.0         28.0
Non-taxable income and disallowable expenses                                         (0.3)        (0.5)
Assessed losses not utilised                                                        (28.7)          1.9
Other - including foreign tax adjustments                                            (3.8)          0.5
Group tax rate                                                                       (4.8)        29.9

Like-on-like basis excluding IFRS 16 impact in both periods
Cash flow statement
JUN 2019 JUN 2018
RM (ADJUSTED) (REVIEWED)
Operating cash before working capital movements 659.1 1,256.2
Working capital movements (4,370.1) (5,147.7)
Cash generated in operations (3,711.0) (3,891.5)
Net interest and tax paid (684.2) (532.8)
Net investment to maintain operations (318.8) (274.0)
Free cash flow (4,714.0) (4,698.3)
Dividends paid (129.7) (603.0)
Dividends received - 14.0
Investment to expand operations and other net investing activities (354.5) (347.2)
Cash outflow before financing activities (5,198.2) (5,634.5)
Like-on-like basis excluding IFRS 16 impact in both periodsCapex per category
Total capex 1.6% of total sales (2018: 1.5%)
Expansionary
JUN 2019 JUN 2018
investment
RM (REVIEWED) (REVIEWED)
Land and buildings/leasehold improvements 68.4 92.7
Vehicles 0.4 39.9
18.1%
Fixtures, fittings, plant and equipment 72.3 97.1
Computer hardware 71.8 8.6 0.1%
Computer software 164.0 120.6 43.5%
Investment to expand operations 376.9 358.9 19.2%
Land and buildings/leasehold improvements 56.2 54.1
Vehicles 33.9 16.9 19.1%
Fixtures, fittings, plant and equipment 157.0 94.8 Land & buildings/leasehold improvements
Computer hardware 44.2 46.9 Vehicles
Fixtures, fittings, plant & equipment
Computer software 27.5 61.3
Computer hardware
Investment to maintain operations 318.8 274.0 Computer softwareCapital expansion
2.0% R 800
1.8%
R 700
Businesses acquired
1.6%
R 600
Capex as a % of sales
1.4% Property acquisitions
R 500
1.2% Investment to expand operations
1.0% R 400
Investment to maintain operations
0.8%
R 300
Total capex as a % of sales
0.6%
R 200
0.4%
Total capex as a % of sales excluding
business and property acquisitions
R 100
0.2%
JUNE JUNE JUNE JUNE JUNE JUNE
2014 2015 2016 2017 2018 2019
0.0% R0Store portfolio
Total Massdiscounters Masswarehouse Massbuild Masscash
441 172 22 117 130
Up from 436 Up from 171 Up from 21 Up from 114 130 in Dec 2018
in Dec 2018 in Dec 2018 in Dec 2018 In Dec 2018
+3 Game +1 Makro +2 Builders Superstore
+5 +2 in South Africa +1 in South +2 in South Africa
Net opened +1 in Namibia Africa
+1 Builders Express
-2 DionWired +1 in South Africa
-2 in South AfricaForecast stores
Jul 2019 – Dec 2022
Total Massdiscounters Massbuild Masscash
+27 +6 +8 +13
Up from 441 to 468 Up from 174 to 182 Up from 117 to 125 Up from 130 to 143
+6 Game +2 Builders Warehouse +12 Retail
+20 +1 in South Africa +1 in South Africa +12 in South Africa
South Africa +1 in Kenya +1 in Kenya
+2 in Botswana +1 Wholesale
+7 +1 in Namibia
+1 in Zambia
+2 Builders Express
+2 in South Africa
+1 in Kenya
Ex-SA
+3 Builders Superstore
+3 in South Africa
+1 Builders Trade Depot
+5.6% +3.2% +1 in South Africa +9.8%
Up from 1,679,524m2
to 1,773,886m2
Up from 567,103m2
to 585,103m2 +8.1% Up from 388,714m2
to 426,698m2
Up from 476,582m2
to 514,961m2
This 5.6% increase includes a 10.1% increase in our ex-SA trading spaceNumber of shares
‘000
At Dec 2018 217,179.1
Shares issued 1,959.7
At Jun 2019 219,138.8
Weighted-average at Jun 2019 218,400.1
Diluted weighted-average at Jun 2019 221,006.5You can also read