RESEARCH Cap & Discount Rate Report - South African ...
←
→
Page content transcription
If your browser does not render page correctly, please read the page content below
RESEARCH Cap & Discount Rate Report
MAY 2020
CAP & DISCOUNT RATE REPORT

 Key Research Findings
     The SAPOA Cap & Discount Rate Survey for the six months ended May 2020 shows that the
     All Property cap rate shifted out 10bps over the past 6 months and 20bps over the past 12
     months, while the discount rate weakened by the same amount since assumed future market
     rental growth remained stable.

     As a result of various exogenous factors, the yield on instruments like the R186 has been volatile.
     Despite the volatile nature of the bond yield during the past few years, the continued narrow
     spread relative to cap and discount rates have raised questions around asset pricing generally.
     While landlords remain wary of a further deterioration in local bond yields and its impact on capital
     growth, a declining interest rate might provide support to the downside.

     The unattractive yield on international bonds is currently a key balancing factor for South African
     bond yields. Previous research by MSCI suggests that long-dated bond and property yields donÕt
     always rise in parallel Ð especially in the presence of accelerating rental growth.

     The extent to which the economic fallout caused by the Covid-19 pandemic negatively affects
     vacancy ratesÊ and rental growth may see increased pressure on property yields and its pricing
     relative to bonds given a renewed focus on propertyÕs risk premia.

     While the overall discount rate ticked up by 10bps in the six months to May, an analysis of the
     underlying property types suggests a mixed picture.

     The largest improvement was seen in the smaller format retail centres which has been outperforming
     larger centres, both from a returns and trading density point of view. Traditionally, perceived as
     a higher risk investment, convenience retail might be a beneficiary of the post Covid retail
     landscape as consumers change their shopping habits amid a structural shift in tenant mix across
     retail segments.

     The largest increase in discount rate was reported for low quality offices. In the wake of Covid-
     19 this segment of the market may be particularly hard hit given increased Work From Home
     and heightened economic pressure on SMMEÕs.

     During the six months ended May 2020, valuers held their assumption on future market rental
     growth at around 4.9% while their expectation of property expenditure growth softened by around
     30bps

     As at May 2020, property expenditure was assumed to grow at a perpetual 7.1% per annum over
     the course of a five year cashflow period while future market rental growth was assumed at 4.9%
     year-on-year.

     On a segment level, the largest decline in assumed market rental growth was seen in the Cape
     Town CBD Office market and non-CBD secondary quality offices where increasing vacancies
     and the heightened uncertainty as a result of the Covid-19 pandemic might be weighing on
     valuerÕs minds.

     Overall, future property expenditure growth has come down with the highest decreases coming
     in the smaller format retail segments where the impact of administered price increases may be
     lower than expected given NERSAÕs approved tariff increase of 6.9% for municipalities.

                              T: (011) 883 0679 F: (011) 883 0684
                              Email: marketingmanager@sapoa.org.za                                           02
                              Web: www.sapoa.org.za
MAY 2020
CAP & DISCOUNT RATE REPORT

 Cap & discount rates slowly starting trend up?
 The SAPOA Cap & Discount Rate
 Survey for the six months ended
 May 2020 shows that the All
 Property cap rate shifted out 10bps
 over the past 6 months and 20bps
 over the past 12 months, while the
 discount rate weakened by the
 same amount since assumed future
 market rental growth remained
 stable.

 As a result of various exogenous
 factors, the yield on instruments
 like the R186 has been volatile.
 Despite the volatile nature of the
 bond yield during the past few
 years, the continued narrow spread
 relative to cap and discount rates
 have raised questions around asset
 pricing generally.

 While landlords remain wary of a
 further deterioration in local bond
 yields and its impact on capital
 growth, a declining interest rate
 might provide support to the
 downside.

 The unattractive yield on international bonds is currently a key balancing factor for South African bond
 yields. Previous research by MSCI suggests that long-dated bond and property yields donÕt always rise in
 parallel Ð especially in the presence of accelerating rental growth.

 The extent to which the economic fallout caused by the Covid-19 pandemic negatively affects vacancy
 ratesÊ and rental growth may see increased pressure on property yields and its pricing relative to bonds
 given a renewed focus on propertyÕs risk premia.

                               T: (011) 883 0679 F: (011) 883 0684
                               Email: marketingmanager@sapoa.org.za                                   03
                               Web: www.sapoa.org.za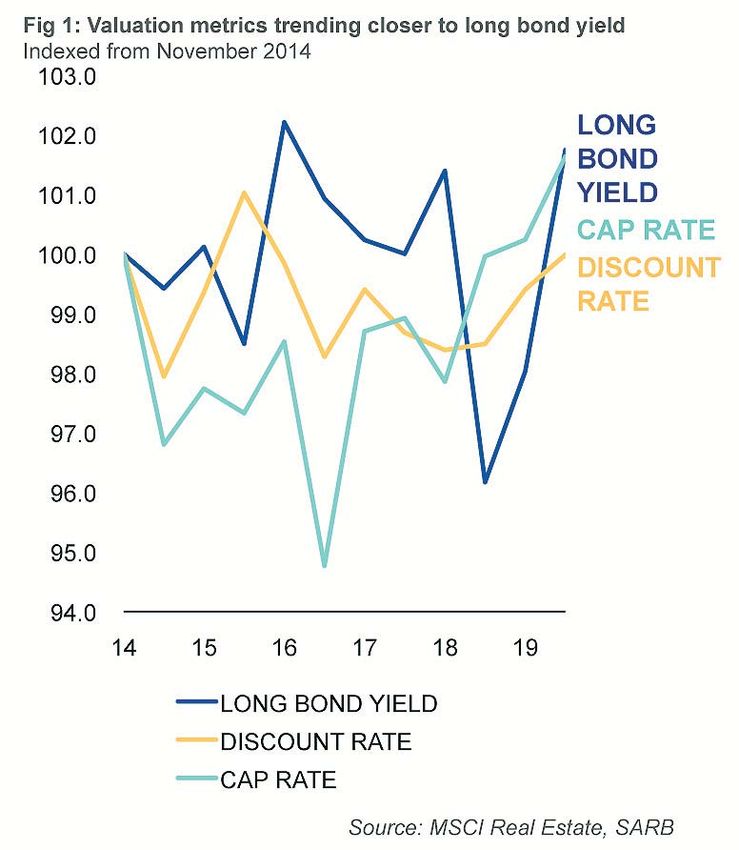
MAY 2020
CAP & DISCOUNT RATE REPORT

  Discount rates weakened most across Retail segments
While the overall discount rate ticked
up by 10bps in the six months to May,
an analysis of the underlying property
types suggests a mixed picture. During
the six month period, many property
segments reported softening discount
rates while only a couple of segments
reported meaningful strengthening
(Figure 2).

The largest improvement was seen in
the smaller format retail centres which
has been outperforming larger centres,
both from a returns and trading density
point of view.

Traditionally, perceived as a higher risk
investment, convenience retail might be
a beneficiary of the post Covid retail
landscape as consumers change their
shopping habits amid a structural shift
in tenant mix across retail segments.

Early indications from MSCIÕs Retail
benchmarking data is that the
entertainment and food service
categories may be among those hardest
hit in the short term and vulnerable to
structural shifts in consumer behaviour
as the retail sector comes to grips with
a combination of social distancing and
constrained retail spend.

The largest increase in discount rate was reported for the tertiary office segment (in other words low quality
offices). In the wake of Covid-19 this segment of the market may be particularly hard hit given increased
Work From Home and heightened economic pressure on SMMEÕs.

Super Regional centres also saw its discount rate increase by 30bps over the six months to May 2020 as
valuers digest the impact of Covid-19 and what it might mean for larger retail centres in the short to medium
term.

                                T: (011) 883 0679 F: (011) 883 0684
                                Email: marketingmanager@sapoa.org.za                                        04
                                Web: www.sapoa.org.za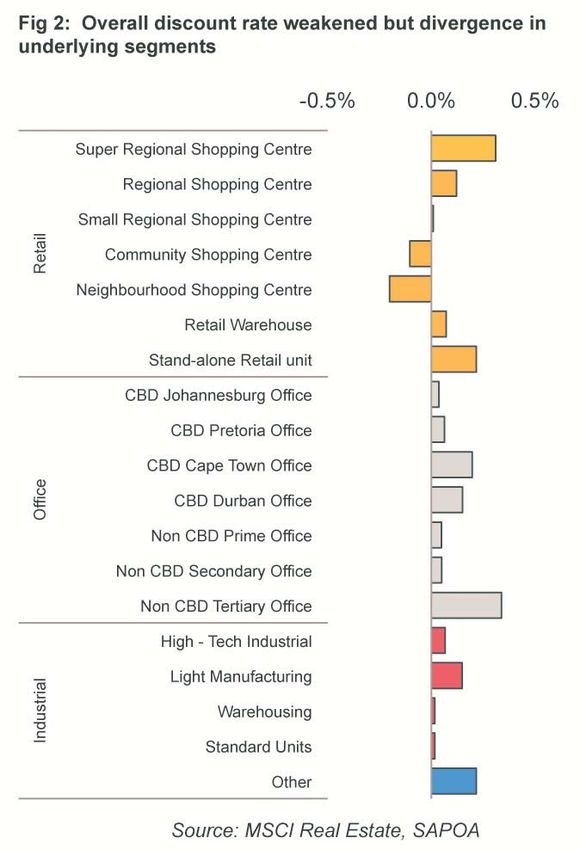
MAY 2020
CAP & DISCOUNT RATE REPORT
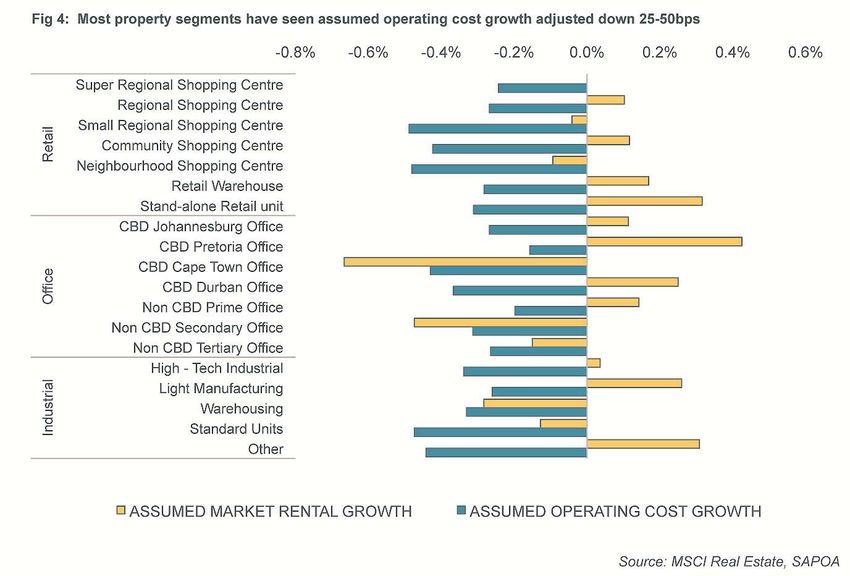
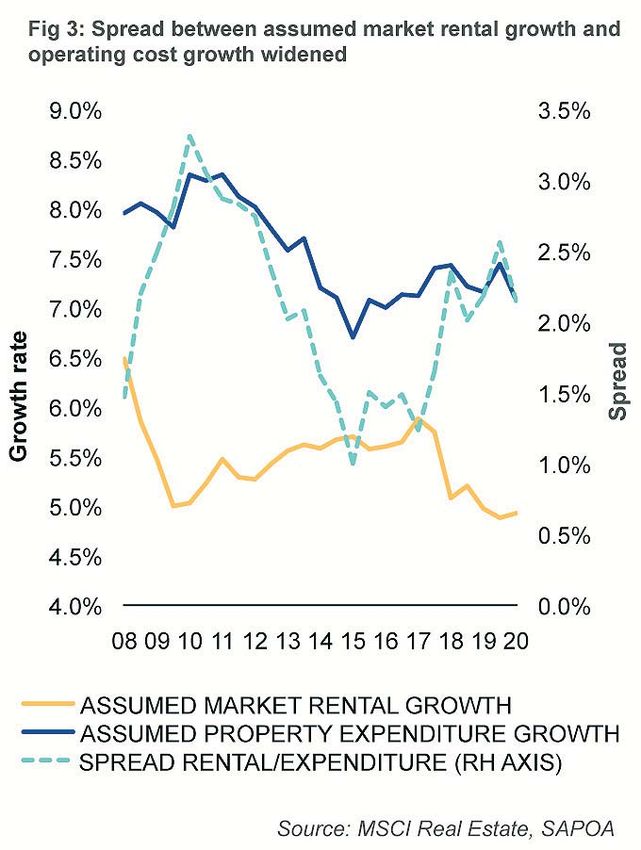
Assumed rental growth stable, expenditure growth down
During the six months ended May
2020, valuers held their assumption
on future market rental growth at
around 4.9% while their expectation
of property expenditure growth
softened by around 30bps.
As at May 2020, property expenditure
was assumed to grow at a perpetual
7.1% per annum over the course of a
five year cashflow period while future
market rental growth was assumed at
4.9% year-on-year. (Figure 3)
On a segment level, the largest decline
in assumed market rental growth was
seen in the Cape Town CBD Office
market and non-CBD secondary
quality offices where increasing
vacancies and the heightened
uncertainty as a result of the Covid-
19 pandemic might be weighing on
valuerÕs minds (Fig 4).
In the 6 months to November 2019,
the Cape Town CBD office segment
saw its assumed market rental growth
figure increase. Indications are that
this has now been reversed with a
20bp discount rate increase further
evidence of increased perceived future
income risk.
Overall, future property expenditure growth has come down with the highest decreases coming in the smaller
format retail segments where the impact of administered price increases may be lower than expected given
NERSAÕs approved tariff increase of 6.9% for municipalities.
T: (011) 883 0679 F: (011) 883 0684
Email: marketingmanager@sapoa.org.za 05
Web: www.sapoa.org.za
MAY 2020
CAP & DISCOUNT RATE REPORT

Most segments see lower expected future cost growth

                    T: (011) 883 0679 F: (011) 883 0684
                    Email: marketingmanager@sapoa.org.za   06
                    Web: www.sapoa.org.za
MAY 2020
             CAP & DISCOUNT RATE REPORT

                                                Market Discount Rate

             Property Type                                   MIN                 MAX   MED       AVE

             Super Regional Shopping Centre >100,000m2      11.50%           13.52%    13.25%   12.81%
             Regional Shopping Centre: 50-100,000m2         12.50%           14.00%    13.00%   13.13%
             Small Regional Centre: 25-50,000m2             12.75%           14.25%    13.50%   13.41%
Retail

             Community Shopping Centre: 12-25,000m2         12.00%           15.13%    14.00%   13.84%
             Neighbourhood Shopping Centre: 5-12,000m2      13.50%           15.75%    14.50%   14.40%
             Retail Warehouse                               13.25%           15.50%    14.00%   14.32%
             Stand-alone Retail unit                        14.00%           15.75%    14.50%   14.67%
             CBD Johannesburg Office                        15.00%           17.50%    15.75%   15.75%
             CBD Pretoria Office                            15.00%           16.75%    15.25%   15.50%
             CBD Cape Town Office                           13.50%           15.25%    14.25%   14.32%
Office

             CBD Durban Office                              15.00%           17.25%    16.00%   15.90%
             Non CBD Prime Office                           12.75%           15.50%    14.00%   14.06%
             Non CBD Secondary Office                       14.00%           16.50%    15.00%   14.92%
             Non CBD Tertiary Office                        15.00%           17.25%    15.50%   15.69%
             High - Tech Industrial                         13.00%           16.00%    14.88%   14.59%
Industrial

             Light Manufacturing                            13.50%           16.50%    15.00%   15.10%
             Warehousing                                    13.75%           16.25%    15.00%   14.95%
             Standard Units                                 13.25%           17.00%    15.00%   15.27%
             Other                                          14.00%           17.50%    15.00%   15.42%

                                          T: (011) 883 0679 F: (011) 883 0684
                                          Email: marketingmanager@sapoa.org.za                     07
                                          Web: www.sapoa.org.za
MAY 2020
CAP & DISCOUNT RATE REPORT
Market Cap Rate
Property Type MIN MAX MED AVE
Super Regional Shopping Centre >100,000m2 6.50% 8.00% 7.25% 7.25%
Regional Shopping Centre: 50-100,000m2 7.19% 12.50% 7.63% 7.93%
Small Regional Centre: 25-50,000m2 7.50% 11.00% 8.00% 8.17%
Retail
Community Shopping Centre: 12-25,000m2 7.00% 11.00% 8.25% 8.46%
Neighbourhood Shopping Centre: 5-12,000m2 7.50% 11.00% 9.06% 9.07%
Retail Warehouse 8.00% 12.00% 9.50% 9.56%
Stand-alone Retail unit 8.25% 12.00% 10.00% 9.83%
CBD Johannesburg Office 10.00% 12.00% 11.50% 11.31%
CBD Pretoria Office 9.75% 11.00% 10.75% 10.59%
CBD Cape Town Office 8.50% 9.50% 9.00% 8.89%
Office
CBD Durban Office 10.00% 11.50% 10.75% 10.75%
Non CBD Prime Office 7.50% 11.00% 9.00% 9.19%
Non CBD Secondary Office 9.00% 11.00% 10.00% 10.07%
Non CBD Tertiary Office 9.75% 11.50% 11.00% 10.78%
High - Tech Industrial 8.00% 11.00% 10.00% 9.75%
Industrial
Light Manufacturing 8.50% 11.75% 10.22% 10.20%
Warehousing 8.59% 13.00% 10.00% 10.06%
Standard Units 9.00% 14.00% 10.00% 10.35%
Other 9.00% 12.00% 11.63% 11.04%
T: (011) 883 0679 F: (011) 883 0684
Email: marketingmanager@sapoa.org.za 08
Web: www.sapoa.org.zaMAY 2020
CAP & DISCOUNT RATE REPORT
Market Rental Growth
Property Type MIN MAX MED AVE
Super Regional Shopping Centre >100,000m2 4.50% 6.00% 5.00% 5.25%
Regional Shopping Centre: 50-100,000m2 4.50% 6.50% 5.00% 5.32%
Small Regional Centre: 25-50,000m2 4.50% 6.00% 5.00% 5.17%
Retail
Community Shopping Centre: 12-25,000m2 4.25% 7.00% 5.00% 5.37%
Neighbourhood Shopping Centre: 5-12,000m2 4.00% 6.00% 5.00% 5.19%
Retail Warehouse 3.00% 7.00% 5.00% 5.04%
Stand-alone Retail unit 3.00% 8.00% 5.00% 5.17%
CBD Johannesburg Office 3.00% 5.75% 5.00% 4.61%
CBD Pretoria Office 3.00% 6.50% 5.00% 4.93%
CBD Cape Town Office 5.00% 6.00% 5.00% 5.33%
Office
CBD Durban Office 4.50% 5.75% 5.25% 5.25%
Non CBD Prime Office 3.00% 6.25% 4.75% 4.53%
Non CBD Secondary Office 3.00% 5.75% 4.13% 4.32%
Non CBD Tertiary Office 2.00% 5.75% 5.00% 4.48%
High - Tech Industrial 3.00% 6.00% 5.00% 4.66%
Industrial
Light Manufacturing 3.00% 6.00% 5.00% 4.63%
Warehousing 3.00% 6.00% 5.00% 4.62%
Standard Units 3.00% 6.00% 4.50% 4.48%
Other 3.00% 6.00% 5.00% 4.52%
T: (011) 883 0679 F: (011) 883 0684
Email: marketingmanager@sapoa.org.za 09
Web: www.sapoa.org.zaMAY 2020
CAP & DISCOUNT RATE REPORT
Property Expenditure Growth
Property Type MIN MAX MED AVE
Super Regional Shopping Centre >100,000m2 6.00% 8.00% 7.00% 7.22%
Regional Shopping Centre: 50-100,000m2 6.00% 8.00% 7.40% 7.43%
Small Regional Centre: 25-50,000m2 6.00% 8.00% 7.00% 7.21%
Retail
Community Shopping Centre: 12-25,000m2 6.00% 8.00% 7.38% 7.28%
Neighbourhood Shopping Centre: 5-12,000m2 6.00% 8.00% 7.00% 7.10%
Retail Warehouse 6.00% 8.00% 7.13% 7.13%
Stand-alone Retail unit 6.00% 8.00% 7.00% 7.19%
CBD Johannesburg Office 6.00% 8.00% 7.00% 7.03%
CBD Pretoria Office 6.00% 8.00% 7.30% 7.22%
CBD Cape Town Office 6.00% 7.60% 6.75% 6.77%
Office
CBD Durban Office 6.00% 7.35% 7.00% 6.80%
Non CBD Prime Office 6.00% 8.00% 7.00% 7.09%
Non CBD Secondary Office 6.00% 8.00% 7.00% 7.13%
Non CBD Tertiary Office 6.00% 7.35% 7.00% 6.80%
High - Tech Industrial 6.00% 8.00% 7.00% 7.20%
Industrial
Light Manufacturing 6.00% 8.00% 7.25% 7.16%
Warehousing 6.00% 8.00% 7.00% 7.01%
Standard Units 6.00% 8.00% 7.00% 7.03%
Other 6.00% 8.00% 7.25% 7.26%
T: (011) 883 0679 F: (011) 883 0684
Email: marketingmanager@sapoa.org.za 10
Web: www.sapoa.org.zaMAY 2020
CAP & DISCOUNT RATE REPORT
Exit Cap Rate
Property Type MIN MAX MED AVE
Super Regional Shopping Centre >100,000m2 7.00% 8.50% 7.75% 7.65%
Regional Shopping Centre: 50-100,000m2 7.50% 13.00% 8.25% 8.41%
Small Regional Centre: 25-50,000m2 7.75% 11.50% 8.50% 8.62%
Retail
Community Shopping Centre: 12-25,000m2 7.50% 11.50% 8.50% 8.94%
Neighbourhood Shopping Centre: 5-12,000m2 8.00% 11.50% 9.19% 9.47%
Retail Warehouse 7.25% 12.50% 10.50% 10.16%
Stand-alone Retail unit 8.50% 12.50% 10.50% 10.45%
CBD Johannesburg Office 10.50% 12.50% 12.00% 11.89%
CBD Pretoria Office 10.25% 11.75% 11.50% 11.19%
CBD Cape Town Office 9.00% 10.25% 9.50% 9.50%
Office
CBD Durban Office 10.00% 12.25% 10.75% 11.08%
Non CBD Prime Office 8.00% 11.50% 10.00% 9.62%
Non CBD Secondary Office 9.50% 11.75% 11.00% 10.67%
Non CBD Tertiary Office 10.25% 12.50% 11.25% 11.38%
High - Tech Industrial 8.50% 12.00% 10.50% 10.32%
Industrial
Light Manufacturing 9.00% 12.25% 10.97% 10.78%
Warehousing 9.09% 13.50% 10.25% 10.65%
Standard Units 9.50% 14.50% 10.75% 10.98%
Other 9.50% 13.00% 12.75% 12.14%
T: (011) 883 0679 F: (011) 883 0684
Email: marketingmanager@sapoa.org.za 11
Web: www.sapoa.org.zaMAY 2020
CAP & DISCOUNT RATE REPORT
Number of Transactions
Property Type TOTAL
Super Regional Shopping Centre >100,000m2 1
Regional Shopping Centre: 50-100,000m2 2
Small Regional Centre: 25-50,000m2 3
Retail
Community Shopping Centre: 12-25,000m2 1
Neighbourhood Shopping Centre: 5-12,000m2 4
Retail Warehouse 3
Stand-alone Retail unit 2
CBD Johannesburg Office 1
CBD Pretoria Office
CBD Cape Town Office 4
Office
CBD Durban Office
Non CBD Prime Office 25
Non CBD Secondary Office 11
Non CBD Tertiary Office 2
High - Tech Industrial 1
Industrial
Light Manufacturing 1
Warehousing 14
Standard Units 17
Other 1
T: (011) 883 0679 F: (011) 883 0684
Email: marketingmanager@sapoa.org.za 12
Web: www.sapoa.org.zaMAY 2020
CAP & DISCOUNT RATE REPORT
ABOUT MSCI
For more than 40 years, MSCIÕs research-based indexes and analytics have helped the
worldÕs leading investors build and manage better portfolios.Ê
Clients rely on our offerings for deeper insights into the drivers of performance and risk
in their portfolios, broad asset class coverage and innovative research.
Our line of products and services includes indexes, analytical models, data, real estate
benchmarks and ESG research.Ê
MSCI serves 98 of the top 100 largest money managers, according to the most
recent P&I ranking.
For more information, visit us at www.msci.com
Report compiled by:
T: (011) 883 0679 F: (011) 883 0684
Email: marketingmanager@sapoa.org.za 13
Web: www.sapoa.org.zaMAY 2020
CAP & DISCOUNT RATE REPORT
NOTICE AND DISCLAIMER
This document and all of the information contained in it, including without limitation all text, data, graphs, charts (collectively, the
ÒInformationÓ) is the property of MSCI Inc. or its subsidiaries (collectively, ÒMSCIÓ), or MSCIÕs licensors, direct or indirect suppliers or any
third party involved in making or compiling any Information (collectively, with MSCI, the ÒInformation ProvidersÓ) and is provided for
informational purposes only.Ê The Information may not be modified, reverse-engineered, reproduced or redisseminated in whole or in
part without prior written permission from MSCI.
The Information may not be used to create derivative works or to verify or correct other data or information.ÊÊ For example (but without
limitation), the Information may not be used to create indexes, databases, risk models, analytics, software, or in connection with the
issuing, offering, sponsoring, managing or marketing of any securities, portfolios, financial products or other investment vehicles utilizing
or based on, linked to, tracking or otherwise derived from the Information or any other MSCI data, information, products or services.Ê
The user of the Information assumes the entire risk of any use it may make or permit to be made of the Information.Ê NONE OF THE
INFORMATION PROVIDERS MAKES ANY EXPRESS OR IMPLIED WARRANTIES OR REPRESENTATIONS WITH RESPECT TO
THE INFORMATION (OR THE RESULTS TO BE OBTAINED BY THE USE THEREOF), AND TO THE MAXIMUM EXTENT PERMITTED
BY APPLICABLE LAW, EACH INFORMATION PROVIDER EXPRESSLY DISCLAIMS ALL IMPLIED WARRANTIES (INCLUDING,
WITHOUT LIMITATION, ANY IMPLIED WARRANTIES OF ORIGINALITY, ACCURACY, TIMELINESS, NON-INFRINGEMENT,
COMPLETENESS, MERCHANTABILITY AND FITNESS FOR A PARTICULAR PURPOSE) WITH RESPECT TO ANY OF THE
INFORMATION.
Without limiting any of the foregoing and to the maximum extent permitted by applicable law, in no event shall any Information Provider
have any liability regarding any of the Information for any direct, indirect, special, punitive, consequential (including lost profits) or any
other damages even if notified of the possibility of such damages. The foregoing shall not exclude or limit any liability that may not by
applicable law be excluded or limited, including without limitation (as applicable), any liability for death or personal injury to the extent
that such injury results from the negligence or willful default of itself, its servants, agents or sub-contractors.Ê
Information containing any historical information, data or analysis should not be taken as an indication or guarantee of any future
performance, analysis, forecast or prediction.Ê Past performance does not guarantee future results.Ê
The Information should not be relied on and is not a substitute for the skill, judgment and experience of the user, its management,
employees, advisors and/or clients when making investment and other business decisions.Ê All Information is impersonal and not tailored
to the needs of any person, entity or group of persons.
None of the Information constitutes an offer to sell (or a solicitation of an offer to buy), any security, financial product or other investment
vehicle or any trading strategy.
It is not possible to invest directly in an index.Ê Exposure to an asset class or trading strategy or other category represented by an index
is only available through third party investable instruments (if any) based on that index.ÊÊ MSCI does not issue, sponsor, endorse, market,
offer, review or otherwise express any opinion regarding any fund, ETF, derivative or other security, investment, financial product or
trading strategy that is based on, linked to or seeks to provide an investment return related to the performance of any MSCI index
(collectively, ÒIndex Linked InvestmentsÓ). MSCI makes no assurance that any Index Linked Investments will accurately track index
performance or provide positive investment returns.Ê MSCI Inc. is not an investment adviser or fiduciary and MSCI makes no representation
regarding the advisability of investing in any Index Linked Investments.
Index returns do not represent the results of actual trading of investible assets/securities. MSCI maintains and calculates indexes, but
does not manage actual assets. Index returns do not reflect payment of any sales charges or fees an investor may pay to purchase the
securities underlying the index or Index Linked Investments. The imposition of these fees and charges would cause the performance of
an Index Linked Investment to be different than the MSCI index performance.
The Information may contain back tested data.Ê Back-tested performance is not actual performance, but is hypothetical.Ê There are
frequently material differences between back tested performance results and actual results subsequently achieved by any investment
strategy.Ê
T: (011) 883 0679 F: (011) 883 0684
Email: marketingmanager@sapoa.org.za 14
Web: www.sapoa.org.zaMAY 2020
CAP & DISCOUNT RATE REPORT
NOTICE AND DISCLAIMER...continued
Constituents of MSCI equity indexes are listed companies, which are included in or excluded from the indexes according to the application
of the relevant index methodologies. Accordingly, constituents in MSCI equity indexes may include MSCI Inc., clients of MSCI or suppliers
to MSCI.Ê Inclusion of a security within an MSCI index is not a recommendation by MSCI to buy, sell, or hold such security, nor is it
considered to be investment advice.
Data and information produced by various affiliates of MSCI Inc., including MSCI ESG Research Inc. and Barra LLC, may be used in
calculating certain MSCI indexes.Ê More information can be found in the relevant index methodologies on www.msci.com.
MSCI receives compensation in connection with licensing its indexes to third parties.Ê MSCI Inc.Õs revenue includes fees based on assets
in Index Linked Investments. Information can be found in MSCI Inc.Õs company filings on the Investor Relations section of www.msci.com.
MSCI ESG Research Inc. is a Registered Investment Adviser under the Investment Advisers Act of 1940 and a subsidiary of MSCI Inc.Ê
Except with respect to any applicable products or services from MSCI ESG Research, neither MSCI nor any of its products or services
recommends, endorses, approves or otherwise expresses any opinion regarding any issuer, securities, financial products or instruments
or trading strategies and MSCIÕs products or services are not intended to constitute investment advice or a recommendation to make
(or refrain from making) any kind of investment decision and may not be relied on as such. Issuers mentioned or included in any MSCI
ESG Research materials may include MSCI Inc., clients of MSCI or suppliers to MSCI, and may also purchase research or other products
or services from MSCI ESG Research.Ê MSCI ESG Research materials, including materials utilized in any MSCI ESG Indexes or other
products, have not been submitted to, nor received approval from, the United States Securities and Exchange Commission or any other
regulatory body.
Any use of or access to products, services or information of MSCI requires a license from MSCI.Ê MSCI, Barra, RiskMetrics, IPD, FEA,
InvestorForce, and other MSCI brands and product names are the trademarks, service marks, or registered trademarks of MSCI or its
subsidiaries in the United States and other jurisdictions.Ê The Global Industry Classification Standard (GICS) was developed by and is
the exclusive property of MSCI and Standard & PoorÕs.Ê ÒGlobal Industry Classification Standard (GICS)Ó is a service mark of MSCI and
Standard & PoorÕs.
T: (011) 883 0679 F: (011) 883 0684
Email: marketingmanager@sapoa.org.za 15
Web: www.sapoa.org.zaSAPOA - South African Property Owners Association T: (011) 883 0679 - F: (011) 883 0684 Email: marketingmanager@sapoa.org.za Web: www.sapoa.org.za Physical: Paddock View, Hunt's End Office Park, 36 Wierda Road West, Wierda Valley, Sandton Postal: P O Box 78544, Sandton 2146 Report compiled by:
You can also read