Frasers Centrepoint Trust - Presentation at SGX-Julius Baer Luncheon Event 20 March 2019
←
→
Page content transcription
If your browser does not render page correctly, please read the page content below
Frasers Centrepoint Trust
Presentation at SGX-Julius Baer Luncheon Event

20 March 2019

Important notice
Important Notice
Certain statements in this Presentation constitute “forward-looking statements”, including forward-looking financial information. Such forward-
looking statement and financial information involve known and unknown risks, uncertainties and other factors which may cause the actual results,
performance or achievements of FCT or the Manager, or industry results, to be materially different from any future results, performance or
achievements expressed or implied by such forward-looking statements and financial information. Such forward-looking statements and financial
information are based on numerous assumptions regarding the Manager’s present and future business strategies and the environment in which
FCT or the Manager will operate in the future. Because these statements and financial information reflect the Manager’s current views concerning
future events, these statements and financial information necessarily involve risks, uncertainties and assumptions. Actual future performance could
differ materially from these forward-looking statements and financial information.
The Manager expressly disclaims any obligation or undertaking to release publicly any updates or revisions to any forward-looking statement or
financial information contained in this Presentation to reflect any change in the Manager’s expectations with regard thereto or any change in events,
conditions or circumstances on which any such statement or information is based, subject to compliance with all applicable laws and regulations
and/or the rules of the SGX-ST and/or any other regulatory or supervisory body or agency. The value of Units in FCT and the income derived from
them may fall as well as rise. The Units in FCT are not obligations of, deposits in, or guaranteed by, the Manager or any of their affiliates. An
investment in the Units in FCT is subject to investment risks, including the possible loss of the principal amount invested. Unitholders of FCT
should note that they have no right to request the Manager to redeem their Units while the Units are listed. It is intended that Unitholders of FCT
may only deal in their Units through trading on the SGX-ST. Listing of the Units on the SGX-ST does not guarantee a liquid market for the Units.
This Presentation contains certain information with respect to the trade sectors of FCT’s tenants. The Manager has determined the trade sectors in
which FCT’s tenants are primarily involved based on the Manager’s general understanding of the business activities conducted by such tenants.
The Manager’s knowledge of the business activities of FCT’s tenants is necessarily limited and such tenants may conduct business activities that
are in addition to, or different from, those shown herein.
This Presentation is for information only and does not constitute an invitation or offer to acquire, purchase or subscribe for any securities of FCT.
The past performance of FCT and the Manager is not necessarily indicative of the future performance of FCT and the Manager.
This Presentation includes market and industry data and forecast that have been obtained from internal survey, reports and studies, where
appropriate, as well as market research, publicly available information and industry publications. Industry publications, surveys and forecasts
generally state that the information they contain has been obtained from sources believed to be reliable, but there can be no assurance as to the
accuracy or completeness of such included information. While the Manager has taken reasonable steps to ensure that the information is extracted
accurately and in its proper context, the Manager has not independently verified any of the data from third party sources or ascertained the
underlying economic assumptions relied upon therein.
This advertisement has not been reviewed by the Monetary Authority of Singapore.
2
Overview
Frasers Centrepoint Trust (FCT)
Six suburban retail properties located in Singapore’s
densely-populated residential areas, with excellent Market Cap of
footfall catchment and connection to public transport S$2.1 billion1
infrastructure
Bloomberg: FCT SP
Reuters: J69U.SI
Tenancy-mix focused on necessity and convenience SGX: J69U
shopping; F&B and services which remain resilient
through economic cycles
Strong track record: 12 consecutive years of
Distribution per Unit (DPU) growth since IPO in 2006 Total appraised
value of S$2.75
Poised for Growth: Opportunities to acquire retail billion2
properties from Sponsor and 3rd parties; AEI and
organic growth from current properties
Sponsored by Frasers Property Limited
Total net lettable
area of 1.1
million square
feet
1. Based on closing price of $2.29 on 28 February 2019
2. As at 30 September 2018
3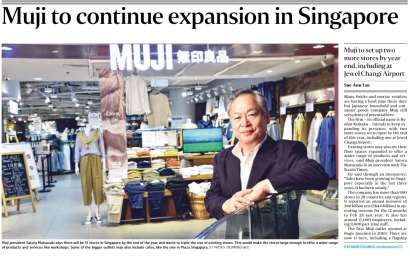
Overview
Portfolio of six suburban retail properties
Well-located suburban retail properties that enjoy good connectivity to public transport,
high footfall and high occupancy
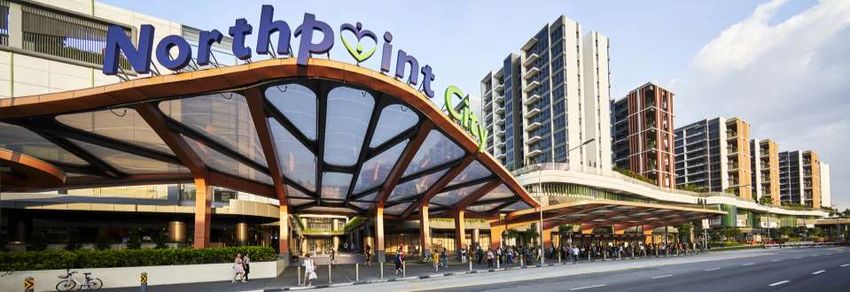
Anchorpoint YewTee Point Causeway Point Northpoint City Bedok Point Changi City Point
North Wing1
Legend
Existing MRT Lines
Singapore
Future MRT Lines
1. Also includes Yishun 10 retail podium located next to Northpoint City North Wing | Map source: URA Master Plan, Illustration not to scale 4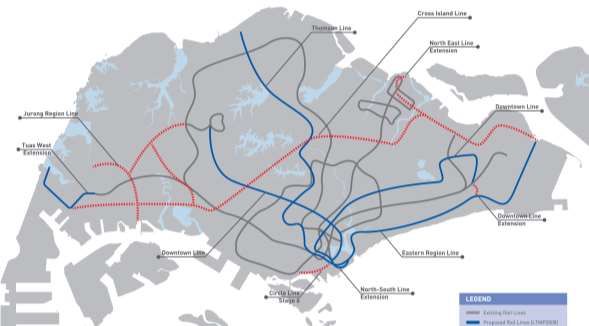
Overview

FCT malls are well-connected with public transport nodes
     Northpoint City, located in Yishun Central                    Linkway to the Expo MRT Station of Downtown Line
                                                                   from basement of Changi City Point

                                   North Park Residences
    Northpoint City North Wing

                                              Yishun MRT Station
     Through-block link at Causeway Point leading to               YewTee MRT Station next to YewTee Point
     Woodlands MRT station and Bus Interchange

                                                                                                                      5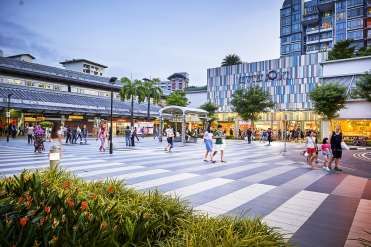
Consistent performance

                                                        Revenue and Net Property Income (S$ million)
                                                            Net Property Income                 Gross Revenue

                                                                                                                                                    Revenue +6.5% yoy
                                                                                                                                                        NPI + 5.9% yoy

                                                                                                                    189.2                                   193.3
                                                                                                                                    183.8       181.6
                                                                                                     168.8
                                                                                      158.0
                                                                      147.2
                                                                                                             131.0           129.8          129.6       137.2
                                                       117.9                                  118.1
                                       114.7                                  111.6
                                                               104.4
         84.7            86.6 80.1               82.6
  56.6            59.9

     FY2008         FY2009         FY2010          FY2011         FY2012          FY2013         FY2014         FY2015         FY2016*       FY2017*      FY2018

* Revenue and Net Property Income in FY2016 and FY2017 were affected by the asset enhancement works at Northpoint City North Wing

                                                                                                                                                                    6
Steady DPU growth
12 consecutive years of DPU growth

                                                            Distribution per Unit (S cents)

                                                                                                                11.764   11.9   12.015
                                                                                                       11.608
                                                                                      10.93   11.187
                                                                              10.01

                                                             8.2       8.32
                                 7.29          7.51
                    6.55
      6.03

    FY2006 FY2007 FY2008 FY2009 FY2010 FY2011 FY2012 FY2013 FY2014 FY2015 FY2016 FY2017 FY2018
     (IPO)*

* Annualised DPU for the period 5 Jul 06 (IPO) to 30 September 2006.

                                                                                                                                         7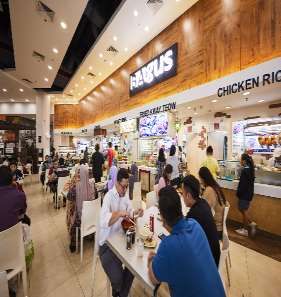
Overview

Strong financial position

                                                                                          Key financial indicators
Gearing level of SREIT by             sector1                                             as at 31 Dec 2018

                                                                                          Gearing level1                                            28.8%
  36.4% 36.2%                                 Overall average
                       35.6% 35.6%                                   FCT’s gearing        Interest Cover2                                        5.92 times
                                                  34.6%
                                                                      level is one of
                                                                        the lowest        Weighted average debt
                                                                                                                                                  1.8 years
                                                                     among SREITs         maturity
                                             31.8%
                                                        30.8%                             Percentage of borrowings on
                                                                                          fixed rates or hedged via                                  54%3
                                                                   28.8%                  interest rate swaps
                                                                                          Unencumbered assets as %
                                                                                                                                                    85.8%
                                                                                          of total assets
                                                                                          All-in average cost of
                                                                                                                                                     2.7%
                                                                                          borrowings
                                                                                          Corporate credit rating
                                                                                          •  S&P                                              BBB+ (Stable)
                                                                                          •  Moody’s                                          Baa1 (Stable)

                                                                                        1. The ratio of total outstanding borrowings over total assets as at stated
                                                                                           balance sheet date
                                                                                        2. Earnings before interest and tax (EBIT) divided by interest expense

1 Source: OCBC Investment Research Weekly S-REITs Tracker, 11 March 2019

                                                                                                                                                                      8
Overview

Clear growth strategies
                                                                         Future

                Northpoint 2     Bedok    Changi City Yishun 10 Retail                   Northpoint South Wing
                YewTee Point     Point      Point         Podium                              (Singapore)

  Acquisition      2010           2011        2014         2016
                                                                                         Waterway Point (33.3%)
   Growth                                                                                     (Singapore)
                                                                                        Acquisition opportunities
                                                                                        of 3rd party assets in
                                                                                        S’pore and overseas

                                                                   Northpoint City     Causeway Point
 Enhancement    Anchorpoint      Northpoint    Causeway Point       North Wing              UPL*
                  (2008)           (2010)          (2012)              (2017)              (2019)
   Growth
    (AEI)

                                                                                     *UPL: Underground Pedestrian Link

    Organic
    Growth
                 Rental Growth           High Occupancy              High Footfall

                                                                                                                    9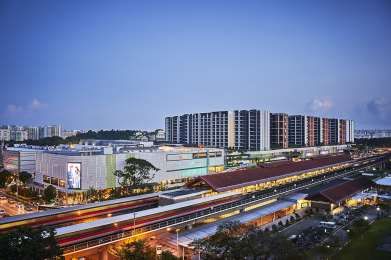
Some misconceptions in Retail &
Retail REITS
Some Misconceptions in Retail & Retail REITs

1.   The brick-and-mortar retail malls are dying due to e-commerce

2.   Rising interest rates should be mitigated by aggressive hedging

3.   Retail mall as an asset will eventually lose its value
Misconception 1: Brick-and-mortar retail malls are dying
due to e-commerce
Decline for some brick-and-mortar malls
due to other reasons:
▪ Competition / Oversupply
▪ Economy slow down
▪ Changing consumer taste and lifestyle
Impression amplified by “personal
experience”
Retail business is location-biased and
country-specific:
▪ Suburban malls v City malls
▪ Singapore / Asia v US & European
12WW retail sales continue to grow even as e-commerce grows
Brick-and-mortar retail sales still account for more than 80% of the sales
Worldwide Retail Sales ($ trillion) & e-commerce penetration (%)
2016-2021
27,874
26,677
25,204
23,882
22,588
21,453
17.5%
15.5%
13.7%
10.2% 11.9%
8.6%
2016 2017 2018 2019 2020 2021
Total Retail Sales ($T) e-commerce as % of total retail sales
Source: www.emarketer.com, Jan 2018
13E-commerce is
Retail sales remain resilient
                                 Retail Sales Index (excluding motor vehicles) at Current Prices
                                                          (2017 = 100)
  120.0

  115.0

  110.0

  105.0

  100.0

   95.0

   90.0
                 Jan          Feb          Mar          Apr         May          Jun          Jul          Aug         Sep          Oct          Nov          Dec          Jan
                                                                                       2018                                                                               2019

 Seasonal Adjustment: Seasonal effects are observed in the RSI as there are usually intra-year periodic variations that repeat during the fixed period of time every year. To
 better reflect the underlying trends of the monthly sales, the RSI index is seasonally adjusted to remove the seasonal effects.
 The RSI covers retail sales of: (a) (multi-channel) retailers in Singapore that sell via both physical stores and online/ecommerce sites; (b) retailers in Singapore that sell via
 physical stores only; and (c) retailers in Singapore that sell mainly via online/e-commerce sites
 Source: Department of Statistics Singapore, March 2019

                                                                                                                                                                                      15
Prime Rent Up
Q4 18 Q - o- Q Y- o- Y
Sub- market
$ psf/ mth Prime Rent Change Change
$40.00 Orchard Road $31.70 0.0% 1.3%
$38.00 Suburban $29.15 0.0% 1.2%
$36.00
$34.00 Q1 2008
29%
$32.00
$30.00
$28.00
Q4 2018
For the whole of 2018, average islandwide 8.7%
$26.00
prime rents as tracked by CBRE Research
$24.00 increased by 1.2% y-o-y on the back of a
gradual increase in retail sales and tourism
$22.00
growth. – CBRE, Q4 2018
$20.00
Q 1 2008
Q 2 2008
Q 3 2008
Q 4 2008
Q 1 2011
Q 2 2011
Q 3 2011
Q 4 2011
Q 1 2012
Q 2 2012
Q 3 2012
Q 4 2014
Q 1 2015
Q 2 2015
Q 3 2015
Q 4 2015
Q 1 2016
Q 2 2016
Q 3 2018
Q 4 2018
Q 1 2009
Q 2 2009
Q 3 2009
Q 4 2009
Q 1 2010
Q 2 2010
Q 3 2010
Q 4 2010
Q 4 2012
Q 1 2013
Q 2 2013
Q 3 2013
Q 4 2013
Q 1 2014
Q 2 2014
Q 3 2014
Q 3 2016
Q 4 2016
Q 1 2017
Q 2 2017
Q 3 2017
Q 4 2017
Q 1 2018
Q 2 2018
Prime Orchard Prime Suburban
Source: CBRE, Singapore Real Estate Market Update, 4Q2018
16Convergence of online and brick-and-mortar;
emphasis on retail as an experience and
Habitat by Honest Bee
“The future of shopping may not be a
Straits Times, 11 March 2019
binary battle between online sites
“In a world of online shopping, it is more and bricks-and-mortar shops, but an
important than ever that Muji stores provide amalgam of the two”
an experience for consumers rather than just Straits Times, 21 October 2018
a routine purchase”
Satoru Matsuzaki, Muji President
17Overview
Suburban malls remain very much relevant
They offer convenience, wide range of options, delightful experience –
because experience matters
Necessity & convenience shopping Fun for the family Delightful shopper experiences
Everyday dining Essential services Social and family dining
18Misconception 2: Rising interest rates should be mitigated
by aggressive hedging
Generally true for all REITs and is also true for most businesses except those on the
capital-provider side (banks and lenders)
The borrowing cost also depends on other factors:
❑ Base rate used (e.g. SOR: which also depends on the US/SGD exchange rate)
❑ Proportion of floating v fixed interest rate
❑ Bank’s Spread and the upfront fees
Will rising interest rates affect the valuations of the property portfolio?
When everyone agrees that interest rate is going to rise, should one hedge to the
max?
19Interest rate hikes
The Fed has raised interest rates 9 times since 2015, fed fund rate is up 200 bps
since December 2015, but rate of increase for local borrowing cost is slower.
Cumulative Increase in interest rate / cost of borrowing
US Fed Fund Rate FCT Avg Cost of Borrowing 3 month SIBOR
2.50%
2.00%
1.50%
1.00%
0.50%
0.00%
-0.50%
Dec-15 Mar-16 Jun-16 Sep-16 Dec-16 Mar-17 Jun-17 Sep-17 Dec-17 Mar-18 Jun-18 Sep-18 Dec-18
Source: Bloomberg, FCT
20When everyone agrees that interest rate is going to rise,
should one hedge to the max?
Comparison of interest costs between
fully hedged and unhedged borrowings
2.5%
2.0%
Average differential
1.5% about 75bps
1.0%
0.5%
0.0%
2014 2015 2016 2017 2018
Unhedged Fully hedged
21Misconception 3: Retail mall as an asset will eventually
lose its value
Value of retail properties continue to increase over the years
Capital Values of 3 FCT malls
(Causeway Point + Northpoint City North Wing + Anchorpoint)
S$ per square foot of net lettable area
3,500
3,000
2,500
2,000
$/per sq foot of NLA
1,500
1,000
500
-
FY2010 FY2011 FY2012 FY2013 FY2014 FY2015 FY2016 FY2017 FY2018
Values as at 30 September of each year (FCT’s financial year end)
22Misconception 3: Retail mall as an asset will eventually
lose its value
▪ The retail properties on a per square foot basis continue to increase in value over
the years
Retail Property Capital Value
S$ per sq foot of NLA (Causeway Point + Northpoint City North Wing + Anchorpoint)
3,500
2,876 2,971
3,000 2,695
2,496 2,595
2,391
2,500
2,134
1,972
2,000 1,805
1,500
1,000
500
-
2010 2011 2012 2013 2014 2015 2016 2017 2018
Capital Value (S$m) $/per sq foot of NLA
23The impact on capitalisation rates of properties
While interest rate has increased, the valuation cap rates for retail properties
have remained relatively stable and even compressed in recent years.
Valuation Cap rates for 3 FCT malls
6.50
Valuation Cap rates (%)
6.00
5.50
5.00
4.50
4.00
2010 2011 2012 2013 2014 2015 2016 2017 2018
Causeway Point Northpoint City North Wing Anchorpoint
The cap rates as used by independent valuers, as at 30 September of each year (FCT’s financial year end)
24Limited upcoming new retail supply after 2019
NLA (mil sq ft) Composition of supply from 2019 to 2022:
3.0
Rest of
Orchard
Central
2.5 6%
4%
5-Yr Avg: 1.66 mil
2.0
Downtown
Core
Outside 30%
1.5 Central
Region
1 . 10 mil 32%
1.0
Fringe
28%
0.5 0 . 35 mil
0 . 14 mil
0 . 10 mil
0.0
2014 2015 2016 2017 2018 2019 2020 2021 2022
Completed O rchard Downtown Core Rest of Central Fringe O utside Central Region
Note: Numbers include additional space carved out during AEI and if the development is closed entirely the total new NLA of enhanced asset is included. Future
supply tracks projects with NLA of 20,000 sf and more.
Source: CBRE Research
Source: CBRE, Singapore Real Estate Market Update, 4Q2018
25Recap
1. Brick-and-mortar malls not dying but evolving with e-commerce
2. Impact of rising interest rates on
• Impact on REIT share price – low correlation with interest rate trend
• Impact on valuation cap rates – no apparent correlation for retail properties
• Should you hedge to the max?
3. Value of retail properties remain resilientYou can also read