Zeb.market.flash Q4 2020 - BankingHub
←
→
Page content transcription
If your browser does not render page correctly, please read the page content below

I s s•u e 3 5 | J a n u a r y 1 2 , 2 0 2 1

zeb.market.flash Q4 2020
The banking sector between hope and fear

   Key topics
   I. State of the banking industry                              • In Q3 2020, global banks’ profitability improved
   • The global banking sector benefited most from positive        significantly as risk provisions returned to pre-
     news about COVID-19 vaccines and a new U.S.                   pandemic levels. However, the real test for banks’
     administration which boosted capital markets in the           financial resilience will come in the first half of 2021.
     final quarter of 2020.
   • In Q4, market capitalization of the global banking sector   III. European banks’ capital market performance –
     jumped by +17.6% and TSR of global top 100 banks            a valuation conundrum?
     outperformed the market significantly – +25% qoq, the       • Although global banks’ valuations have generally
     strongest value across all industry sectors.                  been low since the global financial crisis, especially
                                                                   European banks seem to be traded at a significant
   II. Economic environment and key banking drivers                discount.
   • Western Europe has been hit hard by the second wave of      • Some European banks are, however, able to show a
     coronavirus cases and further lockdowns in several            relatively adequate capital market valuation and
     European countries will delay the economic recovery.          performance.
   • ECB expanded its monetary stimulus program PEPP in          • The differences can be explained by analyzing
     December 2020 by a further EUR 500 bn, keeping the            fundamental bank KPIs focusing on profitability, risk
     euro area yield curve on an ultra-low and flat level.         and growth – which has also been evident in the
                                                                   current crisis period.
zeb.market.flash
                                                                                                                                                                                             Issue 35
                                                                                                                                                                                  January 12, 2021

 I. State of the banking industry
 After a long time marked by increasing infection rates, political and economic turmoil, the final quarter of 2020 brought some
 long-awaited positive news. The availability of effective COVID-19 vaccines as well as increasing clarity about a new U.S.
 administration and a Brexit deal reduced uncertainty and boosted capital markets. Global banks benefited most from these
 developments and market capitalization surged by +17.6% qoq but remains below last year’s level (-18.9% yoy). The TSR of global
 top 100 banks outperformed the market and with +25.0% qoq (-5.9% yoy) achieved the strongest value across all industries.

       Market capitalization of the banking sector (eoq, in EUR tr)1)                                           P/B ratio of global top 100 banks and MSCI World2)

                                                                        -18.9%                                  3.0
                                                                                           +17.6%
                                                                                                                2.5
                     7.3                     7.6
       7.1                       7.2
                                                                                                                2.0
                                                                                                    6.1
                                                   5.6                 5.3
             5.2           5.2         5.3                                           5.2
                                                         4.9                                              4.7   1.5
                                                               3.9           4.1           3.8
                                                                                                                1.0

                                                                                                                0.5

                                                                                                                0.0
        Q1 19        Q2 19       Q3 19       Q4 19       Q1 20         Q2 20         Q3 20          Q4 20               Q1 19   Q2 19   Q3 19   Q4 19   Q1 20   Q2 20      Q3 20     Q4 20
                                    All banks     Global top 100                                                                    Western Europe                   United States
                           ∆MSCI World: +9.6% (Q4 20, quarter-over-quarter)
                                                                                                                                    BRICS                            MSCI World

       TSR of industry sectors worldwide (10/2020–12/2020, in %)3)                                              Top/lowest TSR performance among Western European
                                                                                                                banks (10/2020–12/2020, in %)

                    MSCI World                                          14.1                                      Top performers                           Country                    TSR
      Global top 100 banks                                                                          25.0          BBVA                                      Spain                     70.1

               Basic materials                                                               22.0                 BANCO SANTANDER                           Spain                     65.6

                     Industrials                                                                                  NATWEST GROUP                             United Kingdom            58.1
                                                                                   17.1
                                                                                                                  SOCIETE GENERALE                          France                    50.4
         Cons. discretionary                                                  15.9
                                                                                                                  BARCLAYS                                  United Kingdom            50.3
                    Technology                                                15.8
                        Utilities                                      13.4
                                                                                                                  Low performers                           Country                    TSR
                           Energy                                     12.9
                                                                                                                  NORDEA BANK                               Sweden                    2.9
       Telecommunications                                             12.4
                                                                                                                  SEB                                       Sweden                    6.1
                     Real estate                                9.9                                               UNICREDIT                                 Italy                     8.6
                   Cons. staples                           8.8                                                    SVENSKA HANDELSBANKEN                     Sweden                    9.7
                    Health care                            8.6                                                    CAIXABANK                                 Spain                     15.9

     1) All banks worldwide according to Bloomberg classification. Global top 100 banks contain largest banks by market cap. on December 31, 2019. Figures are aggre-
     gated in EUR, without adjustments for foreign currency effects; 2) P/B ratio: price/book ratio, calculation as harmonic mean; Western Europe: euro area, Denmark,
     Norway, Sweden, Switzerland, UK. BRICS: Brazil, Russia, India, China, South Africa; 3) Total shareholder return (TSR) of industry sectors other than banking based on
     global sector total return indices. Avg. TSR of global top 100 banks weighted by the market capitalization of each bank; Source: Bloomberg, Thomson Reuters
     Datastream, zeb.research

 • After the collapse in Q1, global top 100 banks’ market capitalization recovered in Q4 2020 and jumped by +21.4% qoq.
      However, market cap of global top 100 banks is still far below the peak value in Q4 2019 (-17.2% yoy) while the overall market
      managed to fully digest the losses from the first three quarters (MSCI World: +9.6% qoq and +5.6% yoy).
 • Banks’ average P/B ratios increased significantly across most regions. U.S. banks’ ratio rose by 0.31x, once again above the
      hurdle of 1.00x, but Western European banks’ P/B ratio improved relatively moderately by 0.13x to just 0.56x on average.
 • Despite a strong TSR performance in Q4, for the full year 2020 the banking sector lost shareholder value while other industries
      fully recovered over the year. Especially Western European banks showed a negative average TSR in 2020 of -21.2% yoy (U.S.:
      -5.1% yoy, BRICS: -3.0% yoy, MSCI World: +16.5% yoy).
 • After being among the worst-performing European banks in the last quarter, the two Spanish banks Banco Santander and
      BBVA achieved a disproportionately high rebound and the best TSR performance among European but also global top 100
      banks. The announcement of BBVA to sell its U.S. subsidiary additionally boosted the stock price to +70.1% qoq in total.

 2
zeb.market.flash
                                                                                                                                                                                Issue 35
                                                                                                                                                                 January 12, 2021

 II. Economic environment and key banking drivers
 Europe has been hit hard by the second wave of coronavirus cases and additional strict lockdowns in several Western European
 countries will delay the economic recovery. While GDP growth in the U.S. and BRICS countries is expected to continuously
 improve, Western European countries’ GDP growth is expected to remain clearly negative in Q4 2020 and even Q1 2021. However,
 the rollout of the COVID-19 vaccine increases the hope for a corresponding stronger rebound in European growth in Q2 21 and
 going forward.

       GDP growth (real GDP, year-over-year rates, in %)1)                                   Inflation rate (CPI, year-over-year rates, in %)1)

      20.0                                                                                  6.0

      15.0                                                                                  5.0
      10.0
                                                                                            4.0
       5.0
                                                                                            3.0
       0.0
                                                                                            2.0
      -5.0
                                                                                            1.0
     -10.0

     -15.0                                                                                  0.0

     -20.0                                                                                 -1.0
               Q4 19 Q1 20 Q2 20 Q3 20 Q4 20f Q1 21f Q2 21f Q3 21f Q4 21f                         Q4 19 Q1 20 Q2 20 Q3 20 Q4 20f Q1 21f Q2 21f Q3 21f Q4 21f
                              Germany                       Western Europe                                         Germany                           Western Europe
                              United States                 BRICS                                                  United States                     BRICS

       Money and capital market rates (in %)                                                 FX rates (EUR/CHF, EUR/GBP, EUR/USD)

     1.5                                                                                   1.3

     1.0                                                                                   1.2

     0.5                                                                                   1.1

     0.0                                                                                   1.0

     -0.5                                                                                  0.9

     -1.0                                                                                  0.8
            1D 3M 6M1Y   2Y      3Y      4Y     5Y                                 10Y       Jan 19 Apr 19      Jul 19   Oct 19    Jan 20   Apr 20   Jul 20   Oct 20   Jan 21
                           EURIBOR, 12/2020                 EURIBOR, 09/2020
                                                                                                             EUR/CHF               EUR/GBP             EUR/USD
                           USD LIBOR, 12/2020               USD LIBOR, 09/2020

     1) BRICS: Brazil, Russia, India, China, South Africa; forecasts: average of country-specific forecasts; Source: Bloomberg, Thomson Reuters Datastream, zeb.research

 • The Western European inflation rate continued the deflationary trend, reaching its low point (-0.1%) in the final quarter of
      2020 but slowly picking up again in 2021. Consumer prices in Germany further declined and will remain on deflationary
      levels in Q4, mainly driven by lower demand and the temporary reduction in VAT rates.
 • To limit the economic impact from the second COVID-19 wave, the European Central Bank expanded its monetary stimulus
      program PEPP (Pandemic Emergency Purchase Program) in December 2020 by a further EUR 500 bn, keeping the euro area
      yield curve on an ultra-low and flat level.
 • The U.S. yield curve steepened slightly compared to the previous quarter after the U.S. Fed decided to maintain benchmark
      rates near zero as well as its current bond buying program but without extending the duration of these bonds.
 • Low U.S. yields in line with significantly higher U.S. inflation rates put further pressure on the U.S. dollar development. The
      EUR/USD exchange rate increased by +4.4% qoq (+9.6% yoy) and exceeds the value of 1.2 – for the first time since April 2018.

 3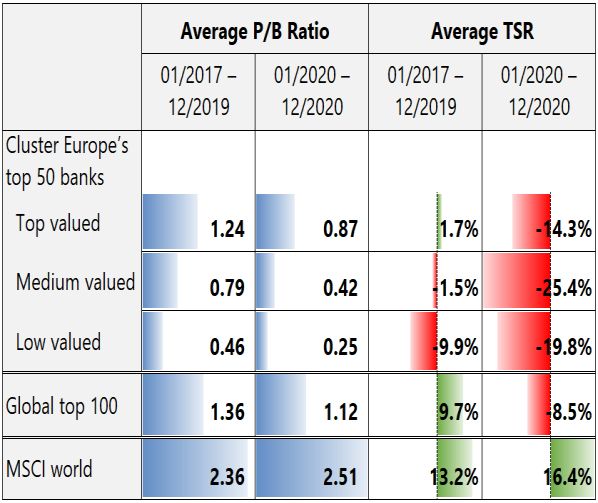
zeb.market.flash
                                                                                                                                                                                   Issue 35
                                                                                                                                                                    January 12, 2021

 Bank results of the first two quarters were mainly impacted by significantly increasing loan loss provisions (LLPs). In Q3 2020,
 risk provisions normalized which clearly pushed global banks’ profitability. In addition, European banks were able to slightly
 increase their earnings (+1% qoq), thus achieving an average quarterly RoE of 7.7%, +1.6%p above Q3 2019. However, these
 promising figures are unlikely to be sustainable as the current aggravation of the COVID-19 pandemic across Europe could lead
 to an uptick in LLPs again. The real test for banks’ financial resilience will come in the first half of 2021 after the end of the
 moratoria and state aid programs for corporates.

       RoE after tax of global top 100 banks (in %)1)                                        Cost-income ratio of global top 100 banks (in %)2)

      20                                                                                   80

                                                                                           70
      15
                                                                                           60

      10                                                                                   50

                                                                                           40
       5                                                                                   30

                                                                                           20
       0
                                                                                           10

      -5                                                                                     0
             Q1 19     Q2 19      Q3 19      Q4 19       Q1 20       Q2 20   Q3 20                Q1 19      Q2 19      Q3 19     Q4 19         Q1 20       Q2 20       Q3 20
                     Western Europe                  United States            BRICS                        Western Europe               United States                   BRICS

       Loan loss provisions of global top 100 banks (in %)3)                                 Customer interest rates in the euro area (new business, in %)

     1.5                                                                                    6

                                                                                            5

     1.0                                                                                    4

                                                                                            3

     0.5                                                                                    2

                                                                                            1

     0.0                                                                                    0
             Q1 19      Q2 19     Q3 19      Q4 19       Q1 20       Q2 20   Q3 20          Jan 19     Apr 19     Jul 19    Oct 19     Jan 20      Apr 20      Jul 20     Oct 20

                     Western Europe                United States             BRICS                            Consum. loans (1Y-5Y)                 Mortg. loans (5Y-10Y)
                                                                                                              Corp. loans (1Y-5Y)                   Deposits (≤ 1Y)

     Q4 2020 data not yet available; Western Europe: euro area, Denmark, Norway, Sweden, Switzerland, UK; 1) Post-tax RoE (return on equity): post-tax profit to average
     total equity, annualized values; 2) Cost-income ratio: operating expenses to total income, annualized values; 3) Loan loss provisions to average total assets, annualized
     values; Source: Fitch Connect, ECB, zeb.research

 • In Q3 2020, reported LLPs returned to pre-pandemic levels indicating that banks have reached sufficient provisions for the
      time being to balance future losses. U.S. banks’ LLPs slumped by -82% qoq (-14% qoq) and Western European banks reduced
      LLPs by -56% qoq (+16% yoy). However, based on the current dynamic of the pandemic, further, much higher LLPs could be
      required in the coming quarters.
 • Profitability of U.S. banks increased by +5.4%p to 10.9% (-1.3%p yoy) in Q3. Although U.S. banks were not able to keep up
      previous earnings growth (-10% qoq), normalized LLPs and lower costs (-6% qoq) boosted Q3 profits (+90% qoq).
 • European banks were able to further reduce costs (-2% qoq) and improve operational efficiency. In Q3, the cost-income ratio
      reduced for the third time in a row to 59%.
 • At the end of Q3 2020, corporate loan rates reached the highest value in two years. While most of the customer rates in the
      euro area were mainly unaffected by the COVID-19 pandemic, a higher demand for corporate loans as well as risk-adjusted
      pricing lead on average to increasing interest rates for corporate business over 2020 (+44bp since January 2020).

 4
zeb.market.flash
Issue 35
January 12, 2021
III. Special topic
European banks’ capital market performance – a valuation conundrum?
Even long before the COVID-19 pandemic, the European banking sector had been struggling with a weak capital market
valuation. Of course, the overall valuation of global banks has been low since the global financial crisis, however, especially
European banks seem to be traded at a significant discount. Unfortunately, one important goal of listed banks is clearly defined
by the creation of shareholder value. But is this even possible or is banking in Europe simply a bad investment?
TSR development of Europe’s top 50 banks vs market P/B ratio development of Europe’s top 50 banks vs market
(average indexed, 12/2016–12/2020, in %)1) (12/2016–12/2020, in %)2)
200 3.0
150
2.0
100
1.0
50
0 0.0
Dec 16 Jun 17 Dec 17 Jun 18 Dec 18 Jun 19 Dec 19 Jun 20 Dec 20 Dec 16 Jun 17 Dec 17 Jun 18 Dec 18 Jun 19 Dec 19 Jun 20 Dec 20
Top 50 banks Europe Top 100 global banks Europe's Top 50 - 1st quartile Europe's Top 50 - median
MSCI world Europe's Top 50 - 3rd quartile Top 100 global - median
MSCI world
Average capital market performance of Europe’s top 50 Selected KPIs of Europe’s top 50 banks by valuation cluster3)
banks by valuation cluster3)
1) Europe: EU28, Norway, Russia, Switzerland; monthly figures, 12/2016 indexed to 100, non-weighted average calculated in order to rate all banks equal; 2) Monthly
figures; 1st quartile: splits off the lowest 25% of the P/B ratios from the highest 75% of the P/B ratios, 3rd quartile: splits off the highest 25% of the P/B ratios from the
lowest 75%; 3) Valuation cluster of Europe’s top 50 banks defined by quartiles of the average P/B ratios 2017-2019, average figures for each cluster calculated (non-
weighted average in order to rate all banks equal); Source: company reports, Dealogic, European Banking Federation, European Central Bank, FitchConnect, zeb.research
In recent years, the capital market performance of the largest European banks has been clearly disappointing, and the COVID-19
induced recession has made things worse. Between 2017 and 2020, the average total shareholder return of Europe’s top 50 banks
was negative with an average of -6.5% p.a. – far below the market (+14.0% p.a.) and the global banking industry (+6.1% p.a.).
Consistently, European banks’ market valuations in terms of Price-to-Book ratios have continuously decreased since mid-2017.
However, looking at the quartiles of this P/B ratio development, there is a high heterogeneity across European banks. During the
last four years, 25% of the considered banks only showed values of around 0.5x on average or below (1st quartile), while 25% of
the banks also reached values of around 0.9x or higher (3rd quartile) – even this gap has also narrowed in recent years.
Focusing on the top valued European banks, defined by the 25% highest average P/B ratios between 2017 and 2019, these banks
showed substantially better capital market performance than the low valued (25% lowest average P/B ratios) as well as the
medium valued banks (middle 50% average P/B ratios). Between 2017 and 2019 (pre-pandemic period), these banks were able to
5zeb.market.flash
Issue 35
January 12, 2021
reach an average P/B ratio of 1.24x – above 1.0x and close to global banks’ average of 1.36 – as well as a positive TSR of 1.7% p.a.
Although there is still a gap to international peers and the market, European banks have obviously been able to achieve a
relatively adequate capital market valuation and performance in recent years. Furthermore, these banks have also performed
better since the outbreak of the COVID 19-pandemic and the corresponding crash on capital markets at the end of February 2020.
During the last 12 months, top valued banks have still reached an average P/B ratio of 0.87 – which is more than twice the value
of the lower valued banks – and incurred lower losses. Which banks are these and what made the difference?
The cluster of top valued banks mainly consists of banks from the Nordics – like SEB, Swedbank, Handelsbanken, Nordea and
DNB – but also includes some Northwestern European banks like KBC, UBS, ABN Amro, Erste Bank and HSBC. To analyze possible
determinants that could drive the different market valuations, we looked at several KPIs from different value dimensions such
as profitability, growth and risk of Europe’s top valued banks compared to the other valuation clusters.
Analyzing the average KPIs between 2017 and 2019, top valued banks on average showed a much higher profitability (return on
equity: 11.1%) as well as efficiency (cost-income ratio: 55.7%) compared to the medium and low valued banks. Behind efficiency,
the main driver is the cost base, as the top banks show a lower share of operating costs (1.3% of total assets vs 1.5%/ 1.7% for
medium/ low valued banks). From a risk perspective, top valued banks show a higher asset quality, as measured by a lower non-
performing loan (NPL) ratio, and higher CET1 ratios. Interestingly, top valued banks show stronger growth in operating revenues
(1.8% p.a.) while low valued banks show a much stronger performance in cost reduction (-3.0% p.a.). However, if cost reduction
is not reflected in profitability or efficiency, it seems not to be rewarded by capital markets. A similar picture emerges when
looking at the crisis period 2020. Based on Q3 figures, top valued banks were able to record better profitability, lower risks and
more resilient operating revenues.
Finally, we used a statistical model to further analyze the impact of fundamental bank KPIs on the P/B ratio and to prove the
significance of our findings. As explanatory variables, our approach considers a total of 10 banking KPIs for the listed top 50
banks in Europe over the period from 2017 to 2019: besides the variables described above, we included the leverage ratio, the
liquidity coverage ratio and the growth in total assets.1 Overall, the estimation results confirm most of our findings as return on
equity, cost-income ratio, CET1 ratio, NPL ratio, the share of operating costs but also growth in costs are significant and show
the assumed impact on the P/B ratio development. Moreover, 67% of the variance in banks’ P/B ratios can be explained by the
model.
Although banks’ market valuations are also driven by further determinants like global macro-financial conditions or the
regulatory environment, large parts can be explained by fundamental KPIs focusing on relevant value dimensions: profitability/
efficiency, risk and growth. In order to sustainably manage TSR/ value creation, bank management teams should therefore
consistently focus on such a set of KPIs. In recent years, these values have not been favorable for most of the top European banks,
which has been reflected in market valuations. However, looking at the top valued European banks, good operational execution
across all relevant value dimensions will be rewarded by capital markets.
1
We used a simple fixed effects panel data regression model. All data is on a yearly basis.
6zeb.market.flash
Issue 35
January 12, 2021
About zeb.market.flash
zeb.market.flash is a quarterly compilation of market data, putting the total shareholder return (TSR) performance of the global
banking industry, economic fundamentals and key value drivers into perspective. It is published by zeb. All data and
calculations of this issue are based on the date of January 4, 2020. The global top 100 banks cluster contains the largest banks by
market capitalization on December 31, 2019 and is updated on an annual basis. Data is subject to ongoing quality assessment. As
a consequence, minor adjustments could be applied to historical data as well as forecasts shown in previous issues of
zeb.market.flash.
As a leading strategy and management consultancy, zeb has been offering transformation expertise along the entire value chain
in the financial services sector in Europe since 1992. In Germany, we operate offices in Frankfurt, Berlin, Hamburg, Munich and
Münster (HQ). Our international locations are in Amsterdam, Copenhagen, Kiev, London, Luxembourg, Milan, Moscow, Oslo,
Stockholm, Vienna, Warsaw and Zurich. Our clients include European large-cap and private banks, regional banks, insurers as
well as all kinds of financial intermediaries. Several times already, our company has been classed and acknowledged as “best
consultancy” for the financial sector in industry rankings.
For more information visit www.zeb-consulting.com
Contact
Heinz-Gerd Stickling Dr. Benedikt Rotermann Dr. Ekkehardt Bauer
Partner Manager zeb.research Senior Manager zeb.research
Hammer Straße 165 Hammer Straße 165 Hammer Straße 165
48153 Münster | Germany 48153 Münster | Germany 48153 Münster | Germany
Phone +49.251.97128.225 Phone +49.251.97128.390 Phone +49.251.97128.225
E-mail hstickling@zeb.de E-mail benedikt.rotermann@zeb.de E-mail ebauer@zeb.de
7You can also read