INVESTOR PRESENTATION - Rod Bishop, Managing Director October 2019 - Jayride Group (ASX:JAY) The world-leading global airport transfers ...

Page created by Jeff Lucas
 
CONTINUE READING
INVESTOR PRESENTATION - Rod Bishop, Managing Director October 2019 - Jayride Group (ASX:JAY) The world-leading global airport transfers ...
INVESTOR PRESENTATION
Rod Bishop, Managing Director
October 2019

                                      Jayride Group (ASX:JAY)
                                     The world-leading global
                                airport transfers marketplace
                                            www.jayride.com
INVESTOR PRESENTATION - Rod Bishop, Managing Director October 2019 - Jayride Group (ASX:JAY) The world-leading global airport transfers ...
WHO IS                                        Connecting travellers with ground transport companies, worldwide.

    JAYRIDE?
                                                B2C and B2B

    World-leading
                                                websites to
                                                compare and
                                                book transport
    Travel E-commerce
    Marketplace for
    Passenger Transport.
    B2C Travel
    Travellers read reviews, compare and
    book rides around the world, including
    rideshares, shared airport shuttles and
    luxury private transfers.

    B2B Travel
    Travel brands use Jayride APIs to create
                                                      Powering passenger transport bookings for the world’s leading travel brands.
    new ancillary revenues by selling airport
    transfers to their travellers.

    ŗŗ 1,500+ airports in 81 countries
    ŗŗ 3,300+ transport companies
    ŗŗ 48,000+ real traveller reviews
2
INVESTOR PRESENTATION - Rod Bishop, Managing Director October 2019 - Jayride Group (ASX:JAY) The world-leading global airport transfers ...
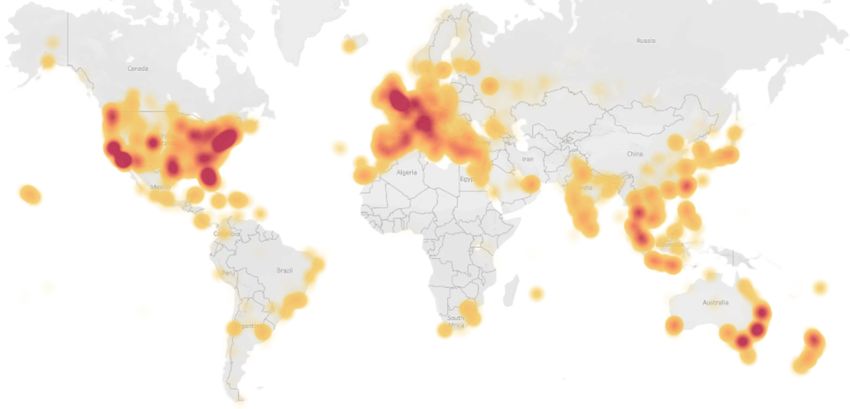
Jayride’s opportunity is
                                    to become the traveller’s
                                           first trusted global
                                              transport brand

OUR       Let the traveller ride like a local
PURPOSE
INVESTOR PRESENTATION - Rod Bishop, Managing Director October 2019 - Jayride Group (ASX:JAY) The world-leading global airport transfers ...
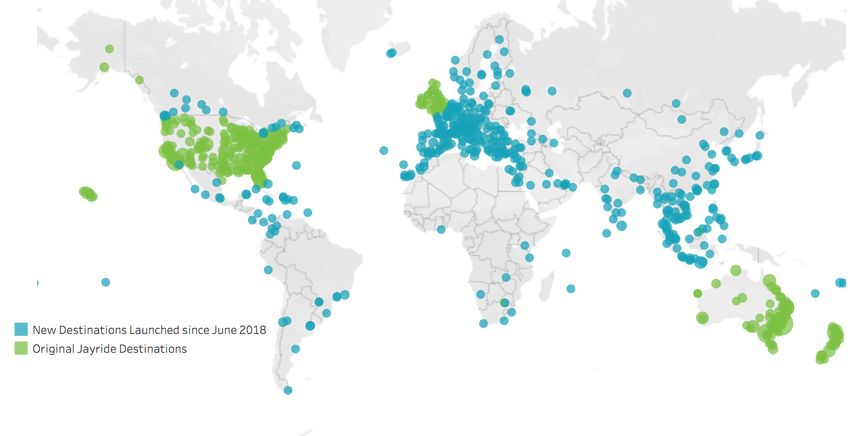
RECORD RESULTS                   Record financial results with high growth from

    CONTINUE
                                     new destination countries launched in FY19.
                                     All destinations hit new record GPAPA.

                                                             Revenue growth
                                                             ŗŗ Record Revenue
                                                             ŗŗ Revenue growth stable
                                                                for 25 straight quarters
                                                             ŗŗ Growth in Revenue
         +71%               +470%                               per passenger trip
         Net Revenue from    GPAPA from
          Passenger Trips   Passenger Trips                  GPAPA growth
                                                             ŗŗ Record Gross Profit after
                                                                Paid Acquisition (GPAPA)
                                                             ŗŗ GPAPA margin of 57%
                                                                exceeds expectations
                                                             ŗŗ Growth in GPAPA
                                                                per passenger trip

4
INVESTOR PRESENTATION - Rod Bishop, Managing Director October 2019 - Jayride Group (ASX:JAY) The world-leading global airport transfers ...
UNLOCKED                                         The entire global airport transfers industry now

    GLOBAL GROWTH
                                                     available through one source. The first ever global
                                                     roll-out of this kind for the airport transfers industry.

    New uniquely
    scalable global
    opportunity

      ŗŗ Opportunity to scale into the
         foundations by leveraging
         each destination
                                         81+               1,500+              3,300+              85%+
                                         Countries           Airports       Transport Companies   Market Access

5
INVESTOR PRESENTATION - Rod Bishop, Managing Director October 2019 - Jayride Group (ASX:JAY) The world-leading global airport transfers ...
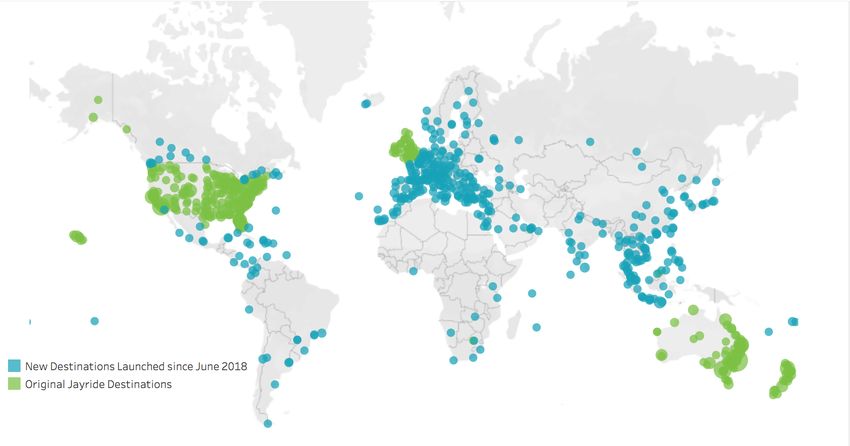
NEW AND EXISTING                                                             Fast revenue growth in new destination countries

    COUNTRIES DELIVER
                                                                                 (+443% 2H VS 1H). Strong profit growth across
                                                                                 all destinations, to 50%+ GPAPA margin.

                        Original destination countries vs new destination countries launched during FY19

                                                                  Original five destination countries             New destination countries

                                                                  2H FY19    1H FY19    Movement                  2H FY19    1H FY19    Movement
                                                                  AUD(000's) AUD(000's) %                         AUD(000's) AUD(000's) %
    Passenger trips booked                                                140         143       -2% ▼                       56       11    +388% ▲
    Net Revenue from passenger trips booked (excl other Income)         1,525       1,346     +13% ▲                       346       64    +443% ▲

    Cost of customer acquisition                                         -748       -1155     +35% ▲                       -164    -175       +7% ▲
    Gross profit after paid acquisition (GPAPA)                           777         191    +306% ▲                       183     -111    +264% ▲

    GPAPA margin                                                         51%         14%                                   53%    -175%

                                                                                            New countries:
                                                                     +443%                  ŗŗ Passenger trips growth +388% 2H VS 1H,
                                                                       New countries           Net Revenue growth +443% 2H VS 1H
                                                                  Revenue growth 2H VS 1H   ŗŗ Maintain GPAPA high-water mark

                                                                                            Original countries:
                                                                     +306%                  ŗŗ Optimise to profitability
                                                                    Original countries
                                                                                            ŗŗ New high-water mark GPAPA margin exceeds expectations
                                                                  GPAPA growth 2H VS 1H
                                                                                               (51% VS previous aspirational economics 35%)

6
INVESTOR PRESENTATION - Rod Bishop, Managing Director October 2019 - Jayride Group (ASX:JAY) The world-leading global airport transfers ...
GLOBAL FOOTPRINT                                                       New destinations grow 5X in 2H VS 1H, accelerating

    TRIPS ACCELERATE
                                                                           Jayride’s growth. Passenger trip revenues are now
                                                                           truly global (65%+ from outside Australia).

           Passenger Trips Booked by Destination

                                                                                                           New Transport
                                                                                                          Platform Launch
        Passenger Count

                          FY16                     FY17                           FY18                                FY19
    Delivering
    strong growth         ŗŗ 5 countries           ŗŗ 5 countries                 ŗŗ 5 countries                      ŗŗ 81 countries
    from new              ŗŗ TAM 2.1B pax trips    ŗŗ TAM 2.1B pax trips          ŗŗ TAM 2.1B pax trips               ŗŗ TAM 6.6B pax trips
    destinations

7
INVESTOR PRESENTATION - Rod Bishop, Managing Director October 2019 - Jayride Group (ASX:JAY) The world-leading global airport transfers ...
TARGET 1M PASSENGER                                                                               Jayride reaffirms its new core objective to

    TRIPS BOOKED FY21
                                                                                                      organically grow Passenger Trips Booked to
                                                                                                      at least 1 million per year by 30 June 2021.

          Target 1 million Passenger Trips Booked FY21                                                                            1,000,000
          1,000,000

            900,000

            800,000

            700,000

            600,000

            500,000

            400,000

            300,000

            200,000

            100,000

                    0
                               FY15                 FY16                FY17                 FY18           FY19         FY20        FY21

8   Please refer to the disclaimer on forward looking statements on the final page of this presentation.
INVESTOR PRESENTATION - Rod Bishop, Managing Director October 2019 - Jayride Group (ASX:JAY) The world-leading global airport transfers ...
ADDRESSING OUR HUGE                                          7.7B trips at airports each year with no

    GLOBAL MARKET
                                                                 incumbent global marketplace. No transport
                                                                 company can ever service the whole world.

                                                                           FY19
    ŗŗ Total Addressable Market: Billions of
       travellers go to and from airports each            Passenger Trips to/from Airports Globally
       year. Every traveller needs transport.
                                                                         7.7B
    ŗŗ Jayride Market Access: In FY19 Jayride
                                                            Passenger Trips in Jayride Countries      FY18-19 Focus
       unlocked global growth to cover 85% of the
       world’s passenger trips.
                                                                         6.6B

    ŗŗ Jayride Current Demand: Today Jayride has 10M’s of
                                                                  Passenger Trips Quoted
       quote requests through its platform validating demand
       for transport options.
                                                                        10M’s
                                                                                                      FY20-21 Focus

    ŗŗ Jayride Revenue-Driver: In FY20-21 Jayride will leverage its     Passenger Trips
       market access and demand to grow passenger trips booked              Booked
       and revenues.                                                       351K
9
INVESTOR PRESENTATION - Rod Bishop, Managing Director October 2019 - Jayride Group (ASX:JAY) The world-leading global airport transfers ...
10M’S TRIPS QUOTED                                 Massive traveller demand follows the

     BIG DATA INSIGHTS
                                                        global roll-out. Trips quoted number
                                                        10M’s with opportunities to optimise.

                              ŗŗ A massive step-up in demand through the Jayride platform creates
     New insights platform       a unique global big data set of high-intent traveller demand
     launched in 2H enables   ŗŗ Immediate opportunity to add more partners to the funnel
     optimization down to        and to convert more quote requests to bookings
     street address level     ŗŗ Insights from these quote requests empower transport
                                 companies to optimise their rates and coverage

10
OUR GROWTH ENGINE:                                               Delivering insight that drives value for every

     TRANSPORT COMPANIES
                                                                      transport company, creating a global value-add
                                                                      ecosystem that can’t be found anywhere else.

      1. Travellers Search and Discover                          3. Generate Actionable Insights
      Travellers search for airport transfers in a destination   Demand insights are discovered with big data
      and discover improved coverage and pricing which           analysis using geospatial business intelligence tools.
      creates an incentive for travellers to come back.

                               TRAVELLERS                                        TRANSPORT

      2. Traveller Quote Data Captured                           4. Coverage and Price Optimization
      Airport, address, passenger count, airline, travel date    Transport companies act on Jayride’s coverage and
      and time, extra requests and add-ons are captured          price recommendations to optimise their services,
      every time a traveller makes a search.                     and meet the traveller’s needs.

11
TRAVELLER                    As Jayride serves more destinations, more travellers are

     RETENTION
                                  retained to travel around the world. Higher traveller LTV
                                  improves Jayride’s unit economics for profitability at scale.

                                                                                   FY 2019

                                             Discover                             Travellers
      Key Drivers of                                                            70K
      Retention
      ŗŗ Most Destinations!                                                      Passenger
                              Retain                           Book             Trips Booked

      ŗŗ Best Discovery                                                        351K
      ŗŗ Most Choice
      ŗŗ Best Experience
                                                                                  Trips per
                                           Experience                             Traveller

                                                                                 5.0

12
A THRIVING                    Jayride’s innovative technology and global

     PARTNER ECOSYSTEM
                                   supply is leveraged by some of the world’s
                                   biggest travel brands.

           Existing Partnerships       Newly Added Partners in FY 2019

                                                                   Example Partner
                                                                   In addition to
                                                                   adding new
                                                                   partners, the
                                                                   value of existing
                                                                   partners grows
                                                                   over time through
                                                                   the adoption of
                                                                   new countries.

13
ASPIRATIONAL                                                                                                         2H FY19 has outperformed Jayride’s

     ECONOMICS
                                                                                                                          previous aspirational model for GPAPA
                                                                                                                          ratio and growth expenses.

                                           Aspirational Metrics                                                                                                Input Assumptions
     Scenario                                               Scenario 1: Global              Scenario 2: Retaining
                                                            rollout completed               travellers at scale
     The aspirational scenarios are presented for           2.5X today's 100,000            Now targetting 40%+
     illustrative purposes only                             trips per quarter               EBITDA margin at scale     Key Inputs:
                                                                                                                       Lastest run rates                                           2H FY19 Trips      Annualised Trips
     Passenger trips booked                                               1,000,000                      10,000,000    Passenger trips booked                                           196,000                392,000

                                                                        AUD(000's)                      AUD(000's)                                                            2H FY19 AUD(000's) Annualised AUD(000's)
     Net Revenue from passenger trips booked                ($                9,500) ($                    100,000)    Net Revenue from passenger trips booked           ($               1,871) ($             3,742)
     Other income                                           ($                   900) ($                     1,200)    Net Revenue per passenger trip booked             ($                 10) ($                 10)
     Net Revenue                                            ($              10,400) ($                     101,200)
                                                                                                                       GPAPA margin excl grants and other revenue                           51%
     Cost of customer acquisition                           ($               (4,600) ($                    (48,700)    GPAPA per passenger trip booked                   ($                   5)
     Gross profit after paid acquisition (GPAPA)            ($               5,800) ($                      52,500)

                                                                                                                       Key Outputs:
     Operational costs                                      ($               (2,400) ($                      (5,000)
     Gross profit after all operational costs               ($               3,400) ($                      47,500)

     Growth, corporate costs and share-based compensation   ($               (3,400) ($                      (7,500)
                                                                                                                                 Targeting profit                               Targeting 40%+
     EBITDA                                                 ($                     -    ) ($                40,000)
                                                                                                                              before 1M passenger                              EBITDA margin at
     GPAPA margin excl grants and other revenue                                  51%                           51%              trips (2.5X today)                              10M+ trips scale
     EBITDA Margin                                                                     0%                      40%

     Global market share                                                                                     0.13%

     Note: The above scenarios are based on estimates and projections that rely upon various assumptions.              Key changes to previous aspirational model:
     These assumptions may or may not prove to be correct, accordingly no reliance should be made on this
     information.                                                                                                      ŗŗ Net Revenue and GPAPA per trip have increased ($10 and $5)
                                                                                                                       ŗŗ GPAPA margin exceeds 51% (previously targeting 35%)
                                                                                                                       ŗŗ Growth expenses reduced to $3.4M
14
FY19 RESULTS

15
A STEP CHANGE IN                                                            Unparalleled global expansion. Jayride destination

     LEAD INDICATORS
                                                                                 countries step change from 5 countries in FY18 to
                                                                                 81 countries served in FY19 (15X growth)

                                                                                                           Global growth
                                                                                                           ŗŗ Step change in global
             +1500%                                   +182%                        +58%                       market access
               New Destination                         New Destination                Transport            ŗŗ Roll-out from 5
                 Countries                                Airports                 Companies Online
                                                                                                              countries to 81
                                                                                                              countries
                                                                                                           ŗŗ Jayride now serves
                                                                                                              85% of world
                                                                                                              aviation markets
                                                                                                           ŗŗ Company focus shifted
                                                                                                              to leverage of new
                                                                                                              countries in 2H

               +49%                                    +56%                        +71%
               Passenger Trips                         Total Transaction           Net Revenue from
                   Booked                                    Value                  Passenger Trips

16   TTV is Total Transaction Value. Percentage growth rates are FY19 VS FY18.
INCREASING REVENUE       2H FY19: Revenue growth, increased efficiency

     DECREASING COST
                              at creating free cash flow, and improvements
                              to cost-base after global roll-out.

         +71%                                                      +31%
            2H VS 1H                                                  2H VS 1H

      Revenue from                                             Even as revenue
      passenger trips                                          increases, cost of
      booked achieves 6                                        customer acquisition
      years of consistent                                      decreases, increasing
      growth.                                                  free cashflow.

         +25%                                                      +38%
            2H VS 1H                                                  2H VS 1H

      New global foundation                                    Revenue growth
      completed. Growth                                        and cost reductions
      expenditure and                                          combine for strong
      capex now strongly                                       path to profitability.
      reduced.

17
FY19 CASH FLOW                                                       Jayride has operated a cash burn to build its

     IMPROVEMENTS
                                                                          global asset. Now strongly reducing cash burn to
                                                                          ($0.9M) in Q4. Current Assets at $3.4M in Q4

                                                                                             Financing Cash Flows FY19

                                                                                             ŗŗ $1.7M placement at $0.43
                                                                                                in December 2018
                                                                                             ŗŗ $3.0M convertible note facility
                                                                                                in March 2019
                                                                                             ŗŗ Note terms favourable with
                                                                                                Stock Options at $0.553
                                                                                             ŗŗ $2.0M of Note drawn down,
                                                                                                $1.0M remains to draw at the
                                                                                                Company’s election subject
                                                                                                to the terms of the note
                     Expenses relating to
                   international roll-out in
                   Q1&2 were paid in Q2&3

       ŗŗ Net operating cashflows ($0.9M)      ŗŗ Current asset position stable            ŗŗ $1.0M of note remains to be drawn
          in Q4 FY19 is the new baseline          at $3.4M in Q4 FY19                         subject to the terms of the note
       ŗŗ Strategy to continue reducing        ŗŗ Grants receivable (R&D Tax Incentive)    ŗŗ $9.0M of Stock Options at $0.553
          burn through leverage at scale          already received during Q1 FY20             expire 31st March 2020

18
INCOME STATEMENT                                                                                      FY19 1H Jayride invested heavily to deliver its new

     FY19
                                                                                                           global foundations. In 2H Jayride leveraged this
                                                                                                           foundation toward profit.

                                                          Income Statement Summary
                                                               2H FY19    1H FY19 Movement          FY19       FY18 Movement     ŗŗ Strong revenue growth in
                                                             AUD(000's) AUD(000's)      %      AU$(000's) AU$(000's)      %         2H from new countries and
     Passenger trips booked                                        196       154     +27% ▲         351        236     +49% ▲       strong improvements to GPAPA
                                                                                                                                    profitability across all countries
     Net Revenue from passenger trips booked                     1,871     1,410     +33% ▲        3,281     1,914     +71% ▲
                                                                                                                                 ŗŗ 71% growth in Net Revenue from
     Other income                                                  533         9                    542        538                  Passenger Trips (FY19 VS FY18)
     Gross profit                                                2,404     1,419     +69% ▲        3,823     2,451     +56% ▲
                                                                                                                                 ŗŗ 108% growth in GPAPA from
     Operational costs
                                                                                                                                    Passenger Trips (FY19 VS FY18)
     Cost of customer acquisition                                 -911     -1,330    +31% ▲       -2,241     -1,413     -59% ▼   ŗŗ Net Revenue growth in new
     Operational costs                                           -1,910    -1,267     -51% ▼      -3,177     -1,933     -64% ▼      destinations drives this result in the
                                                                                                                                    second half, up 443% in 2H VS 1H
     Growth and corporate costs
                                                                                                                                 ŗŗ Net Revenue from Passenger Trips is
     Corporate costs                                              -425      -387      -10% ▼        -812      -432      -88% ▼
                                                                                                                                    now global (65% outside Australia)
     Growth costs (excl capitalised development costs)           -1,301    -1,777    +27% ▲       -3,078     -2,734     -13% ▲
     Share-based compensation                                    -1,267     -634     -100% ▼      -1,901     -1,162     -64% ▼   ŗŗ GPAPA margin increases to over
     Operating Profit                                            -3,410    -3,976    +14% ▲       -7,386    -5,223      -41% ▼      51% in 2H across all countries,
                                                                                                                                    strongly exceeds expectations
     GPAPA from passenger trips margin (excl other income)        51%         6%                    32%       26%                ŗŗ Operating Profit margin before
     Gross profit after opex margin (excl other income)           -51%      -84%                   -65%       -75%                  Share-based compensation improves
     Operating profit before share-based compensation            -115%     -237%                  -167%      -212%                  from -237% to -115% in 2H VS 1H
     margin
     Operating profit margin                                     -182%     -282%                  -225%      -273%
                                                                                                                                 ŗŗ Trend continues: Q4 FY19 Operating
                                                                                                                                    Profit margin before Share-based
                                                                                                                                    compensation was the Company’s
                                                                                                                                    best performance in two years
                                                                                                                                 ŗŗ Projects scoped for further
                                                                                                                                    improvements to revenue
                                                                                                                                    and operating costs

19         GPAPA is Gross Profit After Paid Aquisition.
CASH PERFORMANCE                                                                           Jayride has operated a cash burn to build its

     FY19
                                                                                                global asset. Now strongly reducing cash burn to
                                                                                                ($0.9M) in Q4. Current Assets at $3.4M in Q4

                                      Cash flow summary
                                                                   FY19       FY18 Movement
                                                              AU$(000's) AU$(000's)      %
     Cash from Operating Activities
     Net receipts from customers                                  3,383     1,991     +70% ▲
     Customer acquisition costs                                  -2,237     -1,413
     Operating and corporate costs                               -5,377     -4,557
     Cash from Operating Activities                              -4,231    -3,979      -6% ▼

     Cash from Investing Activities
     Growth costs (including capitalised development costs)      -1,859     -2,043
     R&D Tax Incentive & EMDG                                      485        489
     Cash from Investing Activities                              -1,374    -1,554      -12% ▲

     Cash from Financing Activities
     Equity Investment                                            1,617    10,178
     Debt Finance                                                 1,900    (1,829)
     Cash from Financing Activities                               3,517     8,349
                                                                                                  ŗŗ ($0.9M) Net operating cashflows in Q4 FY19
                                                                                                  ŗŗ $3.4M Current asset position in Q4 FY19
     Cash movement
     Cash inflow/outflow                                         -2,088     2,816                 ŗŗ Raised capital through $1.7M placement in December
     FX Movements on cash balances                                  -26       -23                    2018, and 2.0M convertible note in March 2019
     Net Increase / (Decrease) in Cash                           -2,114     2,793                 ŗŗ $1.0M (R&D Tax Incentive receivable at 30 June 2019,
                                                                                                     already received during Q1 FY20
     Cash Position at 30 June 2019                                1446       3560
                                                                                                  ŗŗ Opportunity to further improve cash assets through
                                                                                                     enhanced collection of trade receivables

20
BALANCE SHEET                                                                        Multiple pathways to improve Jayride’s Balance

     FY19
                                                                                          Sheet as the Company reaches the end of its cash
                                                                                          burn phase, and scales toward profit phase.

                                   Balance Sheet Summary
                                                    30-Jun-19 30-Jun-2018   Movement        ŗŗ $18M invested to build world-leading global
                                                   AU$(000's) AU$(000's)    AU$(000's)         platform with strong strategic value
     Cash and cash equivalents                         1,446        3,560       (2,114)
                                                                                            ŗŗ Immediate opportunity to scale toward profit
     R&D Tax Incentive                                   959         854           105
                                                                                               through growing revenues and decreasing costs
     Trade and other receivables                         972         735           237
     Total current assets                              3,376        5,149      (1,773)      ŗŗ Optionality on further capex investment

     Non current assets                                2,943        2,737          206      ŗŗ Additional $1M convertible note available January 2020 at
     Total assets                                      6,319        7,886      (1,567)         the Company’s election subject to the terms of the note

                                                                                            ŗŗ Potential $9M Stock Options from Pre-IPO investors
     Trade and other payables                          1,874        1,092          782
                                                                                               exercise price at $0.553 expiring March 2020
     Future transport supplier payments                  850         499           351
     Other current liabilities                           214         140            73      ŗŗ $3M current asset position including $1.4M
     Total current liabilities                         2,938        1,731        1,207         cash assets at 30th June 2019

     Non-current liabilities                           1,626          45         1,581
     Total liabilities                                 4,564        1,776        2,788

     Net asset position                                1,755        6,110      (4,355)

21
JAYRIDE MARKET
     CAPITALISATION
                                                                                               Shares and Options as issued

     Shares on issue                                                                                    (#)                          Market capitalisation and EV                                              (AUD$)
     Ordinary shares not escrowed                                                             62,144,112                             Market capitalisation (at $0.430 per share)                           $36,261,000
     Ordinary shares under escrow                                                             22,184,259 *                           Cash at 30 June 2019                                                   $1,445,000
     Total Shares on Issue                                                                    84,328,371                             Enterprise Value                                                      $34,816,000

     Share Options on Issue                                                                             (#)
     Options at $0.553 from Pre-IPO expiring 31/03/2020                                       16,334,738 * / **
     Options at $0.553 from Converible Note                                                    3,616,637 ***
     Options from ESOP                                                                         2,378,198 ****
     Total Options on Issue                                                                   22,329,573

                                                           Pro-forma Shares and Options, fully diluted, assuming Options exercise

     Shares on issue                                                                                    (#)                          Market capitalisation and EV                                              (AUD$)
     Ordinary shares                                                                          84,328,371                             Market capitalisation (at $0.553 per share)                           $58,982,000
     Shares issued on Options exercise                                                        22,329,573                             Cash at 30 June 2019                                                   $1,445,000
     Total Shares on Issue after Options exercise                                           106,657,944                              Cash through Options from Pre-IPO                                      $9,033,000
                                                                                                                                     Cash through Options from Convertible Note                             $2,000,000
                                                                                                                                     Cash through Options from ESOP                                         $1,268,000
                                                                                                                                     Total Cash                                                            $13,746,000
                                                                                                                                     Enterprise Value                                                      $45,236,000

     Pro-forma section is illustrative only to show the effect including the Options exercise
     * Shares and Options include those issued to Founders and Directors
     ** Options from Pre-IPO expire at 31 March 2020 with an exercise price of $0.553. Founders and Directors Options are under Escrow until 29/01/2020, the remainder are under Escrow until 18/12/2018
     *** Options from Convertible Notes expire 20 March 2022 with an exercise price of $0.553
     **** Options from ESOP expire 30 June 2023, vesting over 4-years, with an exercise price of $0.533

22
APPENDIX

23
API FOR
     PARTNERS
      Partners use Jayride to
      sell airport transfers for
      new ancillary revenues.

                                   Examples
                                   of Jayride
                                   API in use

24
NEW LAUNCH                                        Travellers now discover Jayride on Google organic

     TRAVELLER SEO
                                                       search results. Cheapest cost of traveller acquisition
                                                       (CAC) currently in country-by-country global roll-out.

     ŗŗ Major Search Engine           ŗŗ Travellers can now find              ŗŗ SEO is now Jayride’s top
        Optimization (SEO) platform      transfers on Google including           traveller acquisition channel.
        launched in December 2018        Google Knowledge Graph

25
NEW LAUNCH                                                    Re-imagined rides for travellers. Jayride travellers

     RIDESHARE BOOKING
                                                                   can compare and book the best local ride-hail
                                                                   and rideshare services at fixed prices.

      ŗŗ Compare different ride-hails
      ŗŗ Quoted in traveller currency
      ŗŗ Pre-book at fixed prices
      ŗŗ No app download required
      ŗŗ No data roaming required
      ŗŗ Real trusted reviews

             US           Europe & Middle East

       Europe and Latam   Middle East & Africa

            Europe               Europe
                                                 ŗŗ Ride-hailing for travellers compare and pre-book in advance
                                                 ŗŗ Lyft is a top-seller on Jayride, and distributed to Expedia
                                and more...
                                                 ŗŗ Now serving ride-hail and rideshare globally
             Asia                Globally
26
THE TRAVELLER                         World-leading source of reviews for transport.

     EXPERIENCE
                                           Giving the traveller reviews they can use, and
                                           the local knowledge they need before they fly.

                                                                  ŗŗ Jayride is a trusted source
                                                                     of reviews of transport

               350,000+
                                                                     companies for travellers
                                                                     to read and compare.

          Passenger trips served in FY19                          ŗŗ The largest source of
                                                                     third-party reviews
                                                                     available anywhere
                                                                  ŗŗ Read reviews,
                                                                     compare, and select

                48,000+                                              the transport option
                                                                     that is right for you.
              Real traveller reviews
             now available on Jayride

                4.2 / 5.0
             Average review score of
              all transport reviews

27
ABOUT
     JAYRIDE GROUP
     Jayride.com is a world leading global airport transfers marketplace, which creates seamless experiences for travellers by allowing
     them to compare and book airport transfers around the world. With Jayride.com, travellers can compare and book with 3,300+
     transport companies, servicing 1,500+ airports around the world, including the Americas, Europe, Middle East, Africa, Asia and
     the Pacific.
     The Jayride.com platform aggregates ground transport companies and distributes them to travellers at Jayride.com; and via
     partnerships with other travel technology platforms, travel agencies and wholesalers. These partners implement Jayride.com
     APIs to sell ground transport and add new incremental ancillary revenue to their travel businesses.
     Founded in 2012, Jayride.com is headquartered in Sydney, Australia.
     For more information, please visit www.jayride.com

     Disclaimer
     This announcement contains forward-looking statements that involve risks and uncertainties. Indications of, and guidelines or outlook on, future earnings, distributions or financial position
     or performance and targets, estimates and assumptions in respect of production, prices, operating costs, results, capital expenditures, reserves and resources are also forward-looking
     statements. These statements are based on an assessment of present economic and operating conditions, and on a number of assumptions and estimates regarding future events and actions
     that, while considered reasonable as at the date of this announcement and are expected to take place, are inherently subject to significant technical, business, economic, competitive, political
     and social uncertainties and contingencies. Such forward-looking statements are not guarantees of future performance and involve known and unknown risks, uncertainties, assumptions
     and other important factors, many of which are beyond the control of the Company, the directors and management. We cannot and do not give any assurance that the results, performance
     or achievements expressed or implied by the forward-looking statements contained in this announcement will actually occur and readers are cautioned not to place undue reliance on these
     forward-looking statements. These forward-looking statements are subject to various risk factors that could cause actual events or results to differ materially from the events or results estimated,
     expressed or anticipated in these statements.

     Image Credits
     Close-up image of female hands holding smartphone sitting in the airplane stock photo - Photo by undrey on Istockphoto.com. | Traveller at the airport stock photo - Photo by Chalabala on
     Istockphoto.com. | Woman standing on middle of road - Photo by Guilherme Stecanella on Unsplash.com. | Close up man holding big smart phone stock photo - Photo by Pakorn_Khantiyaporn
     on Istockphoto.com. | People with disabilities travelling. Girl in wheelchair and disabled are standing in airport hall. Stock photo - Photo by vadimguzhva on Istockphoto.com.

28
FOR MORE
INFORMATION
corporate@jayride.com
You can also read