2018 FULL YEAR RESULTS PRESENTATION - THURSDAY 18 OCTOBER 2018 - Australian Pharmaceutical Industries
←
→
Page content transcription
If your browser does not render page correctly, please read the page content below
2018 FULL YEAR RESULTS PRESENTATION
       THURSDAY 18 OCTOBER 2018
Important Notice

The material in this presentation is of general information about API’s activities current at the
date of the presentation. It is information given in summary form and does not purport to be
complete. Nothing in this presentation should be construed as a recommendation or forecast
by API or an offer to sell or a solicitation to buy or sell shares. It does not take into account the
investment objectives, financial situation or needs of a particular investor. These should be
considered with or without professional advice when deciding if an investment is appropriate.

This presentation contains certain non‐IFRS measures that API believes are relevant and
appropriate for the understanding of the business. Refer to Appendix 1 for further information.

2018 FULL YEAR RESULTS PRESENTATION                                                                     2
GROUP PERFORMANCE
     RICHARD VINCENT
  CEO & MANAGING DIRECTOR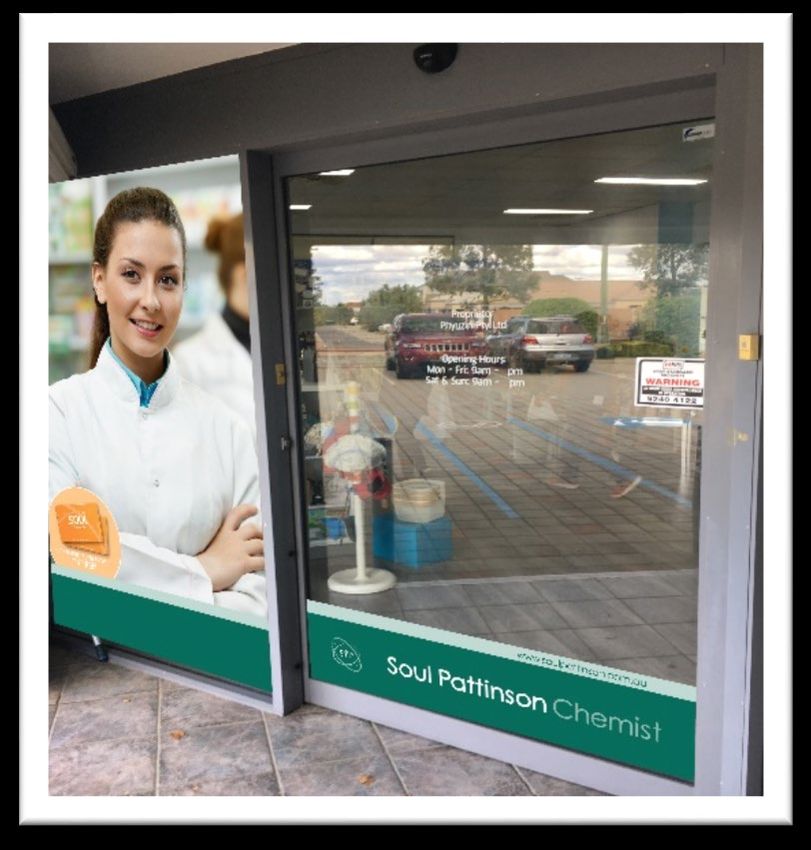
FY18 Results snapshot
Revenue Underlying1
HIGHLIGHTS FOR FY18
EBITDA
Final dividend payment up
14.3% and payout ratio $4.0bn $119m
increased from prior year
Delivered FY18 underlying
NPAT guidance
Underlying1
Balance sheet remains NPAT
strong and provides
$54.7m
flexibility
Completed Stage 1 of
Clearskincare acquisition
Managed challenging Underlying1 Total dividends
trading conditions and EPS
rebased support office cost
7.5c/share
11.1c
structure
1 Refer to Appendix 1 for definition
2018 FULL YEAR RESULTS PRESENTATION 4 4
FY18 Business highlights
BALANCED MANAGEMENT OF TRADING CONDITIONS AND GROWTH OPTIONS
Priceline Pharmacy
• Improved like-for-like sales trend during 2H18
• Network growth with franchise partner sentiment further
strengthened
Pharmacy Distribution
• Underlying sales growth and consolidated gains from FY17
• Managed margin impact of PBS price changes and exclusive
direct distribution
Consumer Brands
• Increased EBIT contribution by $2.1m
• Strong pipeline and product development for FY19
Corporate
• Decreased ongoing operating costs and CODB to 10.3%
• Continued to reduce reported net debt, excluding acquisition
funding
• Completed stage 1 of Clearskincare acquisition in July
2018 FULL YEAR RESULTS PRESENTATION 5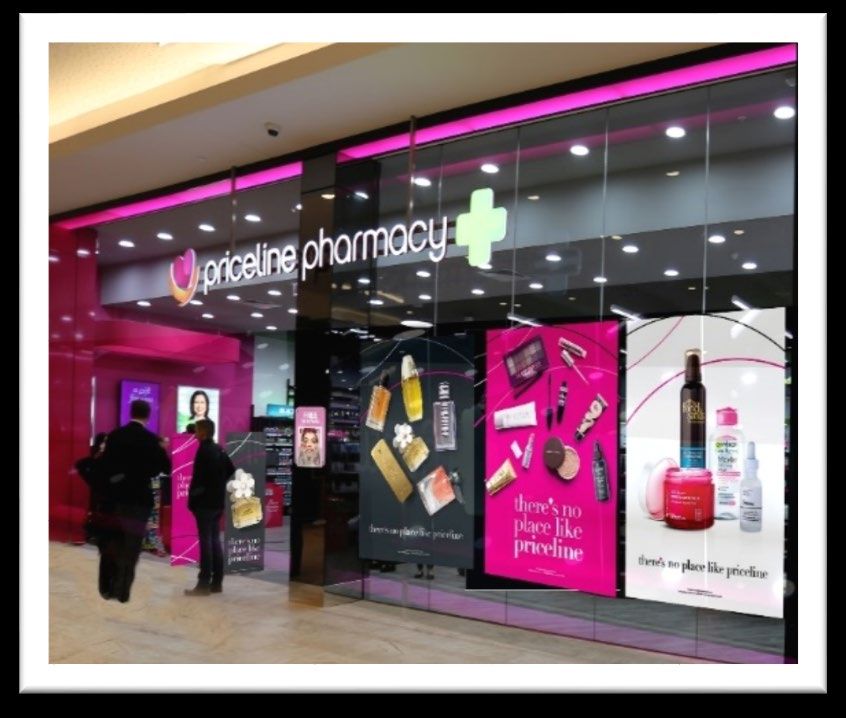
The API Growth agenda and priorities
COMPLEMENTARY PORTFOLIO OF HEALTH AND
BEAUTY ASSETS TO DELIVER GROWTH
Existing capability in heritage Growth outlook
assets can maximise return
across the business portfolio
Leverage existing infrastructure and market expertise
Building on infrastructure to
improve operational
performance and flexibility in
Evolve Priceline Pharmacy
customer offer Expand Build Consumer
Pharmacy offer Distribution to
Clearskincare Brands portfolio
to address deliver stable
Financial strength remains network and and earnings
customer ROCE and cash
following Clearskincare grow profitability contribution
changes generation
acquisition
Bolstered management
capability to execute growth Financial strength and flexibility
plans
2018 FULL YEAR RESULTS PRESENTATION 6
FINANCIAL RESULTS
     PETER MENDO
 CHIEF FINANCIAL OFFICER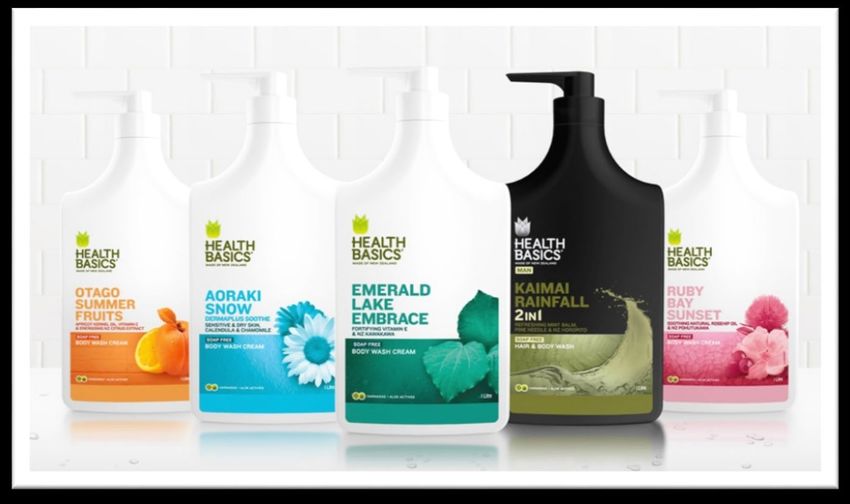
Financial overview
Underlying1 NPAT $m Underlying1 EBIT $m CODB2 (% of revenue)
10.4 10.4
54.7 91.9
54.2 90.5
87.1 10.3
51.4
FY16 FY17 FY18 FY16 FY17 FY18 FY16 FY17 FY18
IMPROVED FINANCIAL POSITION
Results achieved despite ongoing PBS Reforms and price adjustments
Continued balance sheet improvements underpinned stable result
Acquired Clearskincare and restructured costs for future benefit
CODB starting to reflect the new cost base for FY19
1 Refer to Appendix 1 for definition;
2 Underlying cost of doing business excluding depreciation and Hepatitis C
2018 FULL YEAR RESULTS PRESENTATION 8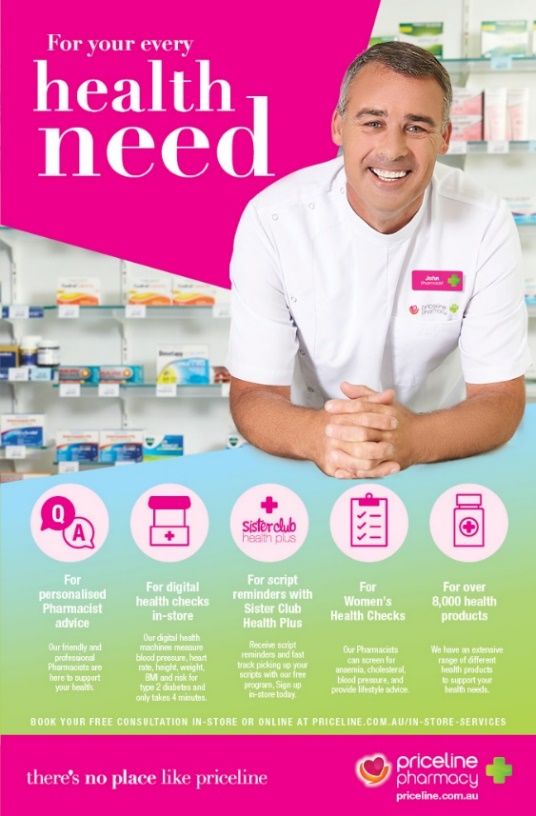
Working capital Summary FY17 1H18 FY18 Summary FY17 1H18 FY18 Trade Receivables 682 609 655 Trade Debtor Days 40.6 36.0 39.6 Inventories 399 404 395 Inventory Days 37.2 37.7 37.2 Trade Payables 805 702 775 Trade Payable Days 55.8 49.6 56.4 Net Working Capital 276 311 275 Cash Conversion Days 22.1 24.0 20.4 WORKING CAPITAL IMPROVED Cash Conversion Days improved 3.6 days to the half and 1.7 days to prior year end Consistent Working Capital results produced in a challenging environment Results reflect the seasonal business cycle with an improved position in 2H18 2018 FULL YEAR RESULTS PRESENTATION 9
Cash flow & debt
Key Metrics FY17 1H18 FY18 A$m FY17 1H18 FY18
Reported net debt $m (7.2) 25.1 55.9 Cash generated from 129.8 22.8 98.7
operations
Net debt#/(net debt + equity) (1.3%) 4.3% 9.9% Net cash from investing (27.8) (8.0) (82.3)
Net debt#/EBIT (0.1x) 0.6x 0.7x activities
Free cash 102.0 14.8 16.4
EBIT/interest 6.9x 7.0x 6.6x
Debt movement including (18.8) 19.6 59.3
leasing
Dividends paid (34.3) (17.2) (34.5)
DEBT PROGRESS AHEAD OF EXPECTATIONS
Reported net debt reflects a strong underlying position Net movement in cash 48.9 17.1 41.2
following Clearskincare acquisition before interest & tax*
Cash generated from operations reduction reflects
acquisition and restructure costs, working capital change
from Hep C
Net cash from investing includes business acquisition costs # Net debt includes annual insurance premium funding and finance leasing liabilities;
of $61.6m, capex $25.7m * As per the 4E Consolidated Statement of Cash Flows, excluding interest and tax
2018 FULL YEAR RESULTS PRESENTATION 10Capital management
Underlying1 ROE% Underlying1 ROCE% Dividend paid $m
34.5
34.3
10.29 16.89
16.54
9.78
9.58 15.49
24.4
FY16 FY17 FY18 FY16 FY17 FY18 FY16 FY17 FY18
RETURNS TO SHAREHOLDERS CONTINUE TO GROW
Strong CAGR growth across all metrics
Underlying ROE increase reflects the impact on equity of Clearskincare acquisition future payments
ROCE reduction reflects additional debt in use for acquisition
1 Refer to Appendix 1 for definition;
2018 FULL YEAR RESULTS PRESENTATION 11Capital management CAPITAL MANAGEMENT OUTLOOK Capex FY19 to be consistent with FY18 Continue to review options for the future investment in a Sydney DC Clearskincare acquisition payments will be made in September 2020 and 2021 Sufficient franking credits for future dividend payments Balance sheet capacity for ongoing flexibility 2018 FULL YEAR RESULTS PRESENTATION 12
OPERATIONAL UPDATES
     RICHARD VINCENT
  CEO & MANAGING DIRECTOR
Priceline Pharmacy
Priceline Pharmacy results
Retail Register Revenue $m Retail GP $m
1158
240
1153 239
1147 237
FY16 FY17 FY18 FY16 FY17 FY18
IMPROVED TRENDS DURING 2H18
Total network sales¹ up 2.1% to $2.11bn
Total register sales¹ (excl dispensary) up 0.4% to $1.158bn
Retail register like-for-like sales -1.1%, improved 60bp on 1H18
Retail network at 475 stores as at 31 August
Gross profit result reflects management focus
Franchise partner sentiment strengthened further on FY17
1 Refer to Appendix 1 for definition
2018 FULL YEAR RESULTS PRESENTATION 15Priceline Pharmacy - 2H improvement & strong base
STOCK & PROMOTIONAL CONTROL UNLOCKED STORE VALUE
Sales events changed to maximise Focussed teams on basket size,
profit outcome with reduced up 1.9% and loyalty card
category-wide discounting acquisitions
Improved margin management Professional service demand
and return on investment increasing with flu vaccinations
Improvements on all inventory up 50% on FY17
metrics during 2H18 with GMROI Improved terms on leases
up 10bps on 1H18 starting to emerge in 2H18
SISTER CLUB PROGRAM
CUSTOMER CONNECTION
Remains the largest health and
Status as favourite destination for beauty loyalty program in Australia
beauty for Australian women and growing
New marketing campaign to “Sister Club only” sales events
broaden appeal and action successfully implemented
Still gaining exclusives and first to Richest data for women’s
market opportunities with key purchasing behaviours in health
brands such as Bondi Sands, Kristin and beauty
Ess, Andalou, The Base Collective,
Advancing analytics to increase
Alya
effectiveness
2018 FULL YEAR RESULTS PRESENTATION 16Priceline Pharmacy evolution
REINVIGORATE PRODUCT OFFER MAXIMISE LOYALTY & DIGITAL PLATFORM
Accentuate strength of product range as a Stage 1 in mining data and trends from
destination for favourites with greater focus loyalty platform in effect
on new, exclusive and on-trend offers Increased use of targeted offers and using
Extension of key categories to take data with suppliers
advantage of growth segments Major upgrade to loyalty to commence in
Capitalise on opportunistic trends and 2H19 complemented by inventory
leverage brand strength as a one-stop- management system investment as first stage
shop for all health and beauty needs in move to click and collect
Trial “click and collect” solution during FY19
CUSTOMER FIRST CULTURE BUILD NETWORK STRENGTH
Emphasis on store execution across all Focus on right stores in right location
formats
Further improve margin and returns for
Introduction of new customer satisfaction franchise partners
measurement tool in 2019
Store opening focus to net revenue in
Increase tailoring of product selection by preference to “doors”
category by store
Continue to “land-bank” stores and convert
to pharmacies in the right location
2018 FULL YEAR RESULTS PRESENTATION 17Pharmacy Distribution
Pharmacy Distribution results
SUSTAINED PERFORMANCE IN TOUGH Distribution Revenue $m Distribution GP $m
MARKET 232
2956 228
2920 217
Underlying revenue growth of 6.4%
excluding PBS Reforms and Hepatitis C
Hep C sales decreased by $155m
Total revenue of $2.9bn down 1.2% on 2754
FY17
Despite competition pressure FY16 FY17 FY18 FY16 FY17 FY18
maintained GP margin at 7.8%
Combination of PBS changes and
exclusive direct distribution removed
more than $10m gross profit
2018 FULL YEAR RESULTS PRESENTATION 19API brand development
INVESTMENT TO GROW API-OWNED BRANDS Investment in
API-owned independent brands with scope for development and API Brands
growth
New leadership has defined market position and key opportunities for
growth 2017
New leadership and
Increased engagement with improved services, advisory committees
dedicated resources
and brand forums
Developed partnerships with service providers to accelerate complete
retail offer early in FY19 and secure increased revenue streams
2018
Developed new market
position and tactics
2019
Integrate key partnerships to
execute growth strategy
2018 FULL YEAR RESULTS PRESENTATION 20Pharmacy Distribution market MARKET DEVELOPMENTS Indicators point to stable performance and confidence in financial health of independent pharmacies Dual strategy to develop API-owned retail offers and develop partnerships with key independent groups in growth Potential for small bolt-on acquisitions to enhance market offering in adjacent services GOVERNMENT ENGAGEMENT Engagement with Department of Health, Health Minister and Pharmacy Guild has been promising PBS pricing reform impact on the sector continues price deflation Exclusive direct distribution remains inconsistent with the Federal Government’s stated National Medicines Policy CSO review expected in coming weeks 2018 FULL YEAR RESULTS PRESENTATION 21
Consumer
Brands
Consumer Brands results
Revenue $m
59
MOMENTUM WITH NEW BASELINE PERFORMANCE ESTABLISHED
Developing as a key portfolio in API future growth agenda
54
EBIT up $2.1m on FY17 with similar growth expected in FY19
Sales growth primarily from Australian OTC health product 51
growth
Broadening portfolio of high-quality low-cost products that
provides one of the strongest range offers in trans-Tasman FY16 FY17 FY18
market
GP $m
Improved product supply and range through mix of locally
manufactured and in-sourcing products 27
24
22
FY16 FY17 FY18
2018 FULL YEAR RESULTS PRESENTATION 23Consumer Brands development
KEY CHANGES FOR OUTLOOK NEXT STEP IN GROWTH
New management team in FY17 with right mix Introduction of unique formulations in OTC
of technical and leadership skills health market in FY19
Improved understanding of market Broadening product range through
requirements to become the preferred supplier agreements with reputable international
Key partnerships with international providers of partners
finished product and raw materials Expand contracts with Australian retailers for
Collaboration with local experts in Asian product supply
markets to explore growth from small base Develop the opportunity in Asian market
Focussed on strengths in product development
in toiletries plant to grow Health Basics, Only
Good brands in NZ market
2018 FULL YEAR RESULTS PRESENTATION
PRESENTATION 24Clearskincare
Clearskincare results
Revenue* $m
CLINICS TRADING TO PLAN
First stage of acquisition completed on plan at end of July 2018 39
Trading in line with business plans prior to acquisition with EBITDA 32
margins at 28%
26
Integration is bringing API capability to Clearskincare
Strengthening leadership team to accelerate business scale
Existing owners and store teams engaged with growth plans
FY16 FY17 FY18
CUSTOMER DEMAND
Customer demand remains strong for breadth of services
Opportunity to grow core treatments within existing network
capacity
Significant number of under-serviced geographical markets remain
in Australia and NZ
* Unaudited Clearskincare revenue sourced from vendor management accounts for a 12 month period ending 31 July on a 100% ownership basis
2018 FULL YEAR RESULTS PRESENTATION 26Clinic growth outlook
PREMISE UNDERLYING THE ACQUISITION AND GROWTH
Management executing according to the initial premise of
acquisition rationale
Strong position within competitive market and further upside
once operational disciplines in place API CAPABILITY CAN
ACCELERATE GROWTH
CONTINUED ROLL OUT OF Growth trajectory for services
continues
NEW CLINICS
Network expansion key to
IMPROVE UNDERLYING First tranche of stores to open further value accretion
BUSINESS PERFORMANCE in 2Q18 under company
ownership
OPERATIONAL DISCIPLINES Leveraging loyalty database Scoped sites in Australia and
TO IMPROVE ROLLOUT to increase exposure to new NZ to develop core network
customers growth plan
Developing more consistency in Ongoing marketing program
store roll out and planning expanded for existing and new
Franchise business model stores
developed for future network Using supplier relationships to
growth improve cost of doing business
2018 FULL YEAR RESULTS PRESENTATION 27FY19 Outlook
CONFIDENCE IN GROWTH PORTFOLIO
Breadth of portfolio will deliver Growth outlook
growth in FY19
Leverage existing infrastructure and market expertise
Retail trading in line with our FY19
expectation although
Evolve Priceline Pharmacy
environment remains tough Expand Build Consumer
Pharmacy offer Distribution to
Clearskincare Brands portfolio
to address deliver stable
network and and earnings
Christmas trading remains pivotal customer ROCE and cash
grow profitability contribution
changes generation
Balance sheet provides flexibility
for further capital management
Financial strength and flexibility
strategies as required
2018 FULL YEAR RESULTS PRESENTATION 28Appendix 1 ASIC
ASIC Regulatory Guide 230 Disclosing non-IFRS financial information
In December 2011 ASIC issued Regulatory Guide 230. To comply with this Guide, Australian Pharmaceutical Industries Limited is required to make a
clear statement about the non-IFRS information included in the Profit announcement and Full Year presentation for the period ending 31 August
2018.
In addition to statutory report amounts, the following non-IFRS measures are used by management and the directors as the primary measures of
assessing financial performance of the Group and Individual Segments:
Underlying Earnings before interest tax (EBIT)
Underlying Earnings before interest, tax, depreciation, amortisation (EBITDA)
Free cash
Comparable Store Growth
Underlying Return on capital employed (ROCE)
Underlying Return on Equity (ROE)
Pharmacy Growth
Underlying Pharmacy Revenue Growth
Retail register sales
Underlying NPAT
Underlying Earnings per share
The directors consider that these performance measures are appropriate for the purpose of presenting meaningful information on the underlying
drivers of the continuing business.
Many of the measures used are common practice in the industry within which Australian Pharmaceutical Industries Limited operates. The Profit
Announcement and Full Year presentation has not been audited or reviewed in accordance with Australian Auditing Standards.
2018 FULL YEAR RESULTS PRESENTATION 29Appendix 1 definitions
EBITDA - Result from operating activities before Depreciation and Amortisation
EBIT – Result from operating activities
Underlying EBIT – EBIT calculated as above without including one-off impairment or other one-off charges
Underlying NPAT – NPAT calculated with the same exceptions as underlying EBIT
Free Cash – Cash generated from operations less capital expenditure and acquisition costs. It does not include financing costs and
tax paid
Comparable Store Growth - Sales performance compared to last period for stores trading in the retail network greater than one year
Net Debt or Net Cash – Borrowings less cash on hand
Underlying Return on Capital Employed (ROCE) – Underlying EBIT/Average Total Capital Employed
Underlying Return on equity (ROE) – Underlying NPAT/Average Equity
Retail network sales – all register sales in franchise and company stores in the Priceline/Priceline Pharmacy brand, including dispensary
sales
Retail register sales – Sales recorded at the register of all network stores which excludes dispensary sales. Register sales made by
franchisees do not form part of the result of the consolidated entity
Underlying Pharmacy Revenue growth – revenue calculated on sales before any PBS price changes that occur during the course of
the year as directed by the Federal Department of Health
2018 FULL YEAR RESULTS PRESENTATION 30Appendix 3 2018 income statement $M AUD FY17 FY18 Change Revenue 4061.2 4026.3 -0.9% Gross Profit 493.6 496.7 0.7% Less Operating Costs net of other income 404.3 414.3 2.5% EBIT 89.3 82.4 -7.7% Less Financing Costs 12.9 12.4 -3.9% Less Tax Expense 24.0 21.8 -9.2% NPAT pre adjustment 52.4 48.2 -8.0% Add back business acquisition & restructure costs 1.8 6.6 226.7% Underlying NPAT 54.2 54.8 1.1% Less non controlling interests 0.0 0.1 Underlying NPAT attributable to members 54.2 54.7 0.9% 2018 FULL YEAR RESULTS PRESENTATION 31
2018 YEAR RESULTS PRESENTATION
       THURSDAY 18 OCTOBER 2018
You can also read