Age of Chicago's Homicide Victims - Institute for Policy Research
←
→
Page content transcription
If your browser does not render page correctly, please read the page content below
IPR                                    R E P O R T | | S E P T E M BE R 9 , 2 0 2 0

Age of Chicago’s Homicide Victims

               Northwestern Neighborhood & Network Initiative, Institute for Policy Research,
                                                                   Northwestern University

SUGGESTED CITATION: Northwestern Neighborhood & Network Initiative (N3). (2020, September 3). Age of Chicago’s homicide victims. Institute
for Policy Research Rapid Research Report. https://www.ipr.northwestern.edu/documents/reports/ipr-n3-rapid-research-reports-age-of-
homicide-victims-9-Sept-2020.pdf
Photo credit: Fibonacci Blue, Flickr.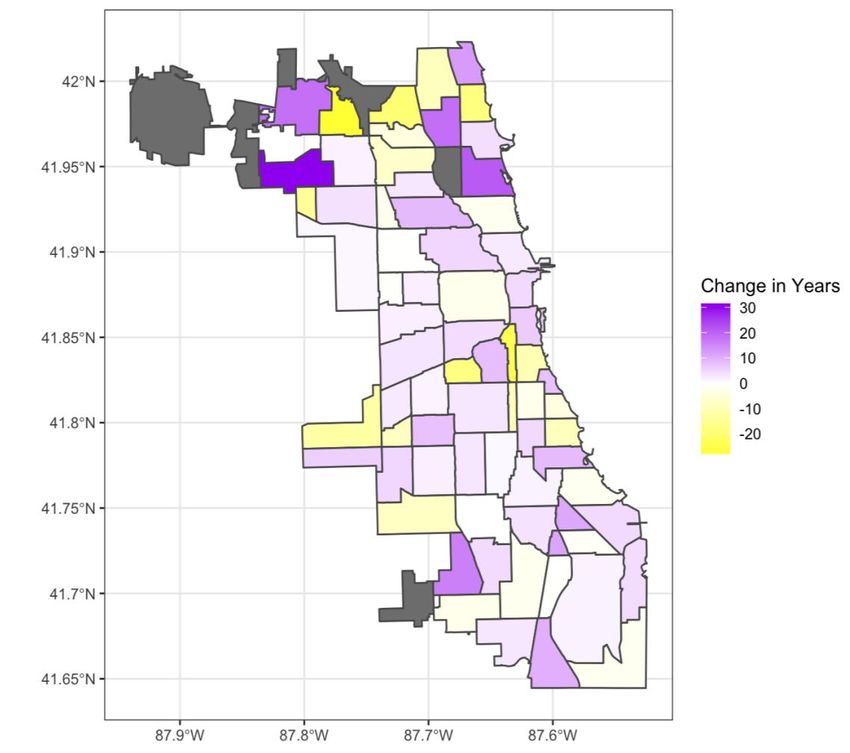
Follow @IPRatNU | www.ipr.northwestern.edu

 IPR                            R E P O R T | | S E P T E M BE R 9 , 2 0 2 0

 “Age of Chicago’s Homicide Victims”

 by the Northwestern Neighborhood & Network Initiative (N3)
 at the Institute for Policy Research, Northwestern University

Introduction

Recent media accounts have suggested that a greater number of young people have been killed in 2020 than in
recent years, pointing to a tragic number of such deaths in recent months. On June 20, 2020, a 3-year-old boy
was fatally shot while riding in the car with his father in the Austin community on Chicago’s Westside. Two hours
later, a 13-year-old girl was shot and killed just a few blocks away. A week later, on June 27, a 20-month-old boy
was shot and killed and his mother injured when a car pulled alongside them on South Halsted Street and fired
into their own vehicle. And, a group of young men who opened fire on a large Fourth of July gathering shot eight
people, killing a 14-year-old boy.

The tragic murder of young children often brings with it a sense of outrage and fear, as well as renewed calls for
the end of gun violence. In the immediate aftermath of such horrific events, politicians, the police, and violence
preventionists often scramble for ways to calm violent disputes, make public displays of solidarity, and turn to
police and other violence prevention experts to come up with ways to, literally and figuratively, “stop the
bleeding.” These moments also highlight the enduring legacy of inequality across Chicago neighborhoods, with the
same neighborhoods confronting the pain and trauma of gun violence year after year, decade after decade.

While it is the death of young people, especially children, that draws media and political attention towards the
issues of gun violence, most homicide victims in Chicago are adults. When trying to understand what can be
done to stem the flow of gun violence, it is crucial that we understand its basic age structure as some violence
prevention efforts aimed at one age group might not be available or even appropriate for those of another age
group.

This report from the Northwestern Neighborhood and Network (N3) Initiative provides a statistical analysis of
the age of homicide victims in Chicago from 1990–2019. In addition to unpacking the age distribution of victims,
i.e., the average age of homicide victims, it aims to understand how the risk of being a gunshot victim varies by
age group, race and ethnicity, and neighborhood. Understanding the risks people of different ages and from
different neighborhoods face is an essential step in helping understand the array of responses needed to reduce
gun violence.

IPR N3 Report, 9 September 2020                                                                                      1
Follow @IPRatNU | www.ipr.northwestern.edu

Executive Summary

     •     The typical homicide victim in Chicago is in their 20s: In 2019, the average (mean) age of a homicide
           victim was 29; the median age was 27.

     •     There has been very little change in the average or median age of homicide victims over the past
           decade; the median age has fluctuated between 24 and 28 years old.

     •     Chicago has seen a steady decline in the homicides of children: The number of very young homicide
           victims—those younger than 12 years old—has been declining steadily since the 1990s. Chicago has
           seen a 31.2% decrease in the proportion of homicides of children less than 18 years old and a 71.1%
           decrease in victims 12 years or younger.

     •     Young adults aged 18–24 are most at risk for becoming victims of homicide.

     •     Black Chicagoans face the highest rates of homicide victimization, followed by Latino Chicagoans.

     •     Black Chicagoans aged 18–19, the highest-risk sub-group, faced a homicide rate of 182.7 per 100,000
           residents in 2019—more than 10 times higher than the city average that year.

     •     The age of homicide victims varies by community area in Chicago. Since 2009, the age of homicide
           victims got younger in about one-third of communities.

How Old Are Chicago’s Homicide Victims?

Over the last decade, 5,669 people were victims of homicide in Chicago—and approximately 608 of them
(approximately 11%) were younger than 18 years old. This means, by and large, most of Chicago’s homicide
victims are adults.

The mean age of a homicide victim in 2019 was 29.3 years old and the median age was 27 years old.1 While
these figures have changed slightly over the last three decades, the average age has not dipped below 27 years
since 1990, and the median has never dipped below 24 years. Figure 1 depicts the 3-year moving average of the
median age of homicide victims from 1990–2020 showing this relatively stable trend.

At the height of Chicago’s homicide epidemic in the early 1990s, the median age of homicide victims was
approximately 26 years old. Since then, the median age of victims has dropped to a 3-year moving average of 24
years old in 1998 and has hovered around that age until recently. Since 2014, homicide victims have gotten slightly
older, with the 3-year moving average median age ticking up to 27 years old in 2019. So far in 2020 the trajectory

1 Mean refers to the arithmetic average of a distribution, while median refers to the middle number in a distribution. The mean is calculated by adding up

all the values and dividing that sum by the number of observations, while the median is found by identifying the value of the centermost observation.

IPR N3 Report, 9 September 2020                                                                                                                          2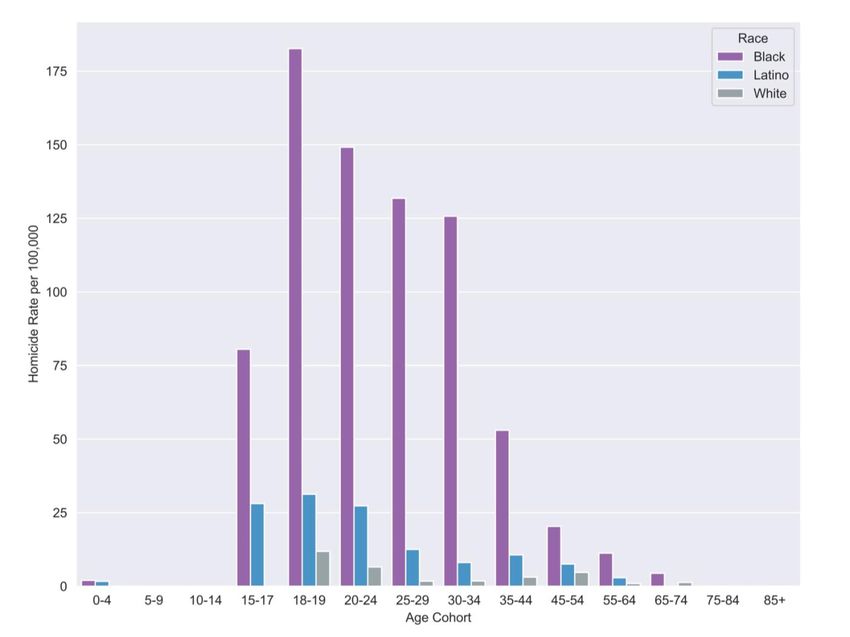
Follow @IPRatNU | www.ipr.northwestern.edu

seems mostly the same, with a median age of 27, and 3-year average median age of 27.3 years, although some
recent media accounts suggest 2020 will have a higher number of younger victims than in recent years. Between
1990 and 2020, 2018 saw the oldest homicide victims, with a median age of 28 years old. Across the past three
decades, however, the median ages of homicide victims have remained largely stable overall.

Figure 1. Median Ages of Homicide Victims, 1990–Present

IPR N3 Report, 9 September 2020                                                                                 3
Follow @IPRatNU | www.ipr.northwestern.edu

Figure 2. 3-Year Average of Median Ages of Homicide Victims, 1990–Present

How Many Children Are Killed in Chicago?

Although most homicide victims in Chicago are adults, on average, approximately 78 people under the age of 18
are killed every year in the city. The general trend is that fewer and fewer children have been killed each year—
one that seems to have continued since 1990. Figure 3 shows the 3-year moving average of the percentage of
victims younger than 18 years old and those victims who were 12 years old or younger. From 1990–2019,
Chicago has seen a general 31.2% decrease in the proportion of homicides of children younger than 18 years old
and a 71.1% decrease in the proportion of victims aged 12 or younger. In other words, there has been a steady
decline in the homicides of children.

IPR N3 Report, 9 September 2020                                                                                 4
Follow @IPRatNU | www.ipr.northwestern.edu

Figure 3. Number of Homicide Victims Under 18 and 12 Years Old, 1990–Present,
3-Year Average

Young Adults Are Still More Likely to Become Homicide Victims, Even Though Chicagoans as a Whole
Got Older

Just looking at victims’ average age can mask the risks of homicide victimization faced by people of different
ages and those from different racial and ethnic groups. To understand how the risk of homicide victimization
varies by race, ethnicity, and age, Figure 4 displays the homicide rate per 100,000 by race and age for Black,
Latino, and White Chicagoans in 2019. This figure shows the well-documented disparities in homicide risk for
Black Chicagoans of all ages (Refs. 1–4). Overall, Black young adults between 18 and 19 years old are the group
with the highest homicide risk in Chicago. In 2019, they had an annual homicide rate of 182.7 per 100,000—a
rate 10 times higher than the city average that year. Black Chicagoans aged 20–24 constituted the second-
highest group at risk, with a 2019 rate of 149.2, followed by those aged 25–29, with a 2019 rate of 131.8 per
100,000. Although the homicide rates of these highest-risk groups of Black Chicagoans vary over time, these
three age groups have constituted the highest-risk cohort between 1990 and 2020.

IPR N3 Report, 9 September 2020                                                                                   5
Follow @IPRatNU | www.ipr.northwestern.edu

In 2019, Latino Chicagoans had an overall lower level of risk across all age groups as compared with Black
Chicagoans, but it was still higher than both national averages and averages for White Chicagoans. In 2019, the
highest-risk categories for Latinos by age were:

     1. 18–19 year olds,
     2. 15–17 year olds, and
     3. 20–24 year olds.

Figure 4: Homicide Rate per 100,000 Chicago Residents in 2019 by Race and Age

IPR N3 Report, 9 September 2020                                                                                   6
Follow @IPRatNU | www.ipr.northwestern.edu
The city of Chicago has aged over time; younger people make up less of the city’s total population (Ref. 5). To
account for this change in Chicago’s age composition, Figure 5 presents the annual homicide rate within age
groups. It shows that in 2019, the age groups with the highest 3-year-average rates of homicide victimization
were:
1. 20–24 year olds,
2. 18–19 year olds,
3. 15–17 year olds, and
4. 25–29 year olds.
The homicide rate of young adults aged 18–19 in 2019 was approximately 74.3 per 100,000—a rate more than 4
times higher than the overall rate in Chicago and over 14.9 times higher than the national average. The homicide
rate of the highest-risk group (aged 20–24) in 2019 was approximately 59.7 per 100,000—a rate that is 3.3 times
higher than the overall rate in Chicago and 11.9 times higher than the national average.
Figure 5: Homicide Rate per 100,000 Chicago Residents by Age,
3-Year-Moving Average (1992–2019)2
Figure 6 depicts the risk by age group for Black Chicagoans, and Figure 7 presents the same age-specific rates for
Latino Chicagoans.
2 For raw yearly rates for this figure and those following, see the appendix.
IPR N3 Report, 9 September 2020 7Follow @IPRatNU | www.ipr.northwestern.edu Figure 6: Homicide Rate per 100,000 Black Chicago Residents by Age, 3-Year-Moving Average (1992–2019) Figure 7 also shows a shift in the structure of risk for Latino Chicagoans—homicide rates for Latino teens have decreased significantly over the past 30 years. By 2019, homicide rates for Latinos aged 15–19 had fallen to less than half of their early 1990s rates. Yet homicide rates for other Latino age groups decreased less dramatically over the same period. Additionally, Latino homicide rates still remain higher than those of White Chicagoans. Figure 7: Homicide Rate per 100,000 Latino Chicago Residents by Age, 3-Year-Moving Average (1992–2019) IPR N3 Report, 9 September 2020 8
Follow @IPRatNU | www.ipr.northwestern.edu

Neighborhood Differences

While homicide victims in some Community Areas (CAs)3 have gotten younger, in most places the average age has
actually increased. From 2009–19, the median age of homicide victims has increased in 43 areas, decreased in 28,
and stayed the same in one, with the remaining areas having too few homicides to statistically calculate reliable
metrics.4 In CAs where the homicide-victim age fell, the average decrease was 8 years younger over the last 10
years, while in places where it rose, the average was 6.5 years older over the same period. Figure 8 depicts the
increase or decrease in median age by community area over the past decade, showing that since 2009, the age of
homicide victims has increased in most com-munity areas, with greater changes in both directions seen on Chicago’s
far North Side.

Communities that saw the                Figure 8. Change in Median Age of Homicide Victims by Community Area, 2009–19, 3-
greatest decrease in age—               Year Average
places were homicide
victims were getting
younger—were Jefferson
Park and Armour Square.
These areas saw a
decrease in the median
age of homicide victims
by 28 and 24.5 years
respectively, bringing
down the average age in
these two communities
to 25 and 15.5 years—
although these large
changes are related to
the low number of overall
homicides in these
communities and, as
such, sensitive to even
the smallest changes.

Of community areas
averaging more than
three homicides a year,
Douglas and West Ridge

3 Community Areas refer to the 77 regions within the city designated by the University of Chicago Social Science Research Committee beginning in the

1920s for statistical and planning purposes. These areas often, though not always, coincide with widely recognized Chicago neighborhood boundaries.
4 We restrict our analyses to only those Community Areas that had three or more homicides between 2009 and 2019.

IPR N3 Report, 9 September 2020                                                                                                                        9
Follow @IPRatNU | www.ipr.northwestern.edu

saw the greatest decrease, with median ages decreasing by 10.3 and 9 years respectively between 2009 and 2019.
Areas that saw the greatest decreases in recent years also have some of the youngest victims.

By contrast, the community areas that saw the greatest increases in homicide victim ages in the past 10 years
were Dunning, Lake View, Lincoln Square, Norwood Park, Beverly, and Rogers Park, where the age of homicide
victims increased between 16 and 31.5 years. The majority of the neighborhoods with aging homicide victims
are located on the north side of the city. Interestingly, many of these community areas neighbor some of the
community areas that have seen some of the greatest decreases in age. Among the neighborhoods averaging
more than three homicides a year, Rogers Park and Logan Square have seen the greatest increase in age with
median ages increasing by 12.3 and 8.5 years respectively in the past decade.

Where Do We Go From Here?

The loss of a child to gun violence is simultaneously one of the most incomprehensible and consequential
challenges we face in the gun-violence epidemic. When a child is killed, the outrage and urgency to end the cycle
of violence is palpable. Too often, this outrage lends itself to calls for tough-on-crime responses that have
already proven ineffective and deeply harmful to individuals and entire communities. Gun violence is a complex
problem that requires nuanced solutions. This report details the age of homicide victims to help inform the
conversation about sustainable solutions that reflect a comprehensive and targeted approach to ending this
epidemic.

Contrary to current, popular narrative, this report finds that it is an older population that remains at highest
risk of victimization, especially the young adult population between 18 and 24 years old. This population has
needs that differ from children and youth in late adolescence, aged
16–18 (Ref. 6). In many ways, the young adult population has “aged out” of core support systems found in
schools, children and family services, parks, and other community-based programs and services. High levels of
gun violence are occurring in neighborhoods experiencing the highest levels of economic, health, and other
forms of disparities. Despite this, and the persistently high rates of victimization of young adults, the trauma
and other negative impacts this population experiences are too often ignored, leading instead to an
overreliance on a criminal justice system that, on its own, is ill-equipped to repair the harm or ensure
accountability. Indeed, young adults are disproportionately represented at every decision point in the criminal
justice system, from arrest to incarceration (Ref. 7). Yet young adulthood is also a time of opportunity. Young
adults can be more receptive to appropriate services and interventions that promote positive development
which may, in turn, lead to better social integration or reintegration and improved public safety outcomes
(Ref. 8).

IPR N3 Report, 9 September 2020                                                                                    10
Follow @IPRatNU | www.ipr.northwestern.edu

REFERENCES

     1.   Papachristos, A.V., N. Brazil, and T. Cheng. 2018. Understanding the crime gap: Violence and inequality in an
          American City. City & Community. 17(4):1051–74.
     2.   Grittiths, E. and J.M. Chavez. 2004. Communities, street guns, and homicide trajectories in Chicago, 1980–1995:
          Merging methods for examining homicide trends across space and time. Criminology. 2004;42(4): 941–78.
     3.   Papachristos. A.V., C. Wildeman, and E. Roberto. 2015. Tragic, but not random: The social contagion of nonfatal
          gunshot injuries. Social Science & Medicine. 125(1).
     4.   Wong, B., S. Bernstein, J. Jay, and M. Siegel. 2020. Differences in Racial disparities in firearm homicide across cities:
          The Role of racial residential segregation and gaps in structural disadvantage. Journal of the National Medical
          Association.
     5.   Chicago Metropolitan Agency for Planning (CMAP). 2017. Population change across age groups in the CMAP
          region.
     6.   National Academies of Sciences, Engineering, and Medicine. 2019. The promise of adolescence: Realizing
          opportunity for all youth. Washington, D.C.: National Academies Press. https://doi.org/10.17226/25388
     7.   Loyola University Center for Criminal Research Policy, and Practice. 2019. Issue brief: Emerging adults and the
          Illinois Criminal Justice System. Chicago, IL: Loyola University of Chicago.
     8.   Schiraldi V.N., B.P. Western, and K. Bradner. 2015. Community-based responses to justice-involved young adults.
          New Thinking in Community Corrections Bulletin. Washington, D.C.: National Institute of Justice, U.S. Department
          of Justice.

IPR N3 Report, 9 September 2020                                                                                                  11
Follow @IPRatNU | www.ipr.northwestern.edu The Northwestern Neighborhood & Network Initiative (N3) promotes new ways for faculty, experts, and students at Northwestern University’s Institute for Policy Research to engage communities, civic partners, and policymakers to address core problems facing the residents of Chicago and surrounding communities. Specific projects and types of engagement will be linked by a focus on how the social relationships among networks, geographic communities, and the constellation of groups, organizations, and civic partners affect what we feel, think, and do—and how understanding, building, and leveraging this sort of network-thinking can improve neighborhoods, the city, and our region. N3 Report Contributors: Jess Robinson, Research Data Analyst Ava Cheevers, Undergraduate Research Fellow Soledad McGrath, Executive Director and IPR Research Professor Andrew Papachristos, Faculty Director, Professor of Sociology, and IPR Fellow Acknowledgements: N3 would like to thank George Wood, James Murphy, Christine Percheski, and Suzanne McLone for their comments on this work. For more information about this report or N3, please contact Andrew Papachristos at avp@northwestern.edu. Follow N3 on Twitter @N3Initiative. IPR N3 Report, 9 September 2020 12
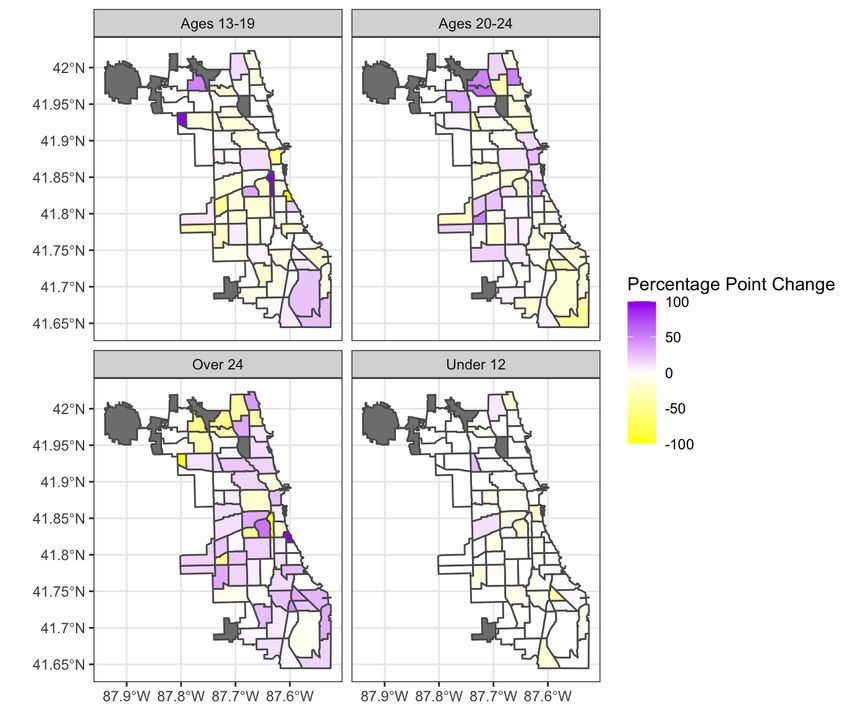
Follow @IPRatNU | www.ipr.northwestern.edu

APPENDIX

Figure A1. Change in Percent of Homicide Victims Within Certain Age Groups (2009–19),
3-Year Average

IPR N3 Report, 9 September 2020                                                         13
Follow @IPRatNU | www.ipr.northwestern.edu

Table A1. Change in Median Age of Victims (2009–19), 3-Year-Moving Average
Among Community Areas with Younger Victims

 Community Area                 Median Age in 2009 Median Age in 2019    Change in Median Age

 Jefferson Park                              53.0                 25.0                   -28.0

 Armour Square                               40.0                 15.5                   -24.5

 North Park                                  43.5                 24.0                   -19.5

 McKinley Park                               40.0                 22.3                   -17.7

 Edgewater                                   42.7                 25.0                   -17.7

 Montclare                                   32.0                 17.5                   -14.5

 Garfield Ridge                              40.0                 27.5                   -12.5

 Douglas                                     36.7                 26.3                   -10.3

 Fuller Park                                 38.2                 28.7                    -9.5

 West Ridge                                  39.0                 30.0                    -9.0

 Hyde Park                                   41.0                 32.3                    -8.8

 West Elsdon                                 39.0                 30.7                    -8.3

 Ashburn                                     32.3                 24.3                    -8.0

 Irving Park                                 38.5                 31.5                    -7.0

 Albany Park                                 26.2                 21.8                    -4.4

 Kenwood                                     41.3                 37.2                    -4.2

 Hermosa                                     25.0                 22.3                    -2.8

 Morgan Park                                 30.3                 27.7                    -2.7

IPR N3 Report, 9 September 2020                                                                  14
Follow @IPRatNU | www.ipr.northwestern.edu

 Near West Side                              30.2   27.7   -2.5

 Grand Boulevard                             28.5   26.0   -2.5

 Roseland                                    29.0   26.7   -2.3

 South Shore                                 26.7   24.7   -2.0

 Hegewisch                                   24.5   22.5   -2.0

 Lincoln Park                                26.5   24.7   -1.8

 Calumet Heights                             31.5   30.5   -1.0

 West Garfield Park                          25.3   24.7   -0.7

 Pullman                                     34.8   34.3   -0.5

 Humboldt Park                               28.2   27.8   -0.3

IPR N3 Report, 9 September 2020                                   15
You can also read