Climatological Context for California's Ongoing Drought

Page created by Jill Alvarado
 
CONTINUE READING
Climatological Context for California's Ongoing Drought
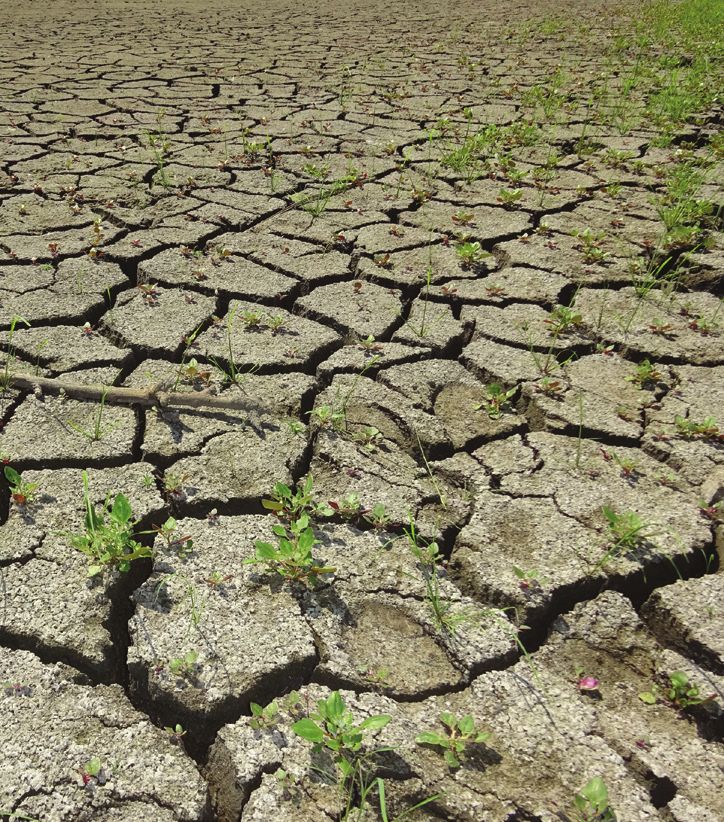
Climatological Context for California’s Ongoing Drought
    John Abatzoglou

    Back-to-back hot-dry years have                     some cases, these droughts have cata-       20th century average. Record-setting
    left California parched. By late                    lyzed adaptation responses, as well as      warmth, combined with dry condi-
    summer of 2021, half of California                  mitigation efforts, to provide a buffer     tions, allowed for an extra 3–4 inches
    found itself in an exceptional                      against future droughts. Nonetheless,       of evaporative demand (the amount
    drought. I review the climatic                      recent drought impacts have mate-           of potential moisture pulled by the
    factors that led us into this deficit               rialized in diverse sectors including       atmosphere from a well-watered land
    and provide its context relative to                 widespread tree mortality in the Sierra     surface, sometimes referred to as
    some of the state’s most notorious                  Nevada, rapid groundwater deple-            potential evapotranspiration) rela-
    droughts. Increasing atmospheric                    tion that has resulted in dry wells and     tive to average levels for the late 20th
    thirst, together with climate change,               agricultural challenges in the Central      century.
                                                        Valley, and combined low-flows and
    has arguably supercharged recent                                                                These conditions set the stage for
                                                        warm river temperatures decimating
    droughts, including California’s                                                                moisture-starved soils and vegeta-
                                                        salmon populations in the rivers of
    ongoing drought.                                                                                tion with the commencement of the
                                                        Northern California. The ongoing
                                                                                                    2021 water year. The storm track
                                                        drought presents another stress test
                                                                                                    door remained sealed through early
                                                        for the state and likely will facilitate
                                                                                                    November, as the jet stream that is a
                                                        further adaptation plus mitigation
                                                                                                    highway system for storms remained
                                                        efforts for future droughts.
                                                                                                    well north of the state. A few meager
                                                        The Ongoing Drought                         storms visited the state throughout the
                                                                                                    winter. Davis, California saw only 16
                                                        When did the ongoing drought
                                                                                                    days with meaningful precipitation
                                                        start? A historic multi-year drought
                                                                                                    (daily totals of at least a tenth of an
                                                        commenced during the 2012 water
                                                                                                    inch)—tying a water-year record for
                                                        year (October 2011–September 2012).
                                                                                                    futility with the infamous 1977 water
                                                        Several studies showed that the multi-
                                                                                                    year. Notably absent were strong
                                                        year drought was not only the most
                                                                                                    atmospheric rivers. The presence or
                                                        extreme in the modern climate record
                                                                                                    absence of atmospheric rivers can
                                                        but also the most extreme in at least
                                                                                                    make or break a water year, as such
                                                        the last 1,200 years based on tree-ring
                                                                                                    events contribute up to 50% of the
                                                        data. Although the state had a couple
                                                                                                    annual precipitation in parts of the
     The Sacramento basin had the lowest                of very wet years in 2017 and 2019
                                                                                                    state. A moderate atmospheric river
     precipitation and highest evaporative              that ameliorated drought impacts
     demand in the past four decades for the                                                        in late January brought solid precipi-
                                                        (e.g., reservoir levels), it is debatable
     2021 water year.                                                                               tation totals along the central Califor-
                 Photo credit: Juan A. Salgado/         as to whether a couple of wet years
                                                                                                    nia coast and into the central Sierra
                              Shutterstock.com          “ended” the drought based on other
                                                                                                    Nevada. This system brought signifi-
                                                        lagging indicators such as ground-
                                                                                                    cant lower-elevation snowfall accumu-
    California’s climate is defined by                  water levels and vegetation mortality.
                                                                                                    lations, with locations like Calaveras
    wild year-to-year variability in pre-               For this writeup, I will focus on the
                                                                                                    Big Tree State Park receiving a record
    cipitation. An average water year in                ongoing drought beginning with the
                                                                                                    76.5 inches of snowfall in a three-day
    terms of accumulated precipitation                  2020 water year.
                                                                                                    period. This event softened the mount-
    is quite rare in California. Many of
                                                        The 2020 water year was dry and hot.        ing precipitation deficits in the San
    the state’s ecosystems are adapted to
                                                        Statewide precipitation was 68% of          Joaquin basin.
    such volatility. Further, state infra-
                                                        20th century averages, with higher
    structure—including reservoirs and                                                              A persistent ridge of high pressure
                                                        deficits in the Sacramento basin (60%
    water conveyance systems—has                                                                    in the northeastern Pacific kept the
                                                        of average). The state had its warm-
    been designed to cope with historical                                                           storm track well north of the state,
                                                        est April–September since 1895, with
    droughts. Recent droughts, however,                                                             and continued through the remainder
                                                        temperatures nearly 3.5ºF above the
    have tested many of these systems. In                                                           of the winter. By the end of March,

2   Giannini Foundation of Agricultural Economics, University of California
Climatological Context for California's Ongoing Drought
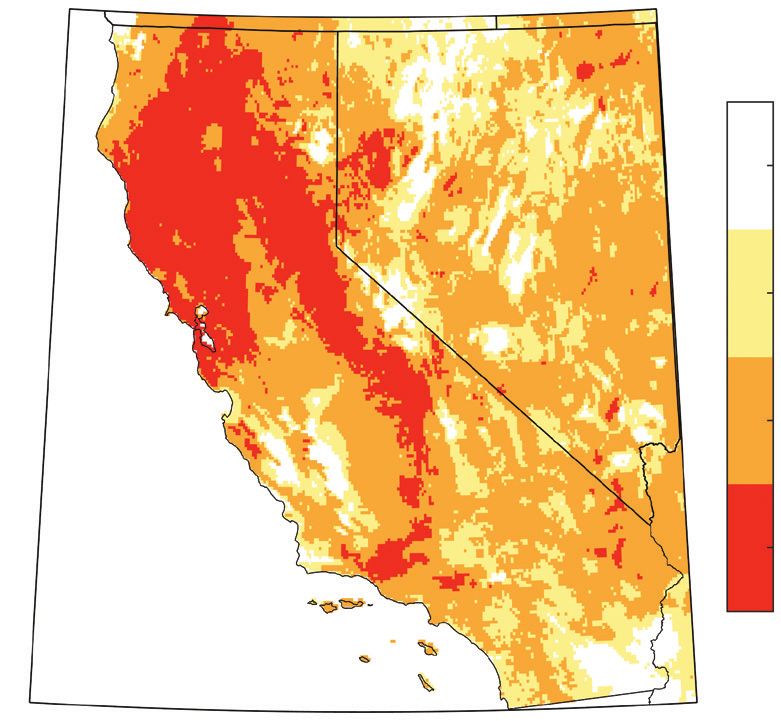
Figure 1. Temperature and Precipitation Rankings for Water Year 2021

                California—Precipitation                                                  California—Mean Temperature
             October–March 2021 Percentile                                                October–March 2021 Percentile
  42oN                                                                     42oN
                                                    Record                                                                        Record
                                                    Wettest                                                                       Warmest

                                                    Much Above                                                                    Much Above
  40oN                                              Normal                 40oN                                                   Normal
                                                    Top 10%                                                                       Top 10%
                                                    Above                                                                         Above
                                                    Normal                                                                        Normal
  38oN                                              Top 33%                38oN                                                   Top 33%

                                                    Near Normal                                                                   Near Normal

  36oN                                              Below                  36oN                                                   Below
                                                    Normal                                                                        Normal
                                                    Bottom 33%                                                                    Bottom 33%
                                                    Much Below                                                                    Much Below
  34oN                                              Normal                 34oN                                                   Normal
                                                    Bottom 10%                                                                    Bottom 10%

                                                    Record Driest                                                                 Record
                                                                                                                                  Coldest
  32 N
     o                                                                     32 N  o

         124oW 122oW   120oW   118oW   116oW                                         124oW 122oW   120oW   118oW   116oW

                California—Precipitation                                                 California—Mean Temperature
              April–August 2021 Percentile                                               April–August 2021 Percentile
  42oN                                                                    42oN
                                                    Record                                                                       Record
                                                    Wettest                                                                      Warmest

                                                    Much Above                                                                   Much Above
  40oN                                              Normal                40oN                                                   Normal
                                                    Top 10%                                                                      Top 10%
                                                    Above                                                                        Above
                                                    Normal                                                                       Normal
  38oN                                              Top 33%               38oN                                                   Top 33%

                                                    Near Normal                                                                  Near Normal

  36 N
    o
                                                    Below                 36 N
                                                                             o
                                                                                                                                 Below
                                                    Normal                                                                       Normal
                                                    Bottom 33%                                                                   Bottom 33%
                                                    Much Below                                                                   Much Below
  34oN                                              Normal                34oN                                                   Normal
                                                    Bottom 10%                                                                   Bottom 10%

                                                    Record Driest                                                                Record
                                                                                                                                 Coldest
  32oN                                                                    32oN
         124oW 122oW   120oW   118oW   116oW                                         124oW 122oW   120oW   118oW   116oW

Note: (Top row) Rankings of October 2020–March 2021 cumulative precipitation and mean temperature relative to the 1895–2021 period.
(Bottom row) Rankings of April 2021–August 2021 cumulative precipitation and mean temperature relative to the 1895–2021 period.
Source: West Wide Drought Tracker. Available at http://www.wrcc.dri.edu/wwdt/.

most of the state had well below-av-            winter temperatures. By early April,                   Spring continued the streak of months
erage water-year precipitation, with a          nearly all of the state was in drought—                with below-normal precipitation.
few isolated locations in Ventura and           per the U.S. Drought Monitor—with                      Record low April–August precipita-
Marin counties having their driest              about 5% in exceptional drought.                       tion was seen for much of the western
start to a water year since at least 1895       Snowpack decreased rapidly in April,                   slopes of the Sierra Nevada northward
(Figure 1). Autumn and winter tem-              with the onset of anomalously warm                     into the Klamath basin (Figure 1). Just
peratures were warm, but not unusual            temperatures. Unfortunately, the                       as the storm track door opened late in
in the context of the past couple               decrease in spring snowpack was                        autumn, it closed early in the spring.
decades for the state. Consequentially,         not well reflected in spring stream-                   Statewide, the 2021 water year was the
late winter snowpack (60% of average)           flow, leading to a sizable reduction                   third driest since 1895 and the driest
largely reflected precipitation deficits.       in state water resource allocations. It                since 1977—receiving about half of
The snow drought was not as acute as            is hypothesized that snowmelt infil-                   the 20th century average rainfall (47%
in recent winters, such as water year           tration into parched soils reduced the                 of average in the Sacramento basin).
2015 that saw below-normal mountain             amount of water available for runoff.                  Cumulative precipitation deficits since
precipitation and extremely warm
                                                                                 Giannini Foundation of Agricultural Economics, University of California   3
Climatological Context for California's Ongoing Drought
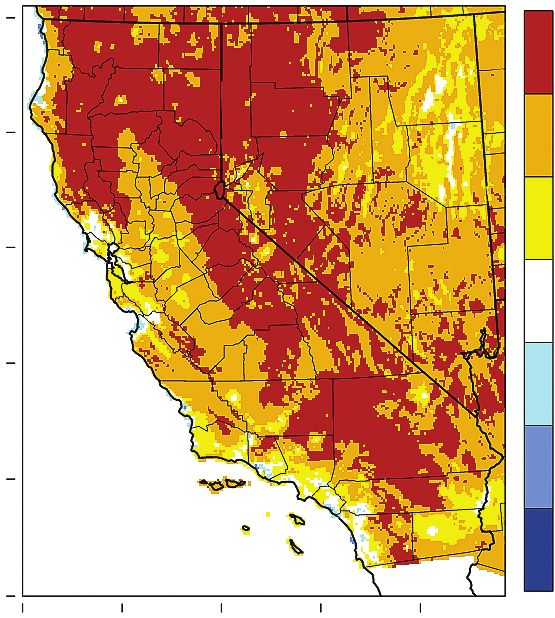
Figure 2. Drought Rankings for Water Year 2021

     a. Rankings of July 2021 PDSI Relative to                                                     b. Scatterplot of Water Year Precipitation and Evaporative
     the 1895–2021 Period of Record.*                                                              Demand for the Sacramento Basin for 1980–2021.
                                                                                                                          62

                                                                                 Water Year Evaporative Demand (Inches)
                                                                                                                                                       1980–2011, 2016–2019
                                                                                                                          60
                                                                                                                                                       2012–2015
                                                              Other                                                       58                           2020
                                                                                                                          56
                                                                                                                                                       2021

                                                              Bottom 25                                                   54

                                                                                                                          52
                                                              Bottom 10
                                                                                                                          50

                                                                                                                          48
                                                              Lowest
                                                                                                                          46

                                                                                                                          44
                                                                                                                            10    20     30      40     50   60      70
                                                                                                                                 Water Year Precipitation (Inches)
     Note: *Red denotes the lowest PDSI on record, with orange and yellow denoting PDSI values in the lowest 10 and 25 years on record, respectively.
     Source: West Wide Drought Tracker, gridMET. Available at: http://www.wrcc.dri.edu/wwdt/.

    October 2019 have left parts of the                 A combination of dry conditions and                                                   1895—highlighting the important role
    state missing more than a year’s worth              low cloud cover in spring, and record-                                                of extreme evaporative demand in
    of precipitation. Such numbers have                 setting summer temperatures, were                                                     21st century droughts.
    been reflected in low—and in some                   responsible for a very thirsty atmo-
                                                                                                                                              Another way to benchmark the
    cases record-low (Oroville)—reservoir               sphere. This exceptional atmospheric
                                                                                                                                              ongoing drought is to contextualize
    levels by late summer.                              thirst has further taxed sparse soil
                                                                                                                                              water-year precipitation and annual
                                                        and vegetative moisture, allowing for
    Some have viewed drought as being                                                                                                         evaporative demand, given their
                                                        worsening drought conditions.
    entirely driven by precipitation short-                                                                                                   combined influence on drought.
    falls. This view presumes little change             Benchmarking the Ongoing                                                              Constraining the period of analysis to
    in drought in California after April,               Drought                                                                               water years 1980–2021, and focusing
    given the nominal precipitation that                                                                                                      on the Sacramento basin, we see a
                                                        Where does this drought rank rela-
    falls from May–September. However,                                                                                                        moderate negative correlation sug-
                                                        tive to many of the state’s infamous
    the data do not bear out that view.                                                                                                       gesting that high-demand years tend
                                                        droughts? The answer depends on
    Between early May and late August,                                                                                                        to co-occur with low-precipitation
                                                        how we define drought. Based on
    the percent of the state in exceptional                                                                                                   cool seasons (Figure 2b). Water year
                                                        the Palmer Drought Severity Index
    drought rose from 5% to nearly 50%.                                                                                                       2021 was unique: it was both the
                                                        (PDSI)—a widely used drought index
    Drought isn’t defined solely by water                                                                                                     driest water year and had the highest
                                                        that tracks normalized soil moisture
    supply. The demand side can be                                                                                                            demand for the Sacramento basin
                                                        anomalies based on precipitation
    particularly important. Climate-based                                                                                                     of any year in the past four decades.
                                                        and evaporative demand—July 2021
    drought monitoring typically consid-                                                                                                      Water year 2020 was close behind—it
                                                        values set records for much of North-
    ers some type of demand in addition                                                                                                       was the third driest water year and
                                                        ern California (Figure 2a). Most of the
    to precipitation.                                                                                                                         had the third highest demand. Both
                                                        rest of the state had PDSI values in
                                                                                                                                              years were drier and had higher
    Significant increases in evaporative                the ten driest years; conditions in 2014
                                                                                                                                              demand than any two consecutive
    demand have been observed across                    were more acute in the San Joaquin
                                                                                                                                              years in the 2012–2015 drought.
    California and much of the western                  and Tulare basins. PDSI values for the
    United States over the past several                 Sacramento basin during July 2021                                                     Furthermore, while the 1976 and 1977
    decades. Evaporative demand in                      were the lowest since at least 1895—                                                  water years had similar cumulative
    2021 for much of Northern California                topping individual values during the                                                  precipitation deficits to the 2020 and
    is the highest it has been in at least              2012–2015 period. By comparison,                                                      2021 water years, evaporative demand
    the last four decades—over 8 inches                 water-year precipitation for the Sacra-                                               during the current, ongoing drought
    above the late 20th century average.                mento basin was the third lowest since                                                is at least 4 inches higher. A hallmark

4   Giannini Foundation of Agricultural Economics, University of California
Climatological Context for California's Ongoing Drought
of recent droughts is the acute atmo-       seasonal drying of soils and vegeta-          Suggested Citation:
spheric thirst tied to the shifting base-   tion in montane environments, and an          Abatzoglou, John. 2021.
lines of temperature and evaporative        advancement in the timing of runoff           “Climatological Context for
demand. Increased atmospheric thirst        that further decouples water supply           California’s Ongoing Drought.”
not only depletes soil and vegetated        and demand in California’s Mediter-           ARE Update 25(1): 2–5. University of
moisture in natural lands, but can          ranean climate. The latter acts as a tax      California Giannini Foundation of
also translate into increased irrigation    on the surface water balance—like             Agricultural Economics.
demands for agricultural lands.             adding a couple of extra straws to a
                                            drink. Whereas in wet years, an extra
Influence of Human-Caused                   couple of straws sucking surface water        Author’s Bio
Climate Change                              may have negligible impacts, the extra        John Abatzoglou is an associate
                                            straws pulling from the half-empty            professor in the Department of
Can we blame this drought on climate
                                            glasses we experience in dry years            Management of Complex Systems
change? Not exactly. The predomi-
                                            intensifies impacts.                          at UC Merced. He can be reached at
nant driver of droughts in California
is shortfalls in precipitation—some-        Studies estimate that human-caused            jabatzoglou@ucmerced.edu.
thing inherent to the state’s climate.      warming made the 2012–2015 drought
Yet, there is mounting evidence to          in California approximately 8–27%
suggest that climate change has                                                            For additional information, the
                                            worse. Furthermore, studies show
increased evaporative demand and                                                           author recommends:
                                            that human-caused climate change
supercharged droughts. The state            has effectively doubled the severity of        Abatzoglou, J.T., D.J. McEvoy, and
has warmed nearly 3ºF over the past         the “megadrought” that the broader             K.T. Redmond. 2017. “The West
five decades, consistent with changes                                                      Wide Drought Tracker: Drought
                                            southwestern United States has been
simulated by climate models forced by                                                      Monitoring at Fine Spatial Scales.”
                                            in since the turn of the century—turn-
                                                                                           Bulletin of the American Meteorological
known human activity (i.e., human-          ing a significant long-term drought            Society 98(9): 1,815–1,820. Available
caused greenhouse gas emissions).           into potentially the worst in at least         at: https://wrcc.dri.edu/wwdt/.
                                            1,200 years. Given the elevated evapo-
Changes in precipitation are less clear.                                                   Williams, A.P., J.T. Seager, J.T. Abat-
                                            rative demand in the two most recent
There is a non-significant decline in                                                      zoglou, B.I. Cook, J.E. Smerdon, and
                                            years, it is likely that human-caused
annual precipitation over the past                                                         E.R. Cook. 2015. “Contribution of
                                            climate change has its fingerprints on
century, yet this decline is entirely due                                                  Anthropogenic Warming to Cali-
                                            the ongoing drought.
to the past decade that has been punc-                                                     fornia Drought During 2012–2014.”
tuated by severe drought. We observe        Conclusion                                     Geophysical Research Letters 42:
declines in autumn precipitation and a                                                     6,819–6,828.
delayed onset of seasonal precipitation     As we end the 2021 water year, the
                                                                                           Williams, A.P., E.R. Cook, J.E. Smer-
that result in a seasonal compression       question that we all want to know
                                                                                           don, B.I. Cook, J.T. Abatzoglou, K.
of the wet season. Several generations      is when this drought will end. The
                                                                                           Bolles, S.H. Baek, A.M. Badger, and
of climate models agree on one thing        state may play host to a conga line of         B. Livneh. 2020. “Large Contribution
regarding changes in precipitation          drought-busting atmospheric rivers             from Anthropogenic Warming to an
for the state: they agree to disagree.      this upcoming winter or may be left            Emerging North American Mega-
While climate models do not suggest         high and dry. Improvements in sub-             drought.” Science 368(6488): 314–318.
any robust changes in annual precip-        seasonal-to-seasonal forecasting may
itation, they show a tendency for less      help aid in seasonal water-resource
precipitation in the shoulder seasons       decision making. The long-term
of spring and autumn and more pre-          prospects suggest further increases
cipitation in mid-winter.                   in evaporative demand with a warm-
                                            ing climate that will tilt the odds for
A few studies have quantified the           acute drought conditions similar to
influence of human-caused climate           the ongoing drought. This aridifica-
change on recent extreme droughts           tion will not be without wet and very
in California and the broader south-        wet years. The optimist in me hopes
western United States. Warming exerts       the upcoming water year will be one
direct control on the mountain snow-        of these wet years and bring some
pack storage efficiency and evapora-        reprieve to the ongoing drought. The
tive demand. The former results in          pessimist in me says we should pre-
reduced spring snowpack, hastened           pare for lean years ahead.

                                                                     Giannini Foundation of Agricultural Economics, University of California   5
Climatological Context for California's Ongoing Drought Climatological Context for California's Ongoing Drought
You can also read