Hydrochemical Classification of Fonte Discharge, Vagos, Portugal - Kyle N. Horner
←
→
Page content transcription
If your browser does not render page correctly, please read the page content below
Hydrochemical Classification of Fonte Discharge,
               Vagos, Portugal

   Kyle N. Horner      Jessica Thomas       Bastiaan de Veen

                    Amsterdam, March 2007
Contents
1 Background 2
1.1 Introduction . . . . . . . . . . . . . . . . . . . . . . . . . . . . . 2
2 Research area 4
2.1 Introduction . . . . . . . . . . . . . . . . . . . . . . . . . . . . . 4
2.2 Topography . . . . . . . . . . . . . . . . . . . . . . . . . . . . . 4
2.3 Soils . . . . . . . . . . . . . . . . . . . . . . . . . . . . . . . . . 4
2.4 Vegetation and Land use . . . . . . . . . . . . . . . . . . . . . . 5
2.5 Climate . . . . . . . . . . . . . . . . . . . . . . . . . . . . . . . 5
2.6 Hydrology . . . . . . . . . . . . . . . . . . . . . . . . . . . . . . 6
3 Methods 7
4 Results 8
5 Discussion 10
6 Conclusions and recommendations 12
A Site Location Plan 14
B Fonte Location Description 17
C Analytical Results 20
2Abstract This report summarizes the findings of the 2006 water quality assessment of forty fonte in the area of Vagos, Portugal. Select water samples are analyzed for ma- jor and minor ions as well as dissolved compounds associated with agricultural activities. The water samples are characterized based on major ion composition and compared to samples taken in 2005, and the accuracy of the field screening technique used to determine dissolved nitrate concentration is discussed.
Chapter 1

Background

1.1 Introduction
Geological conditions in the area of Vagos, Portugal give rise to numerous fresh-
water springs (fonte) discharging from shallow unconfined groundwater aquifers.
While the municipal water supply is currently extracted from deep (>80m) con-
fined aquifers, many of these fonte were historically developed into public water
supply points for residents of the rural communities surrounding Vagos, where
some fonte are still in use.
    The dominant land use in these rural communities is agriculture. Due to their
shallow and unconfined nature, the aquifers that discharge through the fonte are
susceptible to impacts from the agricultural activities that take place in the area.
    In the summer of 2005, at the request of the Camara Municipal de Vagos,
graduate students from the Vrije Universiteit began a long-term hydrochemical
assessment of water discharging from these springs, with emphasis placed on de-
termining the extent of agricultural impacts on water quality in the shallow aquifers
(Gijsbertsen et al. [2006]). The objectives of the study are to:

   • Locate and map active and disued fonte locations;

   • Quantify fonte discharge at each location;

   • Conduct field measurement of parameters such as pH, electrical conductivity
     (EC) and nitrate (NO−
                         3 );

   • Collect samples of fonte discharge for laboratory analysis; and,

   • Classify fonte with regards to their suitability for drinking water supply.

    Eleven of the thirty fonte sampled during the 2005 investigation contained
NO−
  3 concentrations  in equal to or greater than the World Health Organization
(WHO) drinking water quality guideline of 50mg l−1 [WHO, 2004]. The 2006
investigation was conducted to expand the number of fonte included in the study,

                                         2
and to provide supplemental data for the 2005 assessment in order to determine
trends apparent in fonte water quality.
3Chapter 2
Research area
2.1 Introduction
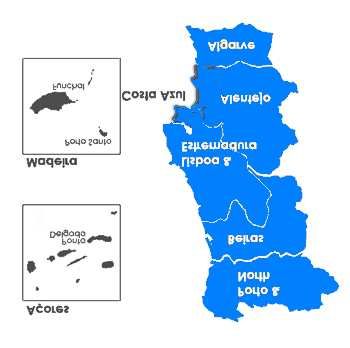
Vagos is located in the Beiras region of Portugal, 75km south-southwest of Porto
(Figure A.1, Appendix A). The study area includes the catchments of the the
Ribeiro das Mesas, Ribeira da Presa Velha, and Ribeiro do Tabuaço, which join
the Rio Boco before ultimately discharging into the Ria de Aveiro, located along
the Atlantic coast 20 km to the north-northwest (Figure A.2, Appendix A).
The study area extends over 120km2 and is covered with Quaternary sedimen-
tary deposits of varying thickness which are frequently incised by rivers, expos-
ing the underlying Cretaceous clay and marl units. Groundwater contained in the
Quaternary unit is frequently used for domestic and agricultural water supply, ev-
idenced by the numerous open wells (Poço or Nora) in the study area. Due to the
permeability of these sediments, surface water and shallow groundwater resources
in the catchment are vulnerable to variations in precipitation and intensity of land
use. To determine the influence of these factors on fonte discharge quantity and
quality, a monitoring and sampling program was undertaken between 1 June and
23 June 2006.
2.2 Topography
The study area slopes gently, dipping from a maximum elevation of 70m above
mean sea level (a.s.l.) at the southern border of the study area to almost 0m a.s.l.
at Vagos in the north. The regional slope is consistent at less than 1.0% except
where rivers and streams have incised the geological units. In these areas, steeper
localized slopes dip toward the rivers.
2.3 Soils
The study area consists of intermittent Holocene eolian and fluvial sands blanketing
Quaternary sedimentary deposits, both of which unconformably overlie Cretaceous
4clay deposits.
The Holocene deposits consist of sands transported by wind and water, and
are most prevalent in areas of topographic relief (such as river valleys) or vege-
tative cover (such as the edge of pine or eucalyptus forests). Holocene deposits
encountered in the study area had a maximum thickness of 2m.
The unconsolidated Quaternary sediments consist of unstructured fine sands
and silts in deposits up to 20m thick, and are frequently incised by the various
streams in the study area.
In regions where road construction or streams have removed sufficient sedi-
ment, outcrops of the underlying Cretaceous clay unit may be observed. The Cre-
taceous clay unit extends more than 80m below the base of the Quaternary layer
and forms the effective base of the study area.
2.4 Vegetation and Land use
Agriculture is the dominant activity in the study area, with small-scale farms present
in most areas where Quaternary sediments are at the surface. Typical crops include
maize, grapes, cabbage, potato and other market vegetables.
Increasingly, areas not suitable for market agriculture are being developed as
eucalyptus plantations by the pulp and paper industry. Eucalyptus plantations are
often on land adjacent to, or formerly covered by, pine forests. The indirect result is
that much of the pine forests in the catchment are now mixed pine and eucalyptus.
Irrigation water for much of the agriculture in the area is extracted from the
shallow, Quaternary aquifer via open well poço and nora. Surplus fertilizer applied
to crops is sometimes dissolved and transported through the soil into the shallow
aquifer in a cycle called irrigation return flow, resulting in localized increases in
the concentration of fertilizer constituents such as NO−3 in the shallow groundwater
throughout the study area (Horner et al. [2006], Thomas et al. [2006], Geris et al.
[2006]).
The remainder of the area not occupied by farms or forest is low-density urban
development, with low grasses and personal gardens distributed throughout.
2.5 Climate
The study area receives an average of 950mm of precipitation annually. Precipi-
tation in the study area has strong seasonal trends with significant rains during the
winter and little precipitation in the summer.
Average temperature in the study area is 15◦ C, ranging from an average low
temperature of 5◦ C in January to an average high temperature of 29◦ C in August.
Annual climatic variation has been pronounced in recent years, as Portugal suf-
fered a severe drought in 2005 followed by average precipitation and temperatures
through the first six months of 2006.
52.6 Hydrology
The study area has two hydrological regions, distinguished based on surficial ge-
ology. In the eastern region the low permeability Cretaceous clay and marl forma-
tions are near the surface and the water-bearing Quaternary unit only occurs as an
intermittent veneer or blanket. Due to the presence of the low-permeability Creta-
ceous units near the surface there is an extensive surface water drainage network.
In the western region the permeable Quaternary deposits are much thicker, giv-
ing rise to the extensive shallow aquifers used for agricultural irrigation. Due to the
permeable nature of the shallow units in the western region there is little surface
water, with discharge primarily through groundwater fed channels and, to a lesser
extent, fonte which occur in locations where the Quaternary–Cretaceous interface
is exposed.
Due to precipitation and drainage characteristics a majority of channels in the
study area are ephemeral, with water present during the summer months only in
major channels. Small lakes are present in the southwest of the study area, situated
in local depressions underlain by the low-permeability Cretaceous unit. The stag-
nant water in the lakes is subject to significant evapotranspiration in the summer
months.
6Chapter 3
Methods
Attempts were made to locate and sample the thirty fonte analyzed in the 2005
report. An additional ten fonte identified from topographical maps and field inves-
tigation were monitored and sampled for the first time during this investigation. A
summary of fonte locations and coordinates is presented in Table B, Appendix B.
Water samples were collected from all fontes discharging during the field pro-
gram. Samples collected for general parameter analysis were bottled using a pre-
cleaned, 100mL plastic container. Cation samples were field-filtered using a 50mL sy-
ringe fitted with a 0.45µm in-line filter (Schleiche and Schuell, Germany) and
placed in a 50mL plastic container then preserved using concentrated HNO3 . 10mL of
unfiltered water was placed in a pre-cleaned plastic vial for anion analysis, and
50mLof unfiltered water was placed in an air-tight amber glass bottle for the anal-
ysis of stable isotopes.
All samples collected for laboratory analysis were placed in an ice-filled cooler
immediately after sampling, and were stored in a refrigerator before being pack-
aged for shipment to the VU for analysis.
EC, pH, temperature and NO− 3 concentrations of the water samples were mea-
sured in the field using portable field equipment. EC of water samples was mea-
sured using a portable electronic EC meter (Greisinger electronic, GMH 3410, Ger-
many) calibrated to a standard solution of 1413 µS cm−1 . For samples with EC
greater than 75 µS cm−1 , pH was measured using a portable electronic pH meter
(Sentron, ARGUS type, Netherlands) calibrated daily using a two point calibration
(pH 7 and pH 4). For samples with EC lower than 75 µS cm−1 the pH meter was not
accurate and for this samples the pH was measured with colorimetric pH indicator
strips (MERCK, pH-indikatorstabchen pH 0-14, Germany). Nitrate concentrations
were field-measured using colorimetric NO− 3 indicator strips (Merckoquant, nitrate
test 1.10020, Germany).
Alkalinity was determined in the field with a custom-made (VU Amsterdam)
portable titration kit. Unfiltered water samples were collected and analyzed for al-
kalinity within 30 minutes of sampling using a visual titration method with H2 SO4 .
7Chapter 4
Results
Thirty-two samples were analyzed during the 2006 investigation. A summary of
current and historical analyses is presented in Table C, Appendix C.
Nitrate Concentration
In-situ and laboratory analysis of the 2005 and 2006 fonte samples are presented in
Table C. Of the locations sampled in 2005, twenty were located which had suffi-
cient discharge to collect samples for analysis, including 10 of the 11 fonte which
had NO− 3 concentrations equal to or greater than the WHO standard of 50mg l .
−1
−
Considering NO3 concentrations measured in the fonte samples, 14 of the 32
fonte analyzed in 2006 met or exceeded the WHO standard. Field and laboratory
measurements of NO− 3 concentrations show good correlation and all samples deter-
mined to exceed WHO NO− 3 standards in the field were confirmed with laboratory
analysis. A comparison of NO− 3 analytical methods indicated that no false-positive
or false-negative results were produced using the field strip analysis.
A comparison of current and historical fonte samples exceeding the WHO
−
NO3 standard is presented in Table 4. Three sites (F029, F030 and F031) not
sampled in 2005 met or exceeded the WHO standard in 2006. Of the 11 sam-
ples exceeding the WHO NO− 3 standard in 2005, 10 exceeded the standard in 2006
while the 11th site did not have sufficient discharge to sample in 2006.
A NO− 3 concentrations in the majority of samples were consistency between
2005 and 2006. However, fonte F001, F012 and F028 show noticeable nitrate
decreases from 2005 to 2006, while location F014 shows a noticeable increase.
Isotope Analyses
At the time of reporting analytical analyses for isotope samples were not available.
Analytical results will be available prior to the start of the 2007 field program.
8Fonte ID 2005 2006 Comments
F001 200 125 St. Andre de Vagos
F003 060 075 Fonte Casa 12, Vagos
F008 NA 075 Fonte dos Amores
F012 075 000 Covao de Lobo
F013 075 175 S.Romao
F014 025 200 Rio Tinto
F015 075 050 St. Andre de Vagos
F018 150 100 Font So Bento
F019 070 045 Fonte das Rosas
F022 200 NA Fonta Junta de Freguesa
F023 075 100 Fonte de Escante
F025 NA 100 Rio Tinto
F026 150 125 Fonte Santo Antnio
F028 250 150 Ouca
F029 NA 200 Fonte de Ferreira
F032 NA 050 Fonte de Vale de Quinta de Mesas
F037 NA 050 Fonta das Rosas
Table 4.1: Summary of Fonte Samples Exceeding WHO Standard
9Chapter 5
Discussion
During the 2006 field investigation, water samples were collected from 32 of the
40 identified fonte in the Vagos area in order to determine general water character-
istics. Field values of pH, Electrical Conductivity, alkalinity, hardness, and nitrate
concentrations were measured in-situ while a full hydrochemical analysis of each
sample, including major ions, was conducted in the laboratories of the VU Ams-
terdam.
The pH of the water samples are consistent with the 2005 figures and show
standard magnitudes for groundwater samples, and chloride and alkalinity values
are all within the WHO recommended concentrations for drinking water. Second-
ing the 2005 spring study, the main issue with the fonte discharge water is the
high nitrate concentrations found throughout the region. Isotopic analyses were
not completed at the time of publication.
Of the 32 fonte sampled, 13 contained nitrate concentrations in excess of the
50mg l−1 norm. If this can be considered representative of the entire region, ap-
proximately 40% of the fonte in the study area could contain NO− 3 concentrations
in excess of the guideline. Locations F014 (200mg l−1 ), F028 (150mg l−1 ) and
F029 (200mg l−1 ) are of note due to particularly high concentrations.
Comparing NO− 3 concentrations changes between the 2005 and 2006 sampling
events, the results for individual fonte were consistent. Only samples F012 and
F019 exceeded the WHO standard in 2005 but where below the standard in 2006.
While the decline in F012 appears statistically valid, the change in F019 is within
analytical uncertainty. Similarly, only one sample (F014) was below the WHO
guideline in 2005 and increased to a concentration greater than the standard in
2006.
In-situ NO−3 concentrations measured using indicator strips were in good agree-
ment with the laboratory analyses. All in-situ NO− 3 concentrations determined to be
equal to or greater than the WHO guildline were confirmed by the laboratory anal-
yses, although the accuracy of the indicator strips declined as NO− 3 concentrations
exceeded 150mg l−1 . For the purpose of comparison to the WHO guidelines,
the in-situ NO− 3 strips can be considered a good indicator of fonte discharge water
10quality.
11Chapter 6
Conclusions and
recommendations
The fontes that have nitrate concentrations surpassing the drinking water standard
should be labeled as not suitable for drinking water purposes. These locations are
highlighted in Table C, Appendix C.
As locations F012, F014, and F028 showed significant changes in NO− 3 concentrations
between the 2005 and 2006 sampling events, it is recommended that more infor-
mation should be collected from these wells to determine the origin of the water
and the impacts of adjacent land use.
At locations F013 (St Romao), F014 (Rio Tinto), F028 (Ouca) and F029 (Fonte
de Ferreira) action should be undertaken to lower the particularly high concentra-
tions of NO−3 if these wells are to be used for water supply in the future.
Further hydrochemical analyses of fontes should be undertaken in future years
to delineate the spatial distribution of NO− 3 in groundwater across the study area.
Future analytical data could help determine the effects of precipitation and land
use variation in groundwater quality in the region, and could illustrate trends not
apparent with the current data set.
12Bibliography
J. Geris, J. de Ridder, and B. de Veen. Hydrological research of the Ribeira da Presa
Velha catchment. Portugal field course report 5, Vrije Universiteit Amsterdam,
De Boelelaan 1085, 1081HV, Amsterdam, Netherlands, July 2006.
C. Gijsbertsen, M. Hoogmoed, and W. Segers. Hydrochemical classification of
public water points in the Rio Boco catchment, Portugal. Technical report, Vrije
Universiteit, Amsterdam, May 2006.
K. Horner, M. Kuiper, and S. Stevens. Hydrology of the Ribeiro das Mesas catch-
ment area of Northwestern Portugal. Portugal field course report 4, Vrije Univer-
siteit Amsterdam, De Boelelaan 1085, 1081HV, Amsterdam, Netherlands, July
2006.
J. Thomas, M.S. Alvarado, and Y. Liu. Hydrology and ecohydrology of the Ribeiro
do Tabuaço catchment, Aveiro, portugal. Portugal field course report 6, Vrije
Universiteit Amsterdam, De Boelelaan 1085, 1081HV, Amsterdam, Nether-
lands, July 2006.
WHO. Guidelines for drinking-water quality (third edition). volume 1: recom-
mendations. Technical report, World Health Organization, Geneva, Switzerland,
2004.
13Appendix A
Site Location Plan
14Figure A.1: Beiras region, Portugal.
15Figure A.2: A satellite image of the Aveiro region and the location of the study
area.
16Appendix B
Fonte Location Description
1718
19
Appendix C

Analytical Results

                20
21
You can also read