Co-production of geothermal heat on petroleum sites: opportunities and challenges - MEET
←
→
Page content transcription
If your browser does not render page correctly, please read the page content below
Co-production of geothermal heat on
 petroleum sites: opportunities and
            challenges
                 Eric Léoutre& Laurent Ghilardini, VERMILION, France
             Geological modelling (les Pins field) by Gilles Fabre, GEOXILIA

         MEET Project – Geothermal Winter School – February 2021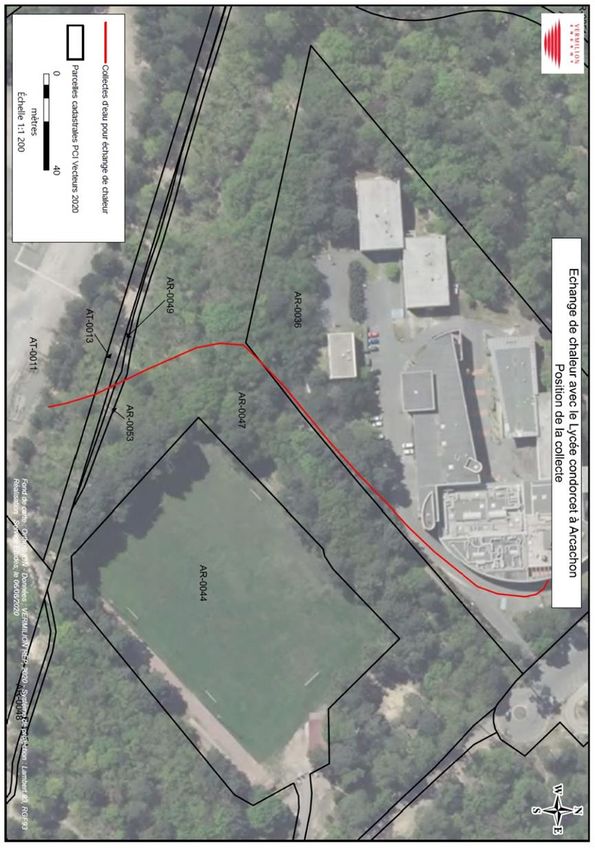
Key Messages ahead

-   Onshore mature oilfields can produce large volumes of hot brine
-   Heat can be valorised at reinjection site when a end-user is identified nearby, or
    brought in
-   Vermilion has demonstrated feasibility at very different scales: from 0.5 to 10 MW of
    heat capacity
-   Key uncertainties from the producer perspective : unlike large open aquifer, oil field
    are small closed structure hence the need to study « cold front » & well interferences
-   Existing O&G tools and models can be re-used to predict long-term geothermal
    ressources
-   Key risk from the user perspective: geothermal heat long-term availability is
    dependant on oil price and oil field economics
-   Impact on oilfield facilities & exploitation is minimal
-   Oil revenues >> heat revenues, conversion to geothermal is hindered by electrical
    O&M in depleted oilfields (deep submersible pumps)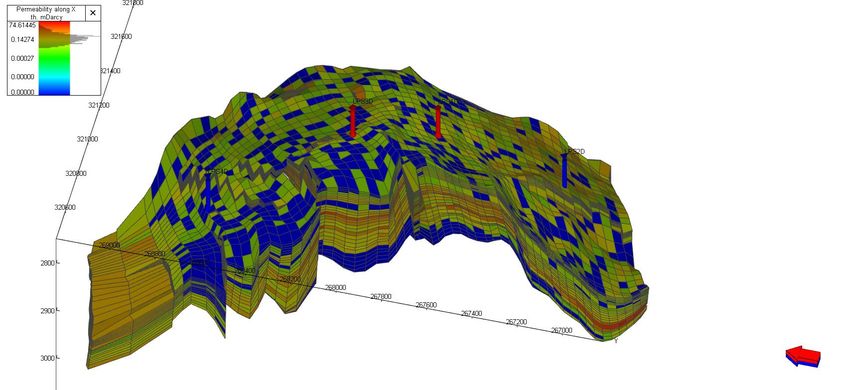
An oil producer ?
-   Lots of brine: average porfolio at 95 % BSW
-   40 000m3/d of hot brine from 26 concessions
-   Geothermal gradients: 29 to 30 °C/km
-   Surface temperature ranging from 60 to 100 °C at wellhead
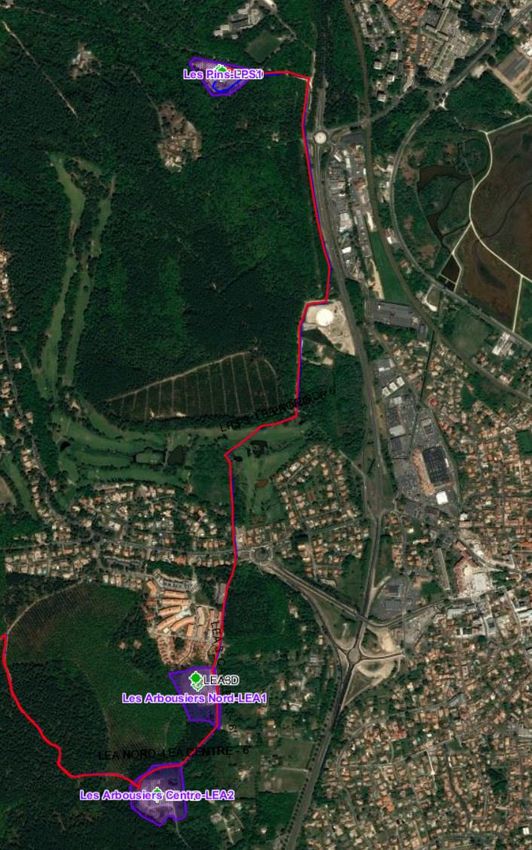
Project location
               High-school heated by gas
               Heat needs: 850 MWh/y
               CO2 : 230 t/y
                                                                             PARIS

              High school

                         250 m

       Oil field « Les                                     Les Pins         BORDEAUX
       Pins »                                              Les Arbousiers
                                                           T= 60-70°C

   Oil field « Les Pins »: 3 producers +2 injector wells
   Injection temperature 61 °C
   350 m3/d to 800 m3/d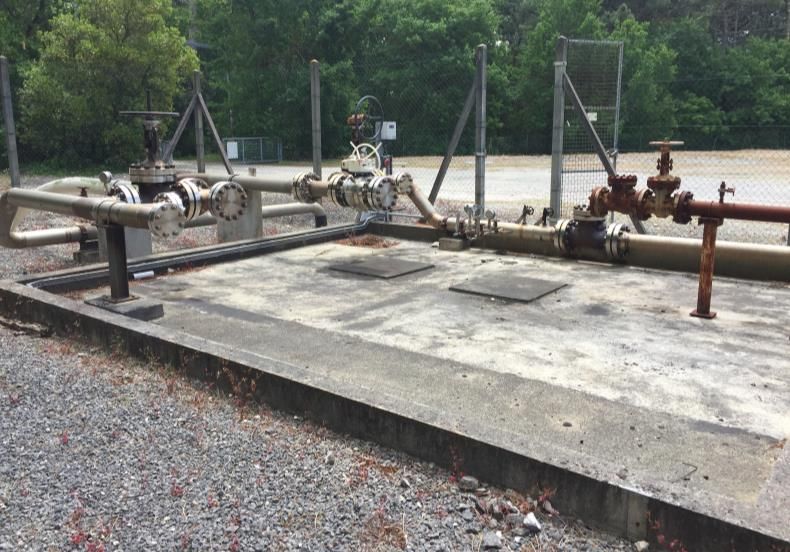
2 oil fields with shared process
                  Condorcet highschool                           Condorcet highschool
                                                 LPS
                                                                                 • The liquid produced in LPS (LPS3D,
                                                                                   LPS5D), LEA Nord (LEA1D) and LEA
                                                                                   Centre (LEA2D) is gathered in LEA
                                                                                   Centre and separated

                                                                                 • The produced and separated water is
                                                                                   sent to LEA Nord (LEA3D) and LPS
                                                                                   (LPS1D, LPS2D) to be re-injected

                                                                                 • The heat exchange is realized on the
                                                                                   water before re-injection in LEA Nord
                                                                                   and LPS
                                           Eco-quartier
   Eco-quartier

                                                                                              Oil + water
                                         LEA Nord
                                                                                              water

                                                                                              heat
                                                          LEA Centre

                                                                                                                           5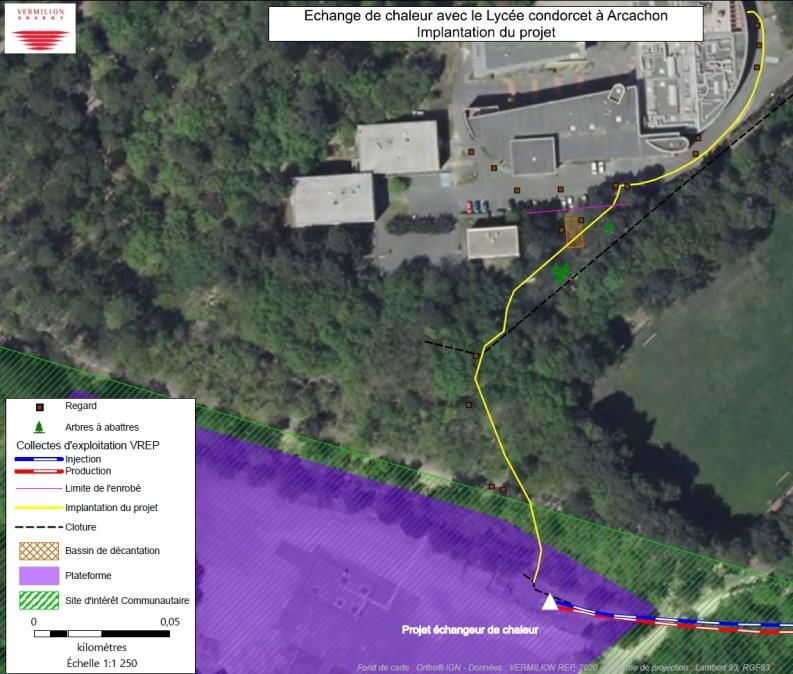
Project uncertainties to be adressed

  Subsurface                                         Surface
  ✓ Long-term brine volume = f (oil reserves ) = f   ✓ Impact of well downtime on heat delivery
    (oil price)
                                                     ✓ Impact of injection line on HEX design
  ✓ Long-term injectivity (plugging risks)
                                                     ✓ Optimisation of oil vs. water ?
  ✓ Impact of colder reinjection on tubing packer
  ✓                                                  ✓ Allocation of injection
  ✓ Injector- producer thermal interferences:
    cold front an thermal breakthrough ?

  ✓ Impact on oil reservoir (dentisty & viscosity)

                                                                                                  6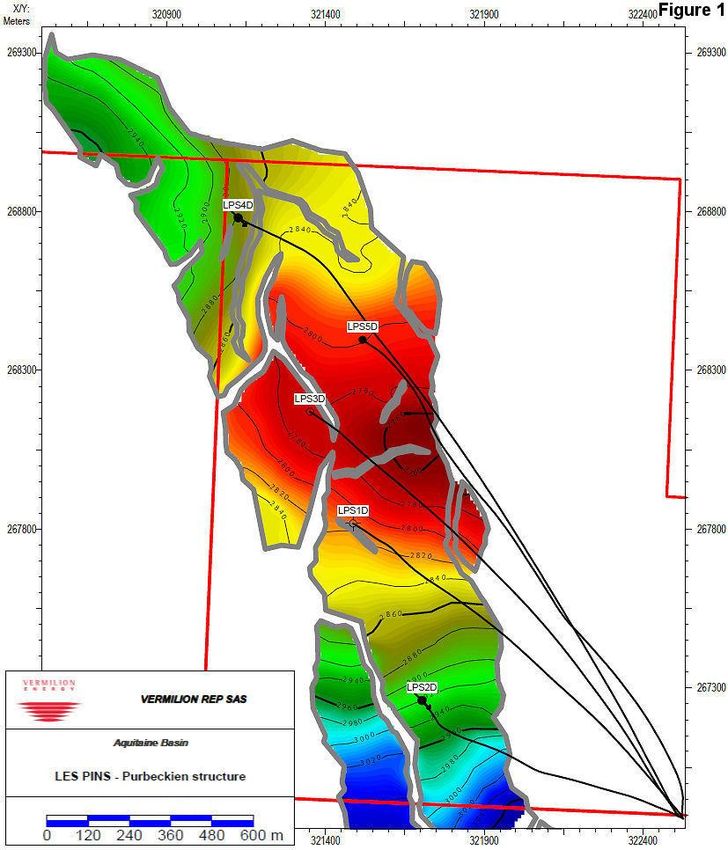
Condorcet

Thermal study objective
                                                                                            THT inj = ? °C
                                                                                            800 m3/d
              LPS1   LPS3   LPS5   LEA1   LEA2   LPS2 inj   LEA3 inj          LPS2
 Q m3/j       155     80    395    466     380     350        950
 THT °C        70     59     83     86      83     62          71
 BHT °C       101    102    101     99     101     63          75

measured
estimated Prosper
estimatd Tnav                                                          LPS1          LPS5
by analogy                                                                    LPS3

                                                                                        1000 m3/d

   • Curently: 1 injector at LPS, T = 62°C
                                                                              LEA3

                                                                                                                         1800 m3/d
   • After heat delivery : 2 injectors , temperature                                                           Eco-
     evolution unknown in the long-term (large T losses                       LEA1                            quartier
     along the process)
                                                                                                             1880 m3/d

                                                                              LEA2                              SEP
                                                                                                                         oil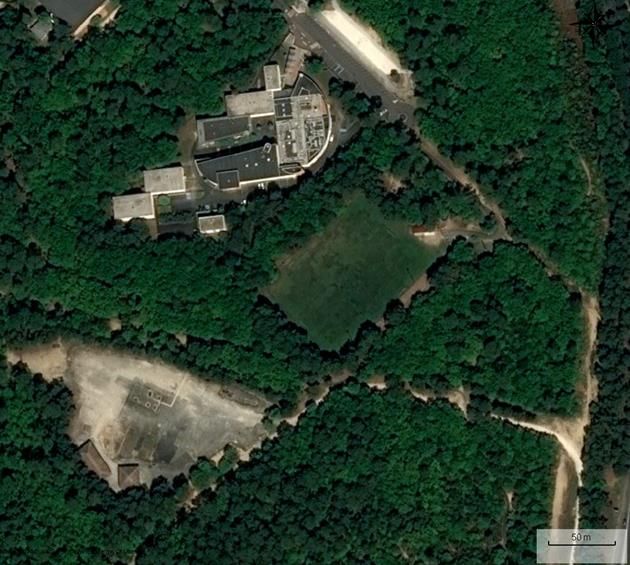
Thermal study objective
• What is going to drive the cold front in the model is:

   • The temperature of the water injected

   • The speed of the water injected (injection rate and permeability of the
     reservoir)

   • The distance between producer and injector

   • The proportion of aquifer in the produced water (active vs. weak aquifer)

   • The thermal parameters of the rock / fluids

   • The boundary conditions (outside reservoir boundary heat supply)
                                                                                 8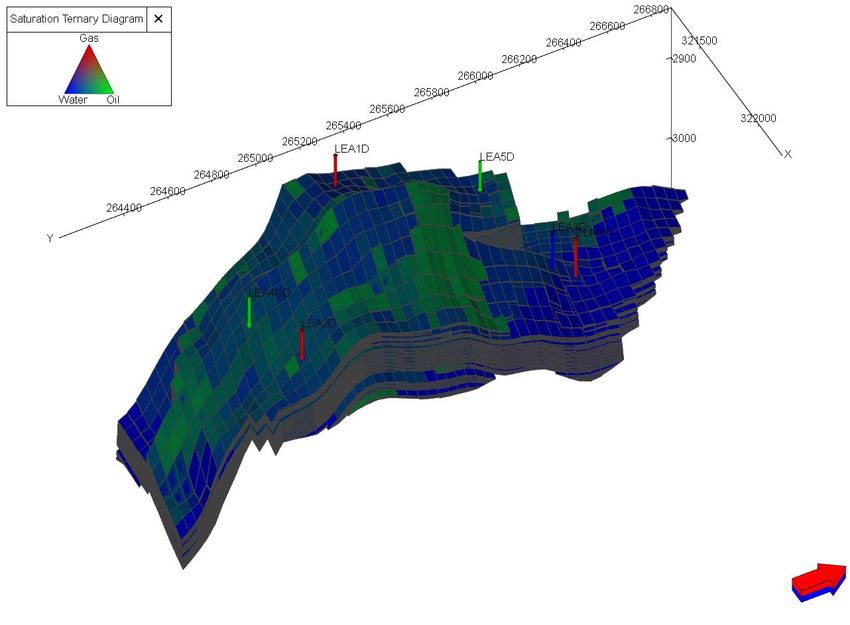
Les Pins modeling
(static & dynamic)

                     9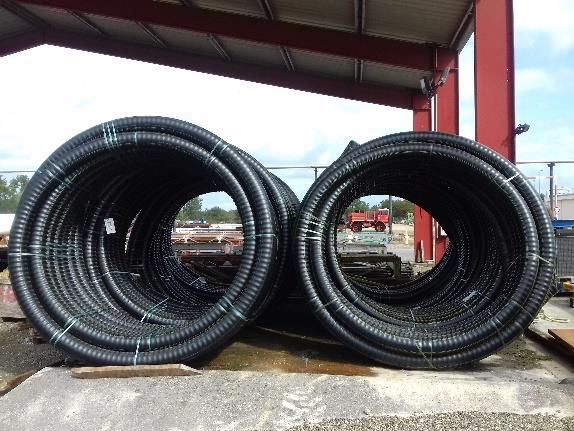
Top Reservoir
Map
                LPS1D (580m) is closer
                to the injector
                compared to LPS3/LPS5
                (900/1180m)

                                   10
Prod history End of the last
simulation
Injection started after
~1 year
11Existing model OOIP: 3 MMsm3
WIIP: 37.5 MMsm3
Structure from seismic horizons
Grid: 25 x 57 x 29
DX~30m
DY~43m
DZ~2.5m
Reservoir property (Phi) populated using
geostatistical methods
K from K/Phi laws (logs)
Water saturation from Pc curves (SCAL)
12Existing model history matching
Rates
(m3/d)
Wc
Total
(Mm3)
Good field HM in terms of
rates and total
13Looking for temperature data!
• Temperature data in our O&G industry is not generally
acquired with the aim of studying geothermal topics but
several data are available associated with the monitoring
of the reservoir:
• Flowmeter logs/Thermometer logs to study the injection
contribution of LPS-2D
• Gauge temperature
• RFT/MDT: in LPS-1D, 2D, 3D, 4D, for the initial reservoir temperature
• Permanent gauge in LPS-3D and 5D, for the bottom hole temperature at
a given date
• Gauge for pressure surveys: in LPS-1D, 3D, 4D and 5D
14Initial reservoir temperature
WELL DATE TYPE MID PERF MD MID PERF TVDSS GAUGE DEPTH MD GAUGE DEPTH TVDSS TEMPERATURE Comment Initial reservoir temperature
m m m m °C
LPS1D 22/03/1994 MDT 3208,5 2821 3208,5 2821 101,8 from MDT and pressure survey
LPS1D 27/06/1994 Test Gauge 3259 2870 3228 2840 102,6 well flowing
LPS1D 01/07/1994 Test Gauge 3259 2870 3228 2840 101,6 well flowing data
LPS1D 13/07/1994 Test Gauge 3259 2870 3228 2840 102,1 well flowing
LPS1D 24/07/1994 Test Gauge 3259 2870 3140 2755 101,6 well flowing
LPS3D 16/05/1995 MDT 3368,2 2773 3368,2 2773 101
LPS4D 23/04/1996 Test Gauge 3856 2878 2746 2037 104,7 well flowing
LPS5D 23/10/2003 Test Gauge 3440 2810 3377 2750 100,5 well flowing
Initial temperature
selected for the
reservoir:
2700m 98°C
2821m 101,8°C
2950 m 105,9°C
15Initial reservoir temperature
With ~30,7°C/Km, the geothermal
gradient in Les Pins is as expected
for a sedimentary basin
16LPS Initial reservoir temperature (1994)
17Brine specific heat
Volume specific heat of water vs. Temperature:
Use of correlations: 3.974 KJ/KG/°C
Assuming that most of the water in the reservoir is reservoir
water. In reality the reservoir will be partially filled with time
with less salted (source) water. In the simulator, only one value
can be entered…
18Rock specific heat
Sandstone mass specific heat (literature): 0,710 KJ/kg/K
Density of Les Pins Sandstone: 2650 kg/m3
➔ Volume specific heat of rock: 1881 KJ/m3/K
A value of 2000 kJ/m3/K will be assigned to the reservoir rock with an
uncertainty in the range of 1800-2400 kJ/m3/K
19Thermal conductivity rock
20Thermal conductivity rock
Atlas régional des ressources
géothermales très basse énergie de
Poitou-Charentes, BRGM, 2018
A value of 3 W/m/K will be assigned to
the reservoir rock (258 kJ/m/C/day)
based on values from literature with an
uncertainty in the range of 2,3-3,7 W/m/K
(198-318 KJ/m/C/day)
Caractéristiques géothermiques du
réservoir gréseux du Buntsandstein
Alsace, Sébatsien Haffen, 2013
21Boundary conditions
Less conductive: 120 KJ/m/K/day, 1700 KJ/m3/K, 102 °C
Assuming Purbeckian Reservoir
Assuming
lateral continuity: 2000 KJ/m3/K lateral continuity:
2000 KJ/m3/K
258 KJ/m/K/day 258 KJ/m/K/day 2000 KJ/m3/K
258 KJ/m/K/day
106°C 102°C in the middle 106°C
Less conductive: 120 KJ/m/K/day, 1700 KJ/m3/K, 108°C
This assumes the reservoir is well isolated from the
Jurassic formation of Mano below, known to be
fractured and that could bring hotter water if in direct
communication
22LPS Base case history match
Today
Cold
Today wave
Parameters: Mid-layer limited to
• initial Temperature gradient around 102°C LPS2/LPS
• Volume specific heat of oil, water, gas: 2,22, 3,97, 2,13 1 area
KJ/kg/°C
• Volume specific heat of rock: 2000 KJ/rm3/°C
• Rock thermal conductivity: 258 kJ/m/day/C
Assumptions:
• Set boundary conditions
• Dead cells participating to heat
• Injected water temperature history from calculation
23Past shallow water injection
LPS2D injected water type Field Injected water type
8000,00 8000,00
7000,00 7000,00
6000,00 6000,00
Injection rate (bbl/d)
Injection rate (bbl/d)
5000,00 5000,00
eau formation eau formation
4000,00 4000,00
eau douce eau douce
total injected total injected
3000,00 3000,00
2000,00 2000,00
1000,00 1000,00
0,00 0,00
LPS4D injected water type
7000,00
6000,00
5000,00
24,5 MMstb of source
water injected out of 38
Injection rate (bbl/d)
4000,00
eau formation
3000,00
eau douce
total injected
MMstb (65%) since 1995
2000,00
1000,00
0,00
It has been assumed that the same proportion of source water was sent to both LPS2D and LPS4D
24LPS2D injected water temperature / downhole
Average temperature (weighted
by volume injected) of 44°C for
the water injected since 1995
25LPS Base case forecast
2040 Cold
wave
reaches
Forecast: LPS3/LPS
2040 5 area
• Including the LPS1D conversion in 2020
• Wells controlled on BHP
• Optimized Liquid Rates:
• LPS3D: 79 m3/d
• LPS5D: 600 m3/d
• Injected Water Rate:
• LPS2D: 350 m3/d
• LPS1D: 450 m3/d
• Injected temperature linked to Condorcet’s project: 63°C
(60°C instead of 70°C during 1/3 of the year)
26LPS Base case forecast: LPS1D
LPS1D
Moved to water injection
27LPS Base case forecast: LPS3D
LPS3D
-10°C in 2040
28LPS Base case forecast: LPS5D
LPS5D
-10°C in 2040
29LPS model uncertainties
BASE LOW HIGH
INJRATE 800 400 1000
SPECHEATW 3,974 3,7 4,2
SPECROCK 2000 1800 2400
TEMPINIT 63 50 70
THCONBOT 120 50 400
THCONLAT 258 50 400
THCONRES 258 198 318
Far from the injector, several things impact negatively the final temperature in 2040
(example of LPS5D): Water injection temperature, Thermal conductivity of the rock,
Bottom rock conductivity, specific heat capacity of fluids…
BUT the impact is relatively low: -1°C in average of uncertainty
Note the positive impact of massively reducing the injection rate (to 400 m3/D in total,
which is unlikely) 30LPS Uncertainties / Impact on LPS3D temperature
Sensitivities
All Low parameters
(« disaster » case)
• LPS3D will lose 10°C
LPS3D bottom hole (+/- 2°C) between
temperature today and 2040
• LPS5D will lose
maximum 20°C
(disaster case) Forecast
History
* Performed wihtout the
LPS1D conversion
31LPS Uncertainties / Impact on LPS5D temperature
Sensitivities
• LPS5D will lose 8°C All Low parameters
(+/- 1.5°C) between (« disaster » case)
LPS5D bottom hole
today and 2040
temperature
• LPS5D will lose
maximum 16°C
(disaster case)
History Forecast
32Les Arbousiers
modeling (static &
dynamic)
33LEA Top Reservoir
Map
34LEA Prod history
Tank incident
in Ambés
Cazaux Pipe
leak
Injection started after
~18 months of prod
35LEA Water
Track records before 2007?
injection type
➔
Dig into the old Exxon daily
reports to rebuild the split
between source water and
production water!
Source water mostly 6,6 MMstb of
injected at the beginning source water
injected out of
43,6 in total
(15%)
36LEA Permeability
Permeability values from transient pressure tests:
• 12/91: LEA1 3145.2-3150.5 m log, build up de 7h30
➔ K=1633 mD
37LEA Permeability
Permeability values from transient pressure tests:
• 12/93: LEA3 3474-3521 m log, fall off test de 54h
➔ K=190 mD
38LEA 2019
PETREL
dynamic model settings
TNAVIGATOR
Production/
Structure+Layering Property modeling PVT black oil KrPc Aquifer
Pressure data
Using available Geostatistical Composite BO Kr from LEA4 core flood Sporadic No additonal
horizons and approach using PVT from LEA1 Swirr correlated from K pressures at 3000 aquifer (small
thicknesses facies proportion RFT downhole Sorw using observed mTVDSS (RFT, aquifer)
Layers parallel to maps, K/Phi laws, sample 67% efficiency of SBHP surveys,
top with erosion Kx=Ky=Kz displacement static NEA)
from bottom No Pc Production data
from OFM
19x104x120=237 120 cells
Keeping only the « center » of LEA + 0
perm. removed
➔ 20 668 active cells
39LEA 2019 dynamic model initialization
OWC: 3000 mTVDSS
GOC: no GOC
Pressure at OWC: 293 bars
STOIIP: 3003 Msm3 (18.9 MMstb),
WIIP: 3009 Msm3 (18.9 MMstb)
GIIP (Dissolved): 22 MMsm3 (777 MMscf)
40LEA Field History Match
Good Field HM
41LEA Initial reservoir temperature
Initial temperature
selected for the
reservoir:
2700m 93,1°C
LPS data (black squares) 2855m 98°C
3100m 105,7°C
Temperature slightly below temperature
calculated using regional geothermal gradient of
3,15°C/100m and slightly below LPS gradient in
Purbeckian 42LEA Initial reservoir temperature
Initial temperature
selected for the
reservoir:
2700m 93,1°C
2855m 98°C
3100m 105,7°C
43LEA Base HM thermal simulation
Lower
Today Fluvial
Purbeckian
Parameters: layer
• initial Temperature gradient around 102°C
• Volume specific heat of oil, water, gas: 2,22, 3,97, 2,13 Today
KJ/kg/°C
• Volume specific heat of rock: 2000 KJ/rm3/°C Cold wave
• Rock thermal conductivity: 258 kJ/m/day/C barely
Assumptions: touching
• Boundary conditions LEA2D
• Dead cells participating to heat
• Injected temperature based on source water proportion
44LEA Base Forecast thermal simulation
2040 Lower
Fluvial
Purbeckian
Settings: layer
• LPS1D converted to injection (increased LPS/LEA water
prod capacity) 2040
• Producing wells controlled by Min BHP Cold wave
• LEA1D: max liquid rate: 600 m3/d more
• LEA2D: max liquid rate: 600 m3/d impacting
lEA2D
• LEA3D injection defined by VRR=1 (max rate 1200 m3/d) LEA1D
• Temperature of injected water including HEX project in
LEA (68°C instead of 76°C)
45Les Pins / Les
Arbousiers
combined results
46Downhole T impact for LEA/LPS
Not included:
- ESP heating
- Reduce surface losses (higher rate = higher velocity)
- Thermal behavior of well (T downhole -> surface)
47Downhole to surface loop
THT inj = f (THT producer, Q fluid flowline)
WELL Downhole T Gauges
THT producer = f ( BHT, data to calibrate well &
Q wellbore, reservoir models
ESP heating)
RESERVOIR
BHT producer= f (dT cooling reservoir)
dT cooling reservoir= f (BHT inj, Q inj
dT heat exchanger
Assumptions of end-
ΔT HEX= f (outside T, user heat needs
End-user needs user’s heat demand)
48T forecast & impact on project
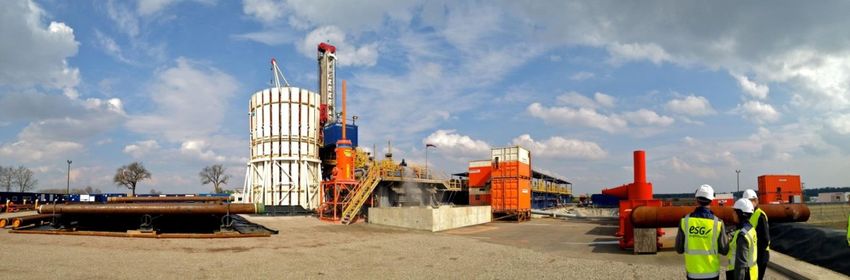
Project summary & way forwad

              - Field work scheduled June 2021 (awaiting
                forestry service green light)
              - Heat delivered 01/10/2021 for 20 year
              - >90% heat covered
              - CO2 avoided 200 t/year
Take-away messages
- Onshore mature oilfields can produce large volumes of hot brine
- Heat can be valorised at reinjection site when a end-user is identified nearby, or
brought in provided you are ready to get involved with local stakeholders
- Vermilion has demonstrated feasibility at very different scales: from 0.4 to 10 MW of
heat capacity
- Key uncertainties from the producer perspective : unlike large open aquifer, oil field
are small closed structure hence the need to study « cold front » & well interferences
- Existing O&G tools and models can be re-used to predict long-term geothermal
ressources
- Key risk from the user perspective: geothermal heat long-term availability is
dependant on BRENT price and oil field economics
- Impact on oilfield facilities & exploitation is minimal
- Oil revenues >> heat revenues, conversion to geothermal is hindered by electrical
O&M in depleted oilfields (deep submersible pumps)Thank you very much for your attention This work was performed in the framework of the H2020 MEET EU project which has received funding from the European Union’s Horizon 2020 research and innovation programme under grant agreement No 792037
Etude de faisabilité 2019/2020
➢ Modélisation de la prévision de température en surface et dans le gisement
➢ Prise en compte des besoins journaliers du lycée

➢ Taux de couverture > 93%
➢ CO2 évité = 190 t/an

                                              Carte de l’impact   Schéma du process
     Prédictions de température en surface   thermique dans le    pétrolier en surface
                                                 gisement
                                                                                         54
Non-technical risks (1/2)
Lycée Forêt Cluster
Stakeholder alignment Propriétaire COBAS Mairie Arcachon VET
300 m of pipes = 1) Autorisation travaux Reçu le 23/07
Vote conseil na
2 public field owners Communautaire le
17/12
2 oil partners
2) Contrat de servitude Vote conseil
1 end-user Communautaire le na
Vote C.M le 22/10/2020
17/12
1 building owner
3) Accord propriétaire pour déposer Reçu 9/09
2 regulatory services
dossier DDTM Vote conseil
Communautaire le na
17/12
4 a) Autorisation défrichement par na
Dossier envoyé le 02/11, réponse na
DDTM foret
attendue . Pas officiellement
Lycée 4 b) Confirmation pas d’impact notable commencé. Réponse attendue pour
na mi janvier au mieux na
par DDTM natura2000
5) Lettre d’entente avec IPC
Signée 7/06
Forêt 6) vote CA lycée Condorcet
30/11 vote favorable
7) Contrat de vente avec Région NA
Mandat donné à Président Région par vote en commission le 17/07
ClusterNon-technical risks (2/2)
Risk allocation in contract
End-user: Heat provider:
- Wants to minimise its CO2 impact - Do not wants heat delivery commitments (no impact to oil)
- Wants heat delivery commitments in the long - Needs to maximise uptime for oil and water
term
- Wants heat revenues to cover heat-delivery Capex and O&M
- Needs enough geothermal coverage per year to
pay back its investment - Cannot garantee 20 years of concession (renewal processes)
- Wants a heat price < gas price - Cannot predict oil price hence field end of lifeDistribution annuelle de la température d'injection après fourniture chaleur
chauffage Condorcet – prédiction
Principe: On chauffe quand T° ext > 17°C
Plus T ext faible, plus on chauffe -> échange thermique plus important à l’échangeur
Conclusion:
dT moyen de l’échangeur LPS sur une année: 7.3°C à 350 m3/j
3.2 °C à 800 m3/jDistribution annuelle de la température d'injection après fourniture chauffage +
Eau Chaue Sanitaire Eco-quartier – données réelles
Conclusion:
dT moyen de l’échangeur LEA sur une année: 9.6°C
~ constant sur l’année cause ECS
> dT prévu sur LPS car chauffage + ECS
58LPS1 T gauge: conclusion Depth, Depth,
msol mv
Jauge 2942 2581
PCI intake 2962 (+20m) 2600 (+19m)
Top perf 3190 (+248 m) 2821 (+240m)
➢ Static T of 71°C is not representative of resevoir fluid
➢ Static T corrected to top perf gives 79°C but likely lower
Static T = 71 °C than actual because of convection effect in well (higher
Flowing T thermal losses)
= 106 °C ➢ Flowing T > initial T of 102°C at top perf : likely impact
of motor heating with dT of up to 10 -20 °C (cf. pump
design)
➢ Model prediction of 89°C is realistic although it
cannot be checked accurately
59LPS1 T gauge:
LPS1
ESP heating
LPS3 LPS5 LEA1 LEA2
ESP depth 2962/260 3089 3320 / 2017/186 2220/21
(md/mv) 8 /2533 2715 9 29
Top perf 3198/282 3367 / 3430 / 3118/287 3051/29
(md/md) 9 2790 2819 9 49
Distance 1101/101
260/221 278 / 258 110/104 831/ 820
(md/mv) 0
Fluid rate (m3/d) 125 80 400 466 380
ΔTs design 9°C 7°C 1°C 1°C
ΔTw design
20°C 13°C 13°C 27°C
60En volume En équivalent barril d’huile
LEA2 balance input / output energie
12 m3/j huile
75 boepd
huile eau = 0.3 à 1 boepd
600 m3/j d’eau suivant dT
Conso PCI = 2.7 boepd
PCI : 248 hp
En K€ annuel (2040, pas d’huile)
En K€ annuel (2019)
eau = 40 K€ à 250K€ suivant eau = 40 K€ à 250K€
dT ( 20 à 50°) et taux suivant dT et taux
d’utilisation (20% à 50%) d’utilisation
Conso PCI = 100 K€
Conso PCI = 100 K€Downtime LEGE
- Downtime moyen sur 2017/2018 = 6%
- Les casse puits impactent la production huile et
eau
- Puits profonds /chauds = durée de vie des
dompes de fond plus faible qu’ailleurs
- Fréquence moyenne de pulling sur 10 ans = 2 ans
- Avec LEA1 en production la limite de réinjection
sera atteinte (1400 m3/j)
62Tracé proposé
➢ Tracé optimisé : suivi d ’une « trouée » en forêt au N de piste cyclable
➢ Longueur 130 m dans les 5 parcelles de la commune avec servitude de 5 m
➢ Autorisation à déposer notre dossier de défrichement à la DDTM
Tranchée ( 1 m profondeur
* 1 mètre de largeur)
Canalisation à dérouler et
enterrer (D = 10 cm)
Vue du passage vers
la piste cyclable
63Oil and heat coproduction pilot
High-school
Oil platform
Key challenges
Project Impact (planned Q4 2020) 1) Thermal interferences in reservoir
2) Scaling & injectivity risks
✓ Delivers 820 MWh / year
✓ >95% of heat needs are covered 3) Long-term thermal ressources = f (Brent
✓ CO2 reduction 220 t/year price)
4) Load factor vs. economics
5) Heat delivery vs. oil production
optimisation
64You can also read