A Study on Customer Loyalty of Jio Users towards Jio, Vijayawada, Andhra Pradesh - jaras
←
→
Page content transcription
If your browser does not render page correctly, please read the page content below
IAETSD JOURNAL FOR ADVANCED RESEARCH IN APPLIED SCIENCES                                                      ISSN NO: 2394-8442

      A Study on Customer Loyalty of Jio Users towards Jio, Vijayawada,
                                                       Andhra Pradesh
                                                                                  Dr. B.KISHORE BABU*1 Asso.Prof,
          Dept. of Management, Koneru Lakshmaiah Education Foundation, Vaddeswaram, Guntur, Andhra Pradesh, India.
                                                                                            kishorebabu11@gmail.com

   Abstract: Competition in the telecommunications world in India is very firm, brand switching of customers is also
   very high. That’s why each provider trying to provide the best for its customers so that they can be loyal to the same
   provider. customer loyalty is defined a relationship between customer with a particular brand name, and company
   exemplified by their purchase of the customer or consumer buying behavior towards a consistent and profitable brand and
   measured as recommended to other consumers. In India, there are ten mobile telecom providers operating in the market
   (Vodafone-Idea, Airtel, Jio, BSNL, Aircel, Reliance communications, Telenor, Tata Docomo, MTS India, MTNL).

   The rationale of this study is to know the customer loyalty of JIO customers towards JIO After free services time was
   over. Whether customers are continuing the JIO or not? to know overall satisfaction of customers towards services of JIO,
   factors which considered to select JIO This study uses data 300 respondents from the population was Reliance JIO users
   in Vijayawada, Andhra Pradesh, with a structured questionnaire. The questionnaires were scrutinized using MS-Excel. The
   results of this study show that 63% of the customers are highly satisfied with the performance of JIO services, 45% of the
   customers are highly agreed that, they will continue the JIO services in coming years and wants to be loyal to the JIO, 52%
   of the customers are highly agreed that they satisfied with the performance of JIO and suggest others to use JIO

   Key Words: customer loyalty, telecommunication, satisfaction, Brand switching

                                                  INTRODUCTION
   Reliance Jio Infocomm Limited, performing business operations as Jio, is A Long Term Evolution (LTE)mobile
   network operator in India. It is a wholly owned subsidiary of Reliance Industries, that make available
   wireless 4G LTE service network and is the only 100% VoLTE (Voice over LTE) operator in the country, with coverage
   across all twenty two Telecommunication circles in India.

   The services were first beta-launched to Jio's associates and workforce on 27 December 2015 and later on services were
   commercially embarked on 5 September 2016. The company will launch its 4G broadband services all over India in the
   first quarter of 2016-2017 financial year. It will offer data and voice services with peripheral services like instant messaging,
   live TV, movies on demand, news, streaming music, and a digital payments platform.

   The Reliance JIO has a network of more than 250,000 km of optic fiber cables in the country, over which it will be
   collaborating with local cable operators to get broader connectivity for its broadband services. With its multi-service
   operator licence, Jio will also serve as a TV channel distributor and will offer television-on-demand on its network.
   preceding to its pan-India commence of 4G data and telephone services, Jio has started providing free Wi-Fi hotspot
   services in cities throughout India including Surat, Ahmedabad in Gujarat, and Visakhapatnam in Andhra Pradesh, Indore,
   Jabalpur, etc.

VOLUME 5, ISSUE 1, JAN/2018                                      388                                       http://iaetsdjaras.org/
IAETSD JOURNAL FOR ADVANCED RESEARCH IN APPLIED SCIENCES ISSN NO: 2394-8442
In the telecommunication industry, the foremost form to protect subscriber base is to triumph customer loyalty, an
important prerequisite for the long term safeguarding of the brands life. Customer enduring association with a service
provider is of superior importance to the accomplishment of a company in an exigent and cutthroat market. Loyal
consumers construct businesses by buying more, and providing new referrals through affirmative word of mouth in due
course.
Research Problem
The Telecom industry is one of the swift mounting industries in India. Consumers have all possibilities of
purchasing and switching the mobile service provider due to industry expansion. Number of companies in this sector is
increasing, so each one of them wants to overplay others to attract consumers. This research deals with customer loyalty of
Reliance JIO users towards JIO.
Objectives
1. To know who influenced the purchase of JIO.
2. To know which factors customers considered for purchase of JIO.
3. To study the customer loyalty of the JIO customers towards JIO.
4. To know the overall satisfaction levels of JIO customers towards JIO.
REVIEW OF LITERATURE
1. Kotler and Keller (2006) hold that companies be acquainted with the significance of gratifying and keep hold of
customers. To them, the following are attention-grabbing truth about customer uphold, get hold of new customers can
cost five times more than the cost occupied in satisfying and retaining present customers, the average company loses10
percent of its customers each year, and the customer profit rate tends to increase over the life of retained customers.
2.(Eshghi et al., 2007; Heskett & Sasser, 2010). There is a glut of definitions of loyalty and/or customer loyalty in the
present literature. Customer loyalty is customer repeating purchase intention to some particular products or services in the
future
3. According to Uncles et al. customer loyalty can be classify as (a) attitudinal-loyalty to the brand whereby customers
have a constructive set of affirmed conviction towards the brand purchased, (b) behavioral-loyalty to the brand where
loyalty to a firm brand is defined chiefly with reference to the prototype of past purchases, and (c) co-determinants of
buying brand where loyalty is moderated by incident variables such as individual’s current circumstances, their
characteristics, and/or the purchasing situation faced. In this study, the concept of customer loyalty is based on both user’s
attitudinal-loyalty and behavioural-loyalty to the telecommunication service provider
4. According to Serkan and Gorhan, there are four dimension that influence customer loyalty in choosing desired
telecommunication service providers. These dimensions are corporate image, perceived service quality, trust and switching
cost.
5. According to Anderson and Narus , faith is a belief to another party’s word or pledge because the party is measured as
integral, honest, truthful, and able to perform actions that will result in positive outcomes or prevent actions that will end
in negative results. A customer who believes a definite brand is likely to form optimistic buying custody towards the brand
6. Oliver defines customer loyalty as a deep held commitment to repeat patronage from a preferred product/service
consistently in the future, thereby causing repetitive same-brand or same brand-set purchasing, despite situational
influences and marketing efforts that may potentially cause switching behaviour. Customer loyalty has been found to be
the key mediating variable in explaining customer retention, which is the likelihood of a customer returning, making
business referrals, providing strong word-of-mouth, as well as providing references and publicity.
RESEARCH METHODOLOGY
RESEARCH METHOD: Descriptive Research Method
In this study survey method is used.
VOLUME 5, ISSUE 1, JAN/2018 389 http://iaetsdjaras.org/IAETSD JOURNAL FOR ADVANCED RESEARCH IN APPLIED SCIENCES ISSN NO: 2394-8442
SAMPLING TECHNIQUE:
A purposive-cum-convenient sampling method is used in selecting participants.
Population: The target population for this research for this study is the customers who are using Reliance JIO in
Vijayawada, Andhra Pradesh
Sample Frame: Customers using Reliance JIO in Vijayawada
SAMPLE SIZE:
A purposive cum-convenient sampling method is employed. 300 sample respondents are chosen on the basis of their
being readily available/accessible at Vijayawada
DATA COLLECTION:
It is a descriptive research, where the data is collected from both primary and secondary sources; the primary sources are
collection of opinions and behaviors of the population using a structured questionnaire and secondary sources like
previous researches in this field, various journals, books and websites.
INSTRUMENTS USED: The researchers used the personally administrated and online survey questionnaires as a data
collection method.
STATICTICAL TOOL:
The data was analyzed using Ms Excel and presented in inform of chart and tables.
ANALYSES OF ATTITUDE AND OPINIONS OF RESPONDENTS
Table: 1
Age (completed years)
SI. No Age Number Percent
1 10-20 14 4.6%
2 20-30 108 36.0%
3 30-40 112 37.0%
4 40-50 36 12.0%
5 50-60 14 4.7%
6 60-70 8 2.7%
7 70-80+ 8 2.7%
Total 300 100%
Source: Field Survey
Diagram:1
AGE DISTRIBUTION OF
RESPONDENTS
120 108 112
100
80
60 Number
36.00 37.00 36 Percent
40
20 14 12.00 14
4.60 4.70 82.70 82.70
0IAETSD JOURNAL FOR ADVANCED RESEARCH IN APPLIED SCIENCES ISSN NO: 2394-8442
An analysis of diagram 1 shows the age distribution of the respondents. The table reveals that out of 300 respondents,
majority 112(37.0%) are in the age group of 31-40 years, followed by 108 (36.0%) between 21-30 years. 36(12.0%) between
41-50 years. The average of respondents is 34.46 and S.D. is 12.4 and mode is 30.5.
Tabl.2 Sex
Sex Number Percent
1 Male 162 54.0%
2 Female 138 46.0%
Total 300 100%
Source: Field survey
Diagram: 2
Sex distribution of respondents
180
162
160
138
140
120
100
Male
80
Female
60 54
46
40
20
0
Number Percent
Source: Table 2
An analysis of the diagram shows the sex distribution of the respondent. Out of 300 the respondent majority 162
(54 percent) are males and rest 138 (46 percent) are males. Generally males use to undertake purchase activities while
females are busy with their work at home.
Place of Birth: The frequency distribution of the respondents in terms of their place of birth is presented in the table
No. 3
Table 3: Place of birth
SL. No. Place Number Total Percent
Male Female
1 Rural 69 41 110 36.7
2 Urban 93 97 190 63.3
Total 162 138 300 100
Source: field survey
VOLUME 5, ISSUE 1, JAN/2018 391 http://iaetsdjaras.org/IAETSD JOURNAL FOR ADVANCED RESEARCH IN APPLIED SCIENCES ISSN NO: 2394-8442
Diagram:
PLACE OF BIRTH OF RESPONDENTS
200 Urban, 190
180
160
140
120 Rural, 110
100 Rural
80 Urban
Urban, 63.3
60
Rural, 36.7
40
20
0
Number Percent
Source: Table 3
An analysis of the diagram shows the place of birth of the respondents. Out of 300 respondents majority 190(63.3%)
respondent’s place of birth was urban area and 110 (36.7) respondent place of birth was rural.
Table 4
Religion of the Respondents
SL. No Religion Number Percent
1 Hindu 178 59.3
2 Muslim 50 16.7
3 Christian 38 12.7
4 Others 34 11.3
Total 300 100
Source: Field survey
Diagram:4
Religion of the Respondents in the study area
34, 11%
38, 13%
Hindu
50, 17% 178, 59% Muslim
Christian
Others
Source: Table no. 4
VOLUME 5, ISSUE 1, JAN/2018 392 http://iaetsdjaras.org/IAETSD JOURNAL FOR ADVANCED RESEARCH IN APPLIED SCIENCES ISSN NO: 2394-8442
An analysis of the diagram shows the religion of the respondents. Out of 300 respondents’ majority 178(59%) are
Hindus followed by 50(16.7) are Muslims, 38(12.7) are Christians. The study represents all major religions in the country
state.
Table: 5
State
SL. No. State Number Percent
1 A.P. 189 63
2 Other than A.P. 111 37
Total 300 100
Source: Field Survey
Diagram: 5
State of the respondents in the study area
200 189
180
160
140
120 111
100 A.P
80 Other A.P
63
60
37
40
20
0
Number Percent
Source: Table 5
An analysis of the table shows the state of the respondents belongs. Out of 300 respondents’ majority 189(63.0%)
respondents belong to A.P. and remaining 111 (37%) belong other than AP. This is the general pattern usually observed in
the Indian society.
Table: 6
Literacy and Education
SL. No Education Number Percent
1 Primary 0 0
2 Secondary 11 3.67
3 High school 24 8.00
4 Intermediate 71 23.67
5 Graduation 88 29.33
6 Post-Graduation 87 29.00
7 Ph.D 19 6.33
Total 300 100
Source: Field Survey
VOLUME 5, ISSUE 1, JAN/2018 393 http://iaetsdjaras.org/IAETSD JOURNAL FOR ADVANCED RESEARCH IN APPLIED SCIENCES ISSN NO: 2394-8442
Diagram: 6
Literacy and Education
100
88 87
90
80 71
70
60
50
40 29.33 29 Number
30 24 23.67
19
20 Percent
11 8
3.67 6.33
10 0 0
0
Source: Table 6
An analysis of diagram shows the education of the respondents. Out of 300 respondents majority 88(29.331%) are studied
graduation, followed by 87(29%) post-Graduation and 71 (23.67%) are intermediate, 24(8%) are high school, 19(6.33%)
are ph.D, 11(3.67%) are secondary education.
Table 7
Marital Status
SL. No. Marital Status Number Percent
1 Married 192 64.00
2 Unmarried 108 36.00
Total 300 100
Source: Field survey
MARITAL STATUS
108, 36%
Married
Unmarried
192, 64%
Source: Table 7
An analysis of diagram shows the marital status distribution of the respondents. Out of 300 respondents, majority
192(64.0%) are married 108(36.0%) are unmarried,
VOLUME 5, ISSUE 1, JAN/2018 394 http://iaetsdjaras.org/IAETSD JOURNAL FOR ADVANCED RESEARCH IN APPLIED SCIENCES ISSN NO: 2394-8442
Table 8
Occupation of the Respondents
SL. No Occupation Number Percent
1 Farmer 12 4.00
2 Business 42 14.00
3 Private employee 69 23.00
4 Govt employee 32 10.67
5 Student 101 33,67
6 House wife 23 7.66
7 Retired employee 21 7.00
Total 300 100
Source: Field Survey
Diagram: 8
OCCUPATION OF THE RESPONDENTS
120
101
100
80 69
60 Number
42
40 32 33.67 Percent
23 23 21
20 12 14 10.67
4 7.66 7
0
Farmer Business Private Govt Student House wife Retired
employee employee employee
Source: table 8
An analysis of the diagram shows occupation of the respondents. Out of 300 respondents majority 101(33.67%)
respondents are students, followed by 69(23%) respondents occupation is private employment, followed by 42 (14%) are
in business,32(10.67%) are Govt. employees,23(7.66%) are housewives,21(7.0%) are retired employees,12(4.0%) are
farmers in the study area
Table 9
Income of the Respondent (P.A)
SL. No. Income Number Percent
1 Below 1 lakhs 20 6.67
2 1-3 lakhs 92 30.67
3 3-5 lakhs 112 37.33
4 5-7 lakhs 41 13.67
5 7-9 lakhs 10 3.33
6 9-11 lakhs 13 4.33
7 11 lakhs+ 12 4.00
Total 300 100
Source: Field survey
VOLUME 5, ISSUE 1, JAN/2018 395 http://iaetsdjaras.org/IAETSD JOURNAL FOR ADVANCED RESEARCH IN APPLIED SCIENCES ISSN NO: 2394-8442
Diagram: 9
Income of the Respondent (P.A)
120 112
100 92
80
60 Number
37.33 41
40 30.67 Percent
20
20 13.67 10 13 12
6.67 3.33 4.33 4
0
Below 1 1-3 3-5 5-7 7-9 9-11 11
lakhs lakhs lakhs lakhs lakhs lakhs lakhs+
Source: Table 9
An analysis of the diagram shows the income of the respondents. Out of 300, majority 112(37.33%) are earning
an income 3 lakhs – 5 lakhs, 92 (30.67%) earning between 1 lakhs – 3 lakhs, 41(13.67%) between 5 lakhs – 7 lakhs.
20(6.67%)respondents annual income s are below one lakh,13(4.33%) annual income s are 9 lakhs-11 lakhs, 12(4.0%)
respondents annual income is 11 lakhs and more, 10(3.33%) respondents annual incomes are in between 7-9 lakhs in the
study area
Table: 10
Major buying influencer of JIO in the study area
SL. No INFLUENCER Number Percent
1 Self 69 23.00
2 Spouse 42 14.00
3 Children 33 11.00
4 Elders 32 10.67
5 Friends 80 26.67
6 Relatives 21 7.00
7 Peers 23 7.66
Total 300 100
Source: Field Survey
Diagram: 10
MAJOR INFLUENCER TO GO FOR JIO
23, 8%
21, 7% Self
Spouse
69, 23%
Children
Elders
80, 27% 42, 14%
Friends
32, 33, Relatives
10 11
% Peers
%
Source: Table: 10
VOLUME 5, ISSUE 1, JAN/2018 396 http://iaetsdjaras.org/IAETSD JOURNAL FOR ADVANCED RESEARCH IN APPLIED SCIENCES ISSN NO: 2394-8442
An analysis of the diagram shows who influenced to take JIO connection of the respondents. Out of 300 respondents
majority 80(26.67%) respondents are influenced by friends, followed by 69(23%) respondents are self-influenced, followed
by 42 (14%) are influenced by spouse,33(11%) are influenced by children,32(10.67%) are influenced by elders,23(7.66%)
are influenced by peers,21(7.0%) are influenced by relatives in the study area
Table 11
For how long you have been using JIO
SL. No How long Number Percent
1 1-6 Months 95 31.67
2 7-12 Months 186 62.00
3 Above 1 year 19 6.33
Total 300 100
Source: Field survey
Diagram: 11
For how long you have been using JIO
200
186
180
160
140
120
100 95 Number
Percent
80
62
60
40 31.67
19
20
6.33
0
1-6 Months 6-12 Months Above 1 year
Source: Table 11
An analysis of the diagram shows the how long the respondents have been using JIO. Out of the 300respondents, majority
186(62.0%) are using JIO between 6months – 1 year, followed by 95(31.67%) between 0-6 months),19(6.33%)
respondents are using from more than a year in the study area
VOLUME 5, ISSUE 1, JAN/2018 397 http://iaetsdjaras.org/IAETSD JOURNAL FOR ADVANCED RESEARCH IN APPLIED SCIENCES ISSN NO: 2394-8442
Table No. 12
Analysis of the opinions of the respondents behind the reasons to purchase Reliance JIO in the study area
Rank the following factors
RANK Pan-India Strong Relatively Advanta spe Valu Pro Establishe
Strongest presence ecosyst cheaper ge of ed e moti d dealer
fiber ems tariffs spectru for onal network
backbone m mon activ
ey ities
Rank 1 99(33.00%)
Rank 2 29(9
.66
%)
Rank 3 81(27%
)
Rank 4 19(6.34%)
Rank 5 33(11.00%
)
Rank 6 12(4.00
%)
Rank 7 12(4
%)
Rank 8 11(3
.67
%)
Rank 9 4(1.33%)
Source: Field survey
Rank analysis of the table shows that out of 300 respondents, majority 99(33.00%) respondents are awarded rank 1 for
relatively cheaper tariffs, followed by81(27.00%) respondents are ranked 3 for ecosystems(more features), 33(11.00%)
respondents are ranked 5 for strongest fiber backbone,29(9.66%) are ranked 2 for speed,12(4.00%) are ranked 7 for value
for money,11(3.60%) ranked 8 for promotional activities, 4(1.33%) respondents are ranked 9 for strong dealer network in
the study area.
Table No. 13
Loyal customer for JIO
factor Highly disagree Average agree Highly Total
disagree agree
I will continue as a loyal 8(3%) 12(4%) 55(18%) 91(30%) 134(45%) 300
customer for JIO
Source: Field survey
VOLUME 5, ISSUE 1, JAN/2018 398 http://iaetsdjaras.org/IAETSD JOURNAL FOR ADVANCED RESEARCH IN APPLIED SCIENCES ISSN NO: 2394-8442
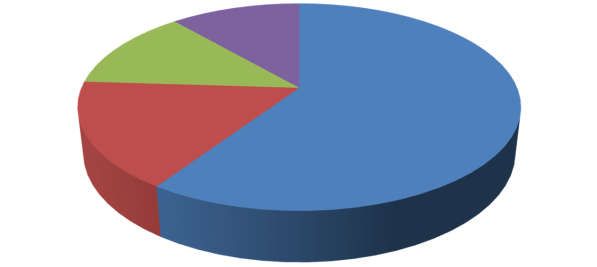
Diagram: 13
I will continue as a loyal customer for JIO
12, 4%
16, 5%
Highly disagree
38, 13% disagree
135, 45%
Average
99, 33% agree
Highly agree
Source: Table 13
An analysis of the diagram shows the how many respondents will continue as a loyal customer to JIO. Out of the
300respondents, majority 134(45.0%) are highly agree that they will continue as a loyal customer to JIO, followed by
91(30%) respondents will continue as a loyal customer to JIO, 55(18.%) respondents are neutral,12(4%) are disagree and
8(3%) strongly disagree in study area
Table 14
JIO is first choice
factor Highly disagree Average agree Highly agree Total
disagree
I consider JIO 12(4.00%) 8(3.00%) 48(16.00%) 89(30.00%) 143(47.00%) 300
is my first
choice in this
category
Source: Field survey
Diagram: 14
I consider JIO is my first choice in this category
12, 4% 8, 3%
48, 16% Highly disagree
disagree
143, 47%
Average
agree
89, 30% Highly agree
Source: Table 14
VOLUME 5, ISSUE 1, JAN/2018 399 http://iaetsdjaras.org/IAETSD JOURNAL FOR ADVANCED RESEARCH IN APPLIED SCIENCES ISSN NO: 2394-8442
An analysis of the diagram shows the how many respondents first choice is JIO in this category. Out of the
300respondents, majority 143(47.0%) are highly agree that JIO is their first choice in this category, followed by
89(30%)respondents first choice is JIO ,48(16.%) respondents are neutral,8(3%) are disagree and 12(4%) strongly
disagree that JIO is not their first choice in this category in the study area
Table 15
Positive things about JIO
factor Highly disagree Average agree Highly Total
disagree agree
I say positive things about JIO 2(1%) 4(1%) 33(11%) 107(36%) 154(51%) 300
to other people
Source: Field survey
Diagram: 15
I say positive things about JIO to other people
2, 1% 4, 1%
33, 11%
Highly disagree
disagree
Average
154, 51%
107, 36% agree
Highly agree
Source: Table 15
An analysis of the diagram shows the how many respondents say positive things about JIO to other people. Out of the
300respondents, majority 154(51.0%) are highly agree that they say positive things about JIO to other people. followed by
107(36%) are agree, 33(11. %) respondents are neutral, 4(1%) are disagree and 2(1%) strongly disagree in the study area
Table 16
Recommend JIO
Highly disagree Average agree Highly Total
factor disagre agree
e
I recommend JIO to 9(3%) 11(4%) 18(6%) 104(34%) 158(53%) 300
someone who seeks my
advice
Source: Field survey
VOLUME 5, ISSUE 1, JAN/2018 400 http://iaetsdjaras.org/IAETSD JOURNAL FOR ADVANCED RESEARCH IN APPLIED SCIENCES ISSN NO: 2394-8442
Diagram: 16
I recommend JIO to someone who seeks advice
9, 3% 11, 4%
18, 6%
Highly disagree
disagree
Average
158, 53% 104, 34% agree
Highly agree
Source: Table 16
An analysis of the diagram shows the how many respondents recommend JIO to someone who seeks advice. Out of the
300respondents, majority 158(53.0%) are highly agree that they recommend JIO, followed by 104(34%) are agree, 18(6. %)
respondents are neutral, 11(4%) are disagree and 9(3%) strongly disagree in the study area
Table 17
Intend to recommend JIO
factor Highly disagree Average agree Highly Total
disagree agree
I intend to recommend JIO to 0 9(3%) 22(7%) 114(38%) 155(52%) 300
other people
Source: Field survey
Diagram: 17
I recommend JIO to other people
0, 0% 9, 3%
22, 7%
Highly disagree
disagree
Average
155, 52%
114, 38% agree
Highly agree
Source: Table 17
VOLUME 5, ISSUE 1, JAN/2018 401 http://iaetsdjaras.org/IAETSD JOURNAL FOR ADVANCED RESEARCH IN APPLIED SCIENCES ISSN NO: 2394-8442
An analysis of the diagram shows the how many respondents recommend JIO to other people. Out of the
300respondents, majority 158(53.0%) are highly agree that JIO is their first choice for next few years, followed by
104(34%)t their first choice is JIO for coming years,18(6.%) respondents are neutral,11(4%) are disagree and 9(3%)
strongly disagree that JIO is not their first choice in coming years in the study area
Table 18
factor Highly disagree Average agree Highly agree Total
disagree
I consider JIO 12(4.00%) 16(5.00%) 38(13.00%) 99(33.00%) 135(45.00%) 300
is my first
choice in the
next few years
Source: Field survey
Diagram: 18
I consider JIO is my first choice in the next few years
12, 4%
16, 5%
Highly disagree
38, 13%
disagree
135, 45%
Average
agree
99, 33% Highly agree
Source: Table 18
An analysis of the diagram shows the how many respondents first choice is JIO in the next few years. Out of the
300respondents, majority 135(45.0%) are highly agree that JIO is their first choice for next few years, followed by
99(33%)respondents first choice is JIO for coming years,38(13.%) respondents are neutral,16(5%) are disagree and
12(4%) strongly disagree that JIO is not their first choice in coming years in the study area
Table 19
0verall satisfaction on JIO
factor Highly dissatisfie Average Satisfied Highly Total
dissatisfied d satisfied
Overall satisfaction 0 5(2%) 15(5%) 91(30%) 189(63%) 300
on JIO
Source: Field survey
VOLUME 5, ISSUE 1, JAN/2018 402 http://iaetsdjaras.org/IAETSD JOURNAL FOR ADVANCED RESEARCH IN APPLIED SCIENCES ISSN NO: 2394-8442
Diagram: 19
Overall satisfaction on JIO
0, 0% 5, 2%
15, 5%
Highly dissatisfied
dissatisfied
91, 30%
Average
satisfied
189, 63%
Highly satisfied
Source: Table 19
An analysis of the diagram shows the overall satisfaction of customers to JIO. Majority 189(63.0%) are highly satisfied
with the JIO network, followed by 91(30%) respondents are satisfied, 15(5. %) respondents are neutral, 5(2%) are disagree
and in study area
FINDINGS
Majority 112(37.0%) are in the age group of 31-40 years, followed by 108 (36.0%) between 21-30 years. 36(12.0%)
between 41-50 years. majority 162 (54 percent) are males and rest 138 (46 percent) are males.
Majority 190(63.3%) respondent’s place of birth was urban area and 110 (36.7) respondent place of birth was rural.
Majority 178(59%) are Hindus followed by 50(16.7) are Muslims, 38(12.7) are Christians. The study represents all major
religions in the country state.
Majority 189(63.0%) respondents belong to A.P. and remaining 111 (37%) belong other than AP.
Majority 88(29.331%) are studied graduation, followed by 87(29%) post-Graduation and 71 (23.67%) are intermediate,
24(8%) are high school, 19(6.33%) are ph.D, 11(3.67%) are secondary education.
majority 192(64.0%) are married 108(36.0%) are unmarried, Out of 300 respondents majority 101(33.67%) respondents
are students. followed by 69(23%) respondents occupation is private employment, followed by 42 (14%) are in
business,32(10.67%) are Govt. employees,23(7.66%) are housewives,21(7.0%) are retired employees,12(4.0%) are farmers
in the study area
Majority 112(37.33%) are earning an income 3 lakhs – 5 lakhs, 92 (30.67%) earning between 1 lakhs – 3 lakhs, 41(13.67%)
between 5 lakhs – 7 lakhs. 20(6.67%)respondents annual income s are below one lakh,13(4.33%) annual income s are 9
lakhs-11 lakhs, 12(4.0%) respondents annual income is 11 lakhs and more, 10(3.33%) respondents annual incomes are in
between 7-9 lakhs in the study area
Majority 80(26.67%) respondents are influenced by friends, followed by 69(23%) respondents are self-influenced,
followed by 42 (14%) are influenced by spouse,33(11%) are influenced by children,32(10.67%) are influenced by
elders,23(7.66%) are influenced by peers,21(7.0%) are influenced by relatives in the study area
Majority 186(62.0%) are using JIO between 6months – 1 year, followed by 95(31.67%) between 0-6 months), 19(6.33%)
respondents are using from more than a year in the study area
Majority 99(33.00%) respondents are awarded rank 1 for relatively cheaper tariffs, followed by81(27.00%) respondents
are ranked 3 for ecosystems(more features), 33(11.00%) respondents are ranked 5 for strongest fiber backbone,29(9.66%)
are ranked 2 for speed,12(4.00%) are ranked 7 for value for money,11(3.60%) ranked 8 for promotional activities,
4(1.33%) respondents are ranked 9 for strong dealer network in the study area.
VOLUME 5, ISSUE 1, JAN/2018 403 http://iaetsdjaras.org/IAETSD JOURNAL FOR ADVANCED RESEARCH IN APPLIED SCIENCES ISSN NO: 2394-8442
Majority 134(45.0%) are highly agree that they will continue as a loyal customer to JIO, followed by 91(30%) respondents
will continue as a loyal customer to JIO, 55(18.%) respondents are neutral,12(4%) are disagree and 8(3%) strongly
disagree in study area
majority 143(47.0%) are highly agree that JIO is their first choice in this category, followed by 89(30%)respondents first
choice is JIO ,48(16.%) respondents are neutral,8(3%) are disagree and 12(4%) strongly disagree that JIO is not their first
choice in this category in the study area
Majority 154(51.0%) are highly agree that they say positive things about JIO to other people. followed by 107(36%) are
agree, 33(11. %) respondents are neutral, 4(1%) are disagree and 2(1%) strongly disagree in the study area
Majority 158(53.0%) are highly agree that they recommend JIO, followed by 104(34%) are agree, 18(6. %) respondents are
neutral, 11(4%) are disagree and 9(3%) strongly disagree in the study area
Majority 158(53.0%) are highly agree that JIO is their first choice for next few years, followed by 104(34%)t their first
choice is JIO for coming years,18(6.%) respondents are neutral,11(4%) are disagree and 9(3%) strongly disagree that JIO
is not their first choice in coming years in the study area
Majority 135(45.0%) are highly agree that JIO is their first choice for next few years, followed by 99(33%)respondents first
choice is JIO for coming years,38(13.%) respondents are neutral,16(5%) are disagree and 12(4%) strongly disagree that
JIO is not their first choice in coming years in the study area
Majority 189(63.0%) are highly satisfied with the JIO network, followed by 91(30%) respondents are satisfied, 15(5. %)
respondents are neutral, 5(2%) are disagree and in study area
CONCLUSION
Customer loyalty is an important element for a brand’s long-term feasibility. It helps a company face many vagueness
problems in a severe competitive market. The success or failure of company depends upon the long-term associations with
the customers. In order to maintain the long term relations companies has to create better competitive environment for
customers.
Based on the research results, majority of the customers are satisfied with the performance of Reliance JIO when compare
to other competitors. As per the analysis of the study, Reliance JIO mobile telecom provider paying more attention to
providing relevant quality service elements (strongest fiber network, pan India presence, relatively cheaper tariffs,
advantage of broad spectrum and speed, call clarity ) to meet customers’ needs. That’s why majority of the customer’s first
choice is Reliance Jio in this category and want to be loyal for Reliance Jio for coming years. It is also recommended that,
Reliance JIO should ensure that their network is reliable and convenience so that their customers can remain loyal to
them. Reliance JIO is adopted by majority of the customers for competent tariffs, wide coverage, speed, and more
features. These things have to be maintained in the near future to keep the customer as loyal customer.
ACKNOWLEDGEMENTS
The authors wish to thank all the general public who voluntarily participated in the study. The authors also wish to thank
K L University Business School students who visited doctor’s premises and collected the information. This research
received no specific grant from any funding agency in the public, commercial, or not-for-profit sectors.
References
1. Kotler, P., & Keller, K. L. (2012). Framework for marketing management. Pearson Education India.
2. Eshghi, A., Haughton, D. & Topi, H. (2007) “Determinants of customer loyalty in the wireless telecommunications industry”,
Telecommunications Policy. 31: 93-106
3. Uncles, M. D., Dowling, G. R., and Hammond, K. (2003). Customer Loyalty and Customer Loyalty Programs. Journal of Consumer
Marketing, 20, 294-316.
VOLUME 5, ISSUE 1, JAN/2018 404 http://iaetsdjaras.org/IAETSD JOURNAL FOR ADVANCED RESEARCH IN APPLIED SCIENCES ISSN NO: 2394-8442
4. Serkan, A. and Gorhan, O. (2004). The Analysis of Antecedents of Customer Loyalty in the Turkish Mobile Telecommunication Market.
European Journal of Marketing. 39, 910-925.
5. Andreassen, T. W. and Linstead, B. (1998). The Effect of Corporate Image in the Formation of Customer Loyalty. Journal of Service
Research, 1 (1), 82-92.
6. Oliver, R. L. (1997). Satisfaction: A Behavioural Perspective on the Customer. New York: McGraw-Hill. [6] Bowen, J. T. and Shoemaker,
S. (1998). Loyalty: A Strategic Commitment? Cornel Hotel and Restaurant Administration Quarterly, 12-25.
7. Aaker, D.A.,1991. Managing Brand Equity: Capitalizing on the Value of a Brand Name, New York: The Free Press.
8. ITU World Communication (2013) The World in 2013, ICT facts and figures [online], retrieved from (http://www.itu.int/ITU) on 10th
November, 2013
9. Pritchard, M.P. and Howard, D. R. (1997). The Loyal Traveler: Examining a Typology of Service Patronage. Journal of Travelers
Research, 35 (4), 2
VOLUME 5, ISSUE 1, JAN/2018 405 http://iaetsdjaras.org/You can also read