The CONDUITS KPIs and DST - Tools to support the prediction and assessment of the wider policy impacts of traffic management measures and ITS
←
→
Page content transcription
If your browser does not render page correctly, please read the page content below
The CONDUITS KPIs and DST

   Tools to support the prediction and
assessment of the wider policy impacts of
 traffic management measures and ITS
CONTENTS

1. The CONDUITS set of indicators

2. The case studies of the European project CONDUITS

3. The CONDUITS DST (Decision Support Tool)

4. The Brussels case study : VISSIM

5. The Stuttgart case study : 2MOVE2 (CIVITAS)

6. The Tel Aviv case study

7. Future developments

                                                 2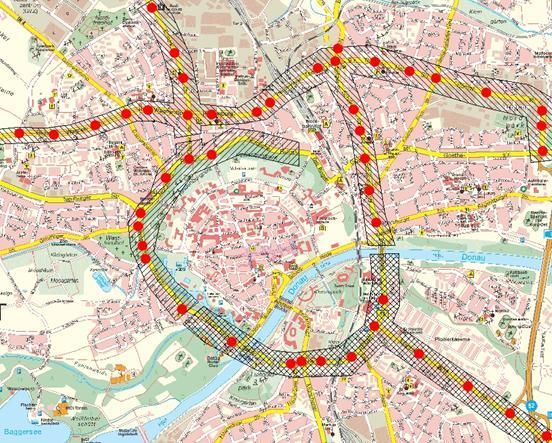
Cities needs when they have to chose an ITS
Neutral assessment of ITS in urban environment
Ratio cost/benefit of an ITS investment
Assess the usefulness of an ITS as a whole
Identify the limits of an ITS
Decision Support Tool (DST) for traffic managers and
decision makers
Allow comparison between different ITS solutions
Control/assessment of an ITS implementation
Possibility of sharing results between cities
3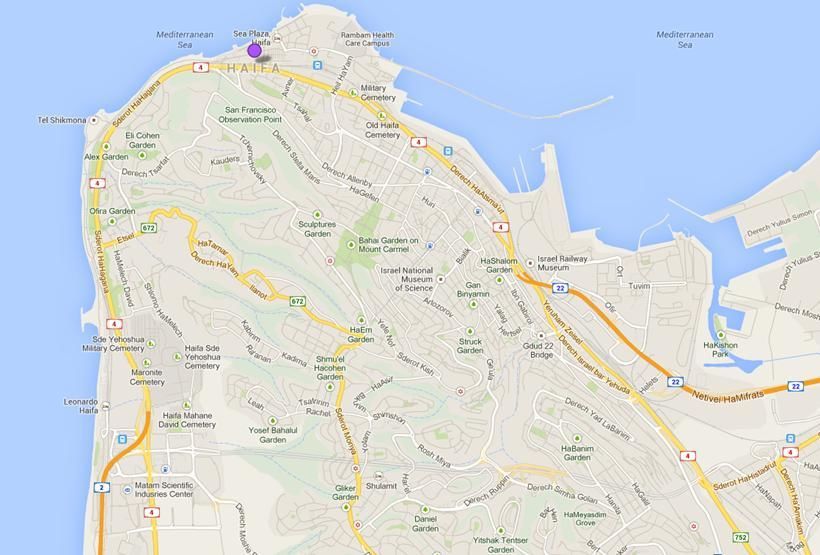
Solution: KPIs with specific requirements
Key Performance Indicators (KPIs) easy to use and
communicate to decision makers and public
No or light extra work for the users
Clarity for the political decision makers and the public
Adapted to cities individuality
Geographical scale :
sections, roads, zones, network, …
Adaptability :
Ability to use all kind of urban data that are
relevant to quantify a performance
Weighting possibilities
4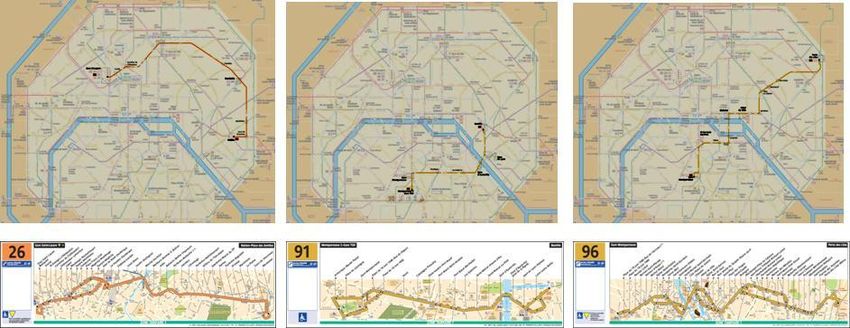
The CONDUITS European R&D project goal and objectives
Goal of the CONDUITS project
To establish a coherent set of Key Performance
Indicators (KPIs) for ITS used for urban traffic
management
Main objectives
To define a set of Key Performance Indicators for
identifying best practices and best technologies
To test these KPIs through real applications in
Paris,
Rome,
Tel-Aviv,
Munich
Ingolstadt
5
Objectives - Goal - Performance

                       Goal : improve attractiveness
                            of public transport

       Objective : Reduce public                     Objective : Improve
        transport waiting time                      the public transports
              in junctions                                reliability

 IP : Average        IP : % of vehicles   IP : Variance of headway      IP : % of vehicles
waiting time at       stopping at stop      between consecutive       arriving at the station
   stop line                lines           vehicles at the station           on time

                  Data chosen to measure the Performance :
                         Vehicle’s momentary location

                                                                                    6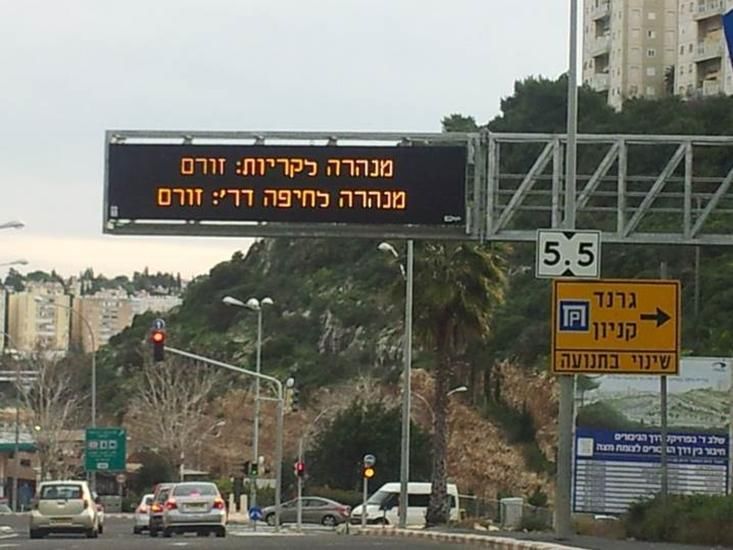
The CONDUITS set of indicators

                                 7
CONTENTS

1. The CONDUITS set of indicators

2. The case studies of the European project CONDUITS

3. The CONDUITS DST (Decision Support Tool)

4. The Brussels case study : VISSIM

5. The Stuttgart case study : 2MOVE2 (CIVITAS)

6. The Tel Aviv case study

7. Future developments

                                                 8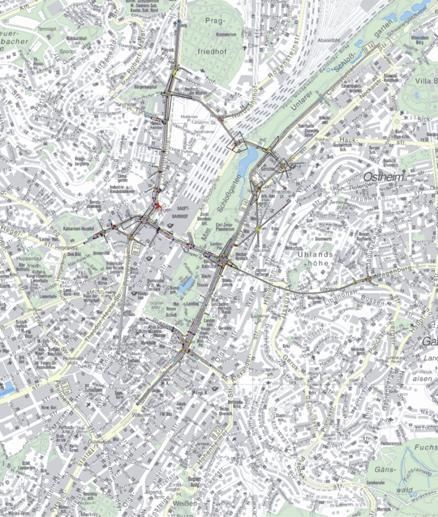
CONDUITS case studies and their KPIs
Paris : Implementation of a priority system to 3 bus lines
and Construction of a new tram line
Traffic efficiency: mobility for buses and tram
Traffic safety: accidents for buses and tram
Rome : General assessment of traffic efficiency
Traffic efficiency: mobility, reliability
Tel Aviv : Implementation of new signal strategies
Traffic efficiency: reliability
Munich-Ingolstadt : Application of feedback signs for
drivers and Adaptive traffic signal control
Traffic safety: direct impacts, indirect impacts
9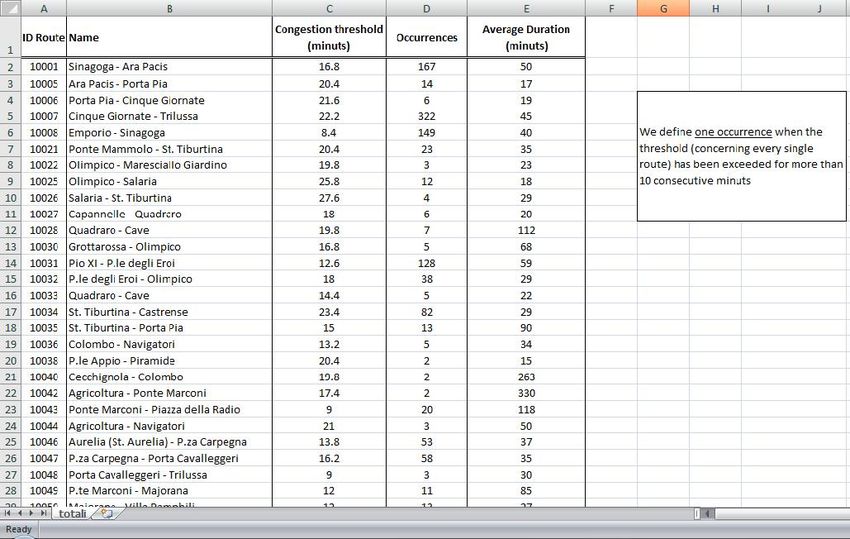
Test in Paris – Bus priority (1)
Priority on lines 26, 91, 96
Implementation in 2006
Anticipated average travel time
savings about 30s per trip, allowing 1 bus less for each line
10Test in Paris – Bus priority (2)
Supplied data
Bus travel times on a number of specific segments
of given length on the 3 bus lines, before and after
Vehicle traffic speeds on a number of specific
segments of given length, affected by the priority
measures on the 3 bus lines, before and after
Casualty numbers due to road traffic accidents on a
number of specific segments affected by the priority
measures on bus line 91, over given periods before
and after
Vehicle traffic flows on the given segments, before
and after
11Test in Paris – Bus priority (3)
Traffic efficiency: Mobility index
minutes/km, weighted for public and private transport
Traffic safety: Accidents index
casualties per million vehicles, severity weighted
12Test in Paris – Bus priority (4)
Traffic efficiency: Mobility index
Separately for public and private transport
Public transport mobility Private transport mobility
min/km
Before After Before After
Line 26 4.46 4.25 4.46 4.65
Line 91 4.63 4.33 5.25 5.05
Line 96 5.03 4.67 2.71 3.02
TOTAL 4.71 4.42 4.21 4.26
Combined, with wPT = 0.7 and wPV = 0.3
IMOB
min/km
Before After
Line 26 4.46 4.37
Line 91 4.82 4.54
Line 96 4.33 4.17
TOTAL 4.56 4.37
13Test in Paris – Bus priority (5)
Traffic safety: Accidents index
Separated by levels of gravity
Deads Serious injuries Slight injuries
Line 91 Weighting
Before After Before After Before After
Cycles 0,25 0 0 0 2 3 5
2 wheelers 0,20 0 0 3 3 71 36
4 wheelers 0,15 2 0 0 1 27 20
Pedestrians 0,40 1 1 6 11 51 51
Casualties/million vehicles 0.07 0.04 0.31 0.63 4.10 3.57
Combined, with wDEAD = 0.85, wSER = 0.1, wSL = 0.05
Casualties/ IACD
million vehic. Before After
Line 91 0.30 0.28
14Test in Paris – Tramway (1)
Construction of tramway line T3 in 2006 at Boulevards
des Maréchaux
It was anticipated to achieve the following goals:
• Average speed
of 20km/h
• Daily traffic of
100,000
travellers
• Regularity of
the line with a
tram every
4 min
15Test in Paris – Tramway (2)
Supplied data
Tram travel times on the entire route, only after
Vehicle traffic speeds on the entire route of the
tram, before and after
Casualty numbers due to road traffic accidents on
the entire route, over given periods before and after
Vehicle traffic flows on the entire route, before and
after
16Test in Paris – Tramway (3)
Traffic efficiency: Mobility index
Separately for public and private transport
Public transport Private transport
min/km mobility mobility
Before After Before After
Tram T3 N/A 3.54 2.90 4.06
Combined, with wPT = 0.7, wPV = 0.3
IMOB
min/km
Before After
Tram T3 N/A 3.70
17Test in Paris – Tramway (4)
Traffic safety: Accidents index
For each severity level
Deaths Serious injuries Slight injuries
Tram T3 Weight
Before After Before After Before After
Cycles 0.25 0 0 1 0 6 7
2-wheelers 0.2 0 0 5 7 67 54
4-wheelers 0.15 0 0 1 0 67 19
Pedestrians 0.4 1 0 5 1 32 14
Casualties/million-vehicles 0.09 0.00 0.73 0.77 8.12 9.03
Total, with wDEAD = 0.85, wSER = 0.1, wSL = 0.05
Casualties/ IACD
million-vehicles Before After
Tram T3 0.55 0.53
18Test in Rome - General assessment (1)
Several techniques and
technologies, including ITS, are
used for traffic management in
the entire Greater Rome area
Supplied data:
Travel times for public transport and private cars
between all zones of the city and lengths of these routes
Occurrences of congestions and their average
duration on certain key routes of the urban road
network during one year
19Test in Rome - General assessment (2)
Traffic efficiency: Mobility index
minutes/km, weighted for public and private transport
Traffic efficiency: Reliability index
dimensionless, weighted by link and mode
20Test in Rome - General assessment (3)
Traffic efficiency: Mobility index
Separately for public and private transport
Public transport mobility Private transport mobility
min/km
Before After Before After
Rome N/A 5.41 N/A 3.20
Combined, with wPT = 0.7, wPV = 0.3
IMOB
min/km
Before After
Rome N/A 4.75
21Test in Rome - General assessment (4)
Traffic efficiency: Reliability index
Routes weighted equally (assumption)
IREL = 0.9959
22Reliability Index of Traffic efficiency
TCongestion
4
TCongestion TCongestion
LOS
3
LOS
Speed
2
Travel time 1
… 0
0 1 2 3 4 5 6 7 8 9 10 11 12 13 14 15 16 17 18 19 20 21 22 23
Hour
30
80
25
70
TCongestion TCongestion
20 60
Travel Time
50 TCongestion TCongestion
Speed
15
40
10 30
20
5
10
0 0
0 2 4 6 8 10 12 14 16 18 20 22 24 0 2 4 6 8 10 12 14 16 18 20 22 24
Hour Hour
23Test Tel-Aviv – New signal strategies (1)
Recurrent Congestion during the
Afternoon / Evening peak hours
(~ 45 h/link/month)
Deployment of new traffic
management strategies
24Test Tel-Aviv – New signal strategies (2)
Supplied data
Level of Service (LOS) of Links in Ha’Shalom Arterial,
along with Links lengths and Weights
Duration of congestion of Links in Ha’Shalom Arterial
during the afternoon peak period
Weighting Methodology
Time Frames : 5 time frames to reflect
the typical traffic demand patterns
Link Categories : Arterial - Streets
Direction Categories
• Inbound (to the city centre)
• Outbound (out of the city centre)
25Test Tel-Aviv – New signal strategies (3)
Weightings
Inbound Outbound
Morning Afternoon Off Peak Morning Afternoon Off Peak
Peak Peak Peak Peak
Arterial 5 3 5 3 5 5
Local 4 2 3 2 4 3
Streets
The new Strategies were implemented during the Afternoon Peak
26Test Tel-Aviv – New signal strategies (4)
Results:
Comparing the index during afternoon peak hours two
months prior to the improvement of the signal program to
two months following the improvement indicates an average
increase of 36% in the index value.
The decrease in the congestion duration was higher (~41%)
General perception of representative travelers supported
this figure.
Within few months the decrease tendency of the index value
stopped and within one year the index value became stable.
27Test in Munich – Safety assessment (1)
Installation of two feedback
signs during a test period
Measuring speeds at two
urban streets (speed limits
50 and 30km/h) in both
driving directions
Flashing messages:
Slow down!
Thank you!
28Test in Munich – Safety assessment (2)
Supplied data
Time and Speed of each vehicle passing the location
Daily traffic volume and the number of vehicles
exceeding the speed
limit
Data available before
implementation, during
test period and after
implementation of the
feedback signs
29Test in Munich – Safety assessment (3)
Traffic Safety: direct safety impact
number of shown warning messages/day
average number for each time period: before
implementation, during test period and after
implementation
30Test in Munich – Safety assessment (4)
Traffic safety : direct impact index
Actions / Vehicle Before Test period After
1 Paosostrasse (direction east) 0.45 0.26 0.37
2 Paosostrasse (direction west) 0.73 0.48 0.70
3 Friedenspromenade (dir. north) 0.15 0.12 0.15
4 Friedenspromenade (dir. south) 0.29 0.18 0.30
Combined : with wL1 = 0.2, wL2 = 0.2 , wL3 = 0.3, wL4 = 0.3
IDS
Actions / Vehicle
Before Test period After
Paosostrasse &
0.37 0.24 0.35
Friedenspromenade
31Test in Ingolstadt – Safety assessment (1)
Congestion of the main axes during peak hours with
traffic management by static green waves
New adaptive green
waves management
Test of 2 kinds of
algorithms for
optimising green
waves :
Hillclimbing algorithm
Genetic algorithm
32Test in Ingolstadt – Safety assessment (2)
Supplied data
Floating Car Data (FCD) assessed in a representative
period by GPS-tracking of a small fleet of vehicles
Daily traffic volume via loop detectors
Data available before
implementation, during test
period of both algorithms
Scalability of calculation
Link (basis)
Route
Network
33Test in Ingolstadt – Safety assessment (3)
Traffic Safety: indirect safety impact
|L|
CS l
I IS U wl
lL DTVl
Critical situations: Number of occurrences speed
exceeded the threshold
Equal weighting of all links
Link-ID CSl DTV CSl/DTV
11001 2421 755 3,21 Separate
11002 2716 642 4,23
11003 251 58 4,30 calculation
11004 545 107 5,10 for each link
... ... ... ...
34Test in Ingolstadt – Safety assessment (4)
Traffic Safety: indirect safety impact
IIS-U on route level
IiS-U 5,00
4,50
Before Hillclimbing Genetic 4,00
3,50
3,00
Route 1 3,7 3,2 3 2,50
static
hillclimbing
2,00
1,50
Route 2 4,7 4,2 4,1
genetic
1,00
0,50
Route 3 4,4 4 3,5 0,00
Route 1 Route 2 Route 3
IIS-U on network level
Combined, with wl = 0,33 4,50
(equal for each route) 4,00
3,50
3,00
IiS-U 2,50
2,00
1,50
Before Hillclimbing Genetic 1,00
0,50
Network 4,3 3,8 3,5 0,00
static hillclimbing genetic
35CONTENTS
1. The CONDUITS set of indicators
2. The case studies of the European project CONDUITS
3. The CONDUITS DST (Decision Support Tool)
4. The Brussels case study : VISSIM
5. The Stuttgart case study : 2MOVE2 (CIVITAS)
6. The Tel Aviv case study
7. Future developments
36Following step : the CONDUITS DST
Implementation of KPIs requires consideration of
several dimensions
KPIs developed proved to reflect major phenomena
Educated decision making is based on data
KPIs developed can contribute to a better ITS
decision making
independent evaluation
37Following step : the CONDUITS DST
End of the CONDUITS project in May 2011
Educated decision making is based on data : KPIs developed
can contribute to a better ITS decision making and an
independent evaluation
Need of a DST easy to use by many cities in order to allow
the sharing/dissemination of the results
Financial sponsoring from Kapsch
Call for to ideas for the continuation
Proposal of Brussels: design of a calculation module for the
pollution indicator from files generated in a classic way by
VISSIM
Case study: Brussels
38CONTENTS
1. The CONDUITS set of indicators
2. The case studies of the European project CONDUITS
3. The CONDUITS DST (Decision Support Tool)
4. The Brussels case study : VISSIM
5. The Stuttgart case study : 2MOVE2 (CIVITAS)
6. The Tel Aviv case study
7. Future developments
39The Brussels case study
Priority bus line 49
Many intersections
with traffic lights
4 VISSIM simulations
Morning and
evening
peak hours
Situation before
and after
implementation
40The CONDUITS Decision Support Tool (DST)
1st step : automatic calculation of the Pollution KPI in
VISSIM simulations
avec
• KPIPollution : Pollution Performance Indicator
• WVT : Type of vehicle weighting factor
• WET : Type of emission weighting factor
• QVT,ET : Emissions by type of pollutant and by type
of vehicle
41The AIRE Model (Analysis of Instantaneous Road Emissions)
Instantaneous Emissions Model (IEM)
Passenger car & Heavy duty Emissions Model
(PHEM)
Graz Technical University
High accuracy for fuel consumption, CO2, NOx,
PM in the traffic micro-simulation models
42Estimation of the pollutant emissions by AIRE
IEM Tables Vehicles
records
Gradients
Loads
… • Acceleration
Engine type • Speed
• Location
• …
Estimation of the
pollutants
emissions
43Distributions used in AIRE (1)
Vehicle Types Fuel Types Axles Engine type Location
car petrol 2 2-stroke urban
lgv diesel 3 4-stroke rural
hgv rigid lpg 4 motorway
hgv artic electric 5
bus 1 deck 6+
bus mini
bus 2 decks
bus bendy
tram
coach
taxi
motorcycle
44Distributions used in AIRE (2)
Engine Gross vehicle Euro standard Vehicle Years
capacity weight loads
under 150cc under 2.5t pre-Euro I unladen 1996
150-250cc over 2.5 t I half-laden …
250-750cc 3.5-7.5t II fully-laden 2025
over 750cc 7.5-12t III
under 1.4l 12-14t IV
1.4-2.0l 14-20t V
under 2.0l 20-26t VI
over 2.0l 20-28t
26-28t
28-32t
28-34t
over 32t
34-40t
40-50t
45Calculation of the Pollution indicators
Vehicle
Records
CONDUITS DST
AIRE
Pollution Emissions Emissions
Input AIRE
KPI Aggregation Estimation
Files
Vehicle Records
Incl. Emissions
46Calculation of the Pollution indicators
47Expected results of the bus priority
Short-term
Increase average speed of the buses
Increase average speed of the private vehicles
displacement parallel to the line
Reduction average speed of vehicles crossing the line
Medium-term
Change of route choices for private car drivers
Reduction of time losses in the implementation area
Long-term
Demand shift towards public transport reduces private
car rides
48First results of the case study (1)
The first results reflect the expected short term effects
Improvement of the public transport quality:
• increase average speed of the buses
• reduction of the stops at intersections
Ave. Speed [km/h] Number of Stops [-]
19 12
11
18.5
18.5 -18 %
before
+ 3% + 6% 10
9 before
18 after after
8
17.3 17.4 7
17.5
16.8
6 - 43 %
17
4
4
16.5
16 2
15.5 0
southbound northbound southbound northbound
49First results of the case study (2)
but… increase in pollution
+ 3% + 7,5 %
… what is (hopefully) normal !
50First results of the case study (3)
• Sensitivity analysis with a pragmatic methodology
• The given demand levels of the
relevant flows are progressively
reduced in increments of 1% ~ - 1,8 %
• and the KPI values are
recalculated for each scenario.
Sensitivity analysis of the single pollutants
Pollutant Morning Evening
CO2 - 1,5% - 4,0% ~ - 3,9 %
NOx - 3,5% - 6,0%
PM10 - 0,5% - 3,0%
KPI Pollution - 1,8% - 3,9%
51Advantages of these Indicators
Same methodology for all the indicators
Calculation running with all kinds of data
Easy weighting of the parameters
Automatic calculation before, during and after the
implementation of an ITS by using the VISSIM files as
they are provided
Allow sharing results got in other cities for similar ITS
and the possibility to create a common DB with real
measurements
52Actual limits of these Indicators
It will be necessary to wait a few years before having
“before and after” data based on real measurements
Require a cost/benefit analysis to complete the set of
KPIs needed to cover the overall sustainability
assessment of an ITS
KPIs comparison between cities still needs an
agreement on common weighting
53Future developments planned in Brussels
Further steps : Road safety prediction module and
Road safety prediction module
Design of an integrated sustainability module using
CONDUITS KPIs for VISSIM micro simulations
Implementation of this integrated sustainability module
for VISUM macro simulations and OPTIMA simulations
54CONTENTS
1. The CONDUITS set of indicators
2. The case studies of the European project CONDUITS
3. The CONDUITS DST (Decision Support Tool)
4. The Brussels case study : VISSIM
5. The Stuttgart case study : 2MOVE2 (CIVITAS)
6. The Tel Aviv case study
7. Future developments
55The Stuttgart case study
The
Stuttgart
Measures
56The Stuttgart case study
Emission-based traffic control
Test site B14
- Main arterial road (3,5 km,
10 crossings, 2-3 lanes/direction)
- High traffic load, esp. in peak time
- High emissions
- Public transport, pedestrian
and bicycle crossings
Modelling emission impact by
Microscopic Simulation
57The Stuttgart case study
Emission-based traffic control
Test site B14
- Main arterial road (3,5 km,
10 crossings, 2-3 lanes/direction)
- High traffic load, esp. in peak time
- High emissions
- Public transport, pedestrian
and bicycle crossings
Modelling emission impact by
Microscopic Simulation
58The Stuttgart case study
Measures to reduce stop-and-go
traffic are going to be implemented
and tested:
Dynamic speed limit: 50 km/h and 40 km/h
(30 km/h on a section as recommendation)
Depending on immission situation or traffic situation
Speed enforcement by cameras
Start of operation middle of 2014
Increase public awareness for the measure
59The Stuttgart case study
Evaluation:
Comparison before (July 2013), intermediate (May 2014) and
after situation (October 2014)
Test of different scenarios for control strategy
Measuring of immissions by measurement stations (NO2, PM10)
Noise level (national guidelines)
Traffic counts/observation, travel time measurement, Compliance rates
Effects on pedestrians, public transport, cyclists and traffic safety
CONDUITS DST scenarios will be simulated
and can be validated according the actual observation
60The Stuttgart case study
Micro Simulation VISSIM -> CONDUITS/AIRE :
VISSIM single vehicle data every 0.5 s,
travel time, average speed, congestion, stops
CONDUITS/AIRE emissions NOx, PM10, CO2 -> emissions KPI
travel time aggregation
Other impacts waiting time for pedestrians/bicycles, accident
records, costs, sensitivity tests,
cost-benefit analysis
61The Stuttgart case study
62The Stuttgart case study
63The Stuttgart case study
64The Stuttgart case study
Advantages of the Conduits Tool for us so far:
Good transferability and therefore an easy adaption into
our system
Fast assistance and support in case of technical problems
Help to convince the city council with their decisions
Predictive scenario-based estimation of impacts
KPIs for Traffic efficiency and pollution
65CONTENTS
1. The CONDUITS set of indicators
2. The case studies of the European project CONDUITS
3. The CONDUITS DST (Decision Support Tool)
4. The Brussels case study : VISSIM
5. The Stuttgart case study : 2MOVE2 (CIVITAS)
6. The Tel Aviv case study
7. Future developments
66Other developments outside Brussels and Stuttgart
Tel Aviv
CIVITAS project 2MOVE2
• Bus priority case study
To be completed by middle of 2014.
KPIs: Traffic efficiency and Pollution
Haifa
Case study covers travel times in tunnel delivered
through VMS. Aim of giving travel times is to encourage
drivers to use tolled tunnel rather than alternative
congested route.
KPI: Traffic efficiency (+ Pollution !)
67Tel Aviv Mobility Management Workflow
68Tel Aviv/Haifa TMS Architecture (existing & under construct.)
69PT Priority – Means : Goal 1
PT Priority Signal Plans
Explicit
Policy Detailed
Design Field
Parameters Operations
Tuning
Detectors
Data +SIRI
SM
Expected
PI’s
RT Traffic
Management
Decision Network PI’s
Alerts
Making Monitoring
Analysis
SP
Selection
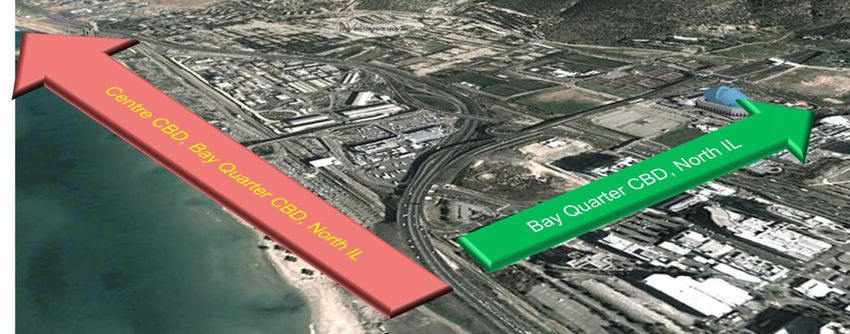
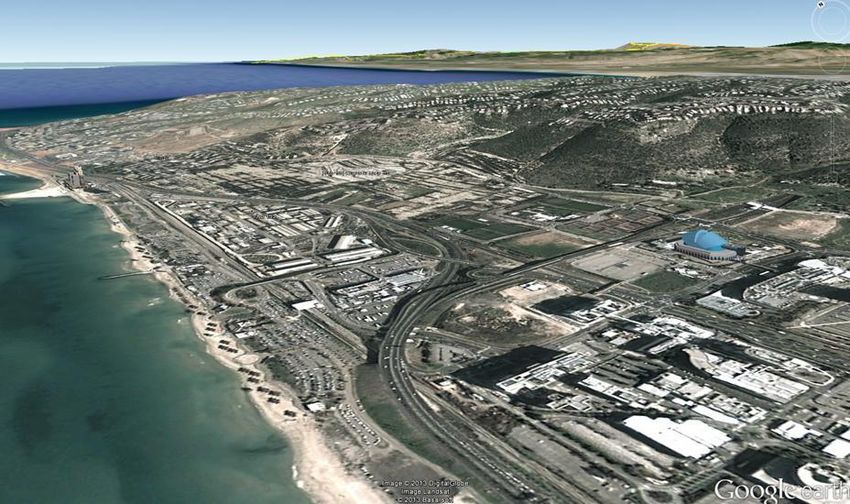
70Haifa City Tunnel
71Haifa City Tunnel
72Haifa City Tunnel
73Haifa City Tunnel
74CONTENTS
1. The CONDUITS set of indicators
2. The case studies of the European project CONDUITS
3. The CONDUITS DST (Decision Support Tool)
4. The Brussels case study : VISSIM
5. The Stuttgart case study : 2MOVE2 (CIVITAS)
6. CONDUITS DST implementation in Tel Aviv
7. Future developments
75Future developments : some thoughts !
Integrated DST module including Traffic – Road safety –
Pollution reduction in a first step
Scientific approach for the choice of the KPIs weightings
"Validation" of these weightings by political representatives
Impacts of different vehicle fleet compositions on the
pollution KPI
Feasibility study of a predictive social inclusion KPI module
for future inclusion in CONDUITS DST
Discussion with PTV for a better integration of the
CONDUITS DST in their products
76Another reason to use the CONDUITS KPIs and DST !
EC Urban Mobility Package adopted 13/12/2013
EC Communication ‘Together towards competitive and resource-efficient
urban mobility’
‘…the Commission will continue to support the development of an Urban
Mobility Scoreboard, by identifying harmonised indicators to benchmark and
compare the progress of urban areas across the EU. The Commission will
build on work conducted in projects like EcoMobility Shift and Conduits.’
EC staff working document Mobilising Intelligent Transport Systems for
EU cities
‘……the monitoring of the deployment of ITS applications, and evaluation of
their impacts (based on existing methodologies, outcomes of past projects
e.g. CONDUITS …..), can greatly help decision makers in selecting the
right ITS applications (or combination of ITS applications), in order to
achieve their policy goals.’
77The CONDUITS Decision Support Tool
is free of charge and a user manual is
available, as well as a technical support.
Contact: Suzanne Hoadley, POLIS,
shoadley@polisnetwork.euYou can also read