GLOBAL STATUS REPORT ON ROAD SAFETY 2018 - SUMMARY - World Health ...
←
→
Page content transcription
If your browser does not render page correctly, please read the page content below
SUMMARY

  GLOBAL
  STATUS
  REPORT
  ON ROAD
  SAFETY
  2018

Global status report on road safety 2018: Summary

WHO/NMH/NVI/18.20

© World Health Organization 2018

Some rights reserved. This work is available under the Creative Commons Attribution-NonCommercial-ShareAlike
3.0 IGO licence (CC BY-NC-SA 3.0 IGO; https://creativecommons.org/licenses/by-nc-sa/3.0/igo).

Under the terms of this licence, you may copy, redistribute and adapt the work for non-commercial purposes,
provided the work is appropriately cited, as indicated below. In any use of this work, there should be no suggestion
that WHO endorses any specific organization, products or services. The use of the WHO logo is not permitted.
If you adapt the work, then you must license your work under the same or equivalent Creative Commons licence.
If you create a translation of this work, you should add the following disclaimer along with the suggested citation:
“This translation was not created by the World Health Organization (WHO). WHO is not responsible for the content
or accuracy of this translation. The original English edition shall be the binding and authentic edition”.

Any mediation relating to disputes arising under the licence shall be conducted in accordance with the mediation
rules of the World Intellectual Property Organization.

Suggested citation. Global status report on road safety 2018: summary. Geneva: World Health Organization;
2018 (WHO/NMH/NVI/18.20). Licence: CC BY-NC-SA 3.0 IGO).

Cataloguing-in-Publication (CIP) data. CIP data are available at http://apps.who.int/iris.

Sales, rights and licensing. To purchase WHO publications, see http://apps.who.int/bookorders. To submit
requests for commercial use and queries on rights and licensing, see http://www.who.int/about/licensing.

Third-party materials. If you wish to reuse material from this work that is attributed to a third party, such as
Tables, Figures or images, it is your responsibility to determine whether permission is needed for that reuse and
to obtain permission from the copyright holder. The risk of claims resulting from infringement of any third-party-
owned component in the work rests solely with the user.

General disclaimers. The designations employed and the presentation of the material in this publication do not
imply the expression of any opinion whatsoever on the part of WHO concerning the legal status of any country,
territory, city or area or of its authorities, or concerning the delimitation of its frontiers or boundaries. Dotted and
dashed lines on maps represent approximate border lines for which there may not yet be full agreement.

The mention of specific companies or of certain manufacturers’ products does not imply that they are endorsed
or recommended by WHO in preference to others of a similar nature that are not mentioned. Errors and omissions
expected, the names of proprietary products are distinguished by initial capital letters.

All reasonable precautions have been taken by WHO to verify the information contained in this publication.
However, the published material is being distributed without warranty of any kind, either expressed or implied.
The responsibility for the interpretation and use of the material lies with the reader. In no event shall WHO be
liable for damages arising from its use.

Printed in Switzerland
SUMMARY

GLOBAL
STATUS
REPORT
ON ROAD
SAFETY
2018
The global burden of
                          road traffic deaths
The number                The number of road traffic deaths continues to rise steadily, reaching
                          1.35 million in 2016. However, the rate of death relative to the size of
of deaths on
                          the world’s population has remained constant. When considered in
the world’s               the context of the increasing global population and rapid motorization
roads remains             that has taken place over the same period, this suggests that
unacceptably high,        existing road safety efforts may have mitigated the situation from
                          getting worse. However, it also indicates that progress to realise
with an estimated
                          Sustainable Development Goal (SDG) target 3.6 – which calls for a
1.35 million people       50% reduction in the number of road traffic deaths by 2020 – remains
dying each year.          far from sufficient.

                          Figure 1: Number and rate of road traffic death per
                          100,000 population: 2000–2016

                                                                                                                                                                                      Rate of death/100,000 population
                      Number of deaths (millions)

                                                                                                                                                                          1.35
                                                    1.4   18.8
                                                                                                                                                                                 20
                                                    1.2                                                                                                                   18.2
                                                          1.15
                                                    1.0                                                                                                                          15
                                                    0.8
                                                    0.6                                                                                                                          10

                                                    0.4
                                                                                                                                                                                 5
                                                    0.2
                                                     0                                                                                                                           0
                                                                                                                                       2011

                                                                                                                                              2012

                                                                                                                                                     2013

                                                                                                                                                            2014

                                                                                                                                                                   2015

                                                                                                                                                                          2016
                                                                 2001

                                                                        2002

                                                                               2003

                                                                                      2004

                                                                                             2005

                                                                                                    2006

                                                                                                           2007

                                                                                                                  2008

                                                                                                                         2009

                                                                                                                                2010
                                                          2000

                                                                                                                  Year
                                                                                         Number of deaths                       Rate of death

                                                                               2
GLOBAL STATUS REPORT ON ROAD SAFETY 2018 Summary
A leading killer of children
As progress is made in the prevention and control of infectious
diseases, the relative contribution of deaths from noncommunicable
diseases and injuries has increased. Road traffic injuries are the
Road traffic injuries
eighth leading cause of death for all age groups. More people now
die as a result of road traffic injuries than from HIV/AIDS, tuberculosis are now the leading
or diarrhoeal diseases. Road traffic injuries are currently the leading cause of death
cause of death for children and young adults aged 5–29 years, for children and
signalling a need for a shift in the current child and adolescent health
young adults aged
agenda which, to date, has largely neglected road safety.
5–29 years.
Progress is far from uniform
A number of countries have seen success in reducing road traffic
deaths over the last few years, but progress varies significantly
between the different regions and countries of the world. There
continues to be a strong association between the risk of a road
traffic death and the income level of countries. With an average
rate of 27.5 deaths per 100,000 population, the risk of a road traffic
death is more than three times higher in low-income countries than
in high-income countries where the average rate is 8.3 deaths per
100,000 population. Furthermore, as shown in Figure 2, the burden
of road traffic deaths is disproportionately high among low- and
middle-income countries in relation to the size of their populations
and the number of motor vehicles in circulation.
3Figure 2: Proportion of population, road traffic deaths,
and registered motor vehicles by country income
category*, 2016
POPULATION ROAD TRAFFIC DEATHS VEHICLES
9% 7% 1%
15% 13%
40%
59%
76% 80%
high-income middle-income low-income
*income levels are based on 2017 World Bank classifications.
There has been no There has also been more progress in reducing the number of road
traffic deaths among middle- and high-income countries than low-
reduction in the
income countries. As shown in Figure 3, between 2013 and 2016,
number of road no reductions in the number of road traffic deaths were observed
traffic deaths in in any low-income country, while some reductions were observed
any low-income in 48 middle- and high-income countries. Overall, the number of
country since 2013. deaths increased in 104 countries during this period.
Figure 3: Number of countries where a change in the
number of road traffic deaths has been observed
since 2013*
LOW-INCOME 27 1 0
MIDDLE-INCOME 60 15 23
HIGH-INCOME 17 7 25
Increased No Change Decreased
*These data represent countries that have seen more than a 2% change in their number of deaths since
2013, and excludes countries with populations under 200 000. The income levels are based on 2017
World Bank classifications.
4GLOBAL STATUS REPORT ON ROAD SAFETY 2018 Summary
Inequalities persist
across regions
Whereas the global rate of road traffic death is 18.2 per 100,000 The rates of road
population, there is significant variation across the world’s regions,
traffic death are
where the rate of death ranges from 9.3 to 26.6 per 100,000 population.
Regional rates of road traffic deaths in Africa and South-East Asia are
highest in Africa
highest at 26.6 and 20.7 deaths per 100,000 population respectively. (26.6/100,000
This is followed by the Eastern Mediterranean and Western Pacific people) and
regions, which have rates comparable to the global rate with 18 and
South-East Asia
16.9 deaths per 100,000 population respectively. The Americas and
(20.7/100,000 people).
Europe have the lowest regional rates of 15.6 and 9.3 deaths per
100,000 population respectively. In terms of progress made, in three
of the six regions (Americas, Europe, Western Pacific), the rates of
death have decreased since 2013.
Figure 4: Rates of road traffic death per 100,000
population by WHO regions: 2013, 2016
30
26.1 / 26.6
25
Rate of death/100,000 population
19.8 / 20.7
20
17.9 / 18 18 / 16.9 18.3 / 18.2
15.9 / 15.6
15
10.4 / 9.3
10
5
0
Africa Americas Eastern Europe South-East Western World
Mediterranean Asia Pacific
WHO Region
2013 2016
5Vulnerable road users
disproportionately impacted
More than half The variation in rates of death observed across regions and
countries also corresponds with differences in the types of road
of all road traffic
users most affected. Vulnerable road users – pedestrians, cyclists
deaths are and motorcyclists – represent more than half of all global deaths.
among vulnerable Pedestrians and cyclists represent 26% of all deaths, while those
road users: using motorized two- and three-wheelers comprise another 28%.
Car occupants make up 29% of all deaths and the remaining 17%
pedestrians,
are unidentified road users1. Africa has the highest proportion of
cyclists
pedestrian and cyclist mortalities with 44% of deaths. In South-East
and motorcyclists. Asia and the Western Pacific, the majority of deaths are among riders
of motorized two and three-wheelers, who represent 43% and 36%
of all deaths respectively.
Figure 5: Distribution of deaths by road user type,
by WHO Region
Europe
9%
Americas
Eastern Mediterranean
27% 48%
18%
34% 5% 10%
11%
22%
39% South-East Asia
23% 34%
3%
Africa 16%
WORLD 15% 25%
2%
7%
14%
40% 43%
17% 2%
29% 40%
23%
4% 9%
3% 28%
14%
22%
22%
Driver / passengers
of 4 wheeled vehicles
6% 36%
Motorized
2-3 wheelers
Cyclists
Pedestrians
1 The distribution of deaths among road user categories is based on data reported by countries. In
some countries, this data is not available or is incomplete, which contributes to the large percentage
of those identified as ‘others’ or ‘unspecified’.
6GLOBAL STATUS REPORT ON ROAD SAFETY 2018 Summary
Legislation and road
user behaviour
Enacting and enforcing legislation on key behavioural risk factors 22 countries
including speed, drink-driving and failing to use motorcycle helmets,
representing
seat-belts and child restraints are critical components of an integrated
strategy to prevent road traffic deaths. Currently, 123 countries,
1 billion people
representing nearly six billion people, have laws that meet best amended their laws
practice for at least one of the five key behavioural risk factors. on one or more
risk factors to bring
Since 2014, 22 additional countries have amended their laws on
one or more key risk factors to bring them in line with best practice, them into alignment
covering a potential additional one billion people or 14% of the with best practice.
world’s population.
Figure 6: Countries with laws meeting best practice on 5
risk factors, 2014, 2017
120
102 / 3
100
Number of countries
80
60
46 / 0 44 / 5
35 / 10
29 / 4
40
20
0
Speed Drink-driving Seat-belt Helmet Child restraints
Countries 2014 Additional countries in 2017
7Figure 7: Populations covered by laws meeting best
practice, 2014, 2017
Number of people covered (Billions)
6
5.14 / 0.11
5
4
2.7 / 0.24
3 2.27 / 0.4
2.15 / 0.18
2
1 0.55 / 0.1
0
Speed Drink-driving Seat-belt Helmet Child restraints
Number of people 2014 Additional number of people in 2017
Managing speed
46 countries The speed at which a vehicle travels directly influences the risk of a
crash as well as the severity of injuries, and the likelihood of death
representing
resulting from that crash. Effective speed management is, as such,
3 billion people central to most road safety intervention strategies. Setting national
currently have speed limits is an important step in reducing speed. Maximum urban
laws setting speed speed limits should be lower than or equal to 50 km/h, in line with
limits that align best practice. In addition, local authorities should have the legislative
power to reduce speed limits further, allowing them to take into
with best practice.
account local circumstances such as the presence of schools or high
concentrations of vulnerable road users. The results show that only
46 countries have laws that meet best practice criteria for speed.
8GLOBAL STATUS REPORT ON ROAD SAFETY 2018 Summary
Figure 8: Countries with speed laws meeting best
practice, 2017
Speed limits on urban roads ≤ 50 km/h and can be modified Data not available
Speed limits on urban roads ≤ 50 km/h but cannot be modified Not applicable
No speed law or speed limit on urban roads > 50 km/h
9Reducing drink–driving
45 countries It is estimated that 5–35% of all road deaths are reported as alcohol-
related. Driving after drinking alcohol significantly increases the
representing
risk of a crash and the severity of that crash. While blood alcohol
2.3 billion people concentration (BAC) limits provided for in legislation need to be at
currently have the core of efforts to address drinking and driving, an integrated
drink–driving laws approach to intervention involves combined publicity and high-
visibility police enforcement. Best practice for drink–driving laws
that align with
includes a BAC limit of 0.05 g/dl for the general population and a
best practice. BAC limit of 0.02 g/dl for young or novice drivers.
Progress has been made since 2014 with an additional ten countries
now meeting overall best practice for drink–driving laws, representing
coverage of an additional 180 million people.
Figure 9: Countries with drink-driving laws meeting best
practice, 2017
Data not available
BAC ≤ 0.05 g/dl and BAC for young/novice drivers ≤ 0.02 g/dl
BAC between 0.05 g/dl and 0.08 g/dl or BAC for young/novice drivers > 0.02 g/dl Not applicable
No drink–driving law/Law not based on BAC/ BAC > 0.08 g/dl
Alcohol consumption legally prohibited
10GLOBAL STATUS REPORT ON ROAD SAFETY 2018 Summary
Increasing motorcycle helmet use
Head injuries are the leading cause of death and major trauma 49 countries
for two- and three-wheeled motor vehicle users. Correct helmet
representing
use can lead to a 42% reduction in the risk of fatal injuries and
a 69% reduction in the risk of head injuries. The use of helmets 2.7 billion people
is, as such, an increasingly important means of preventing road currently have laws
traffic deaths. Best practice for motorcycle helmet laws includes a on motorcycle
requirement for drivers and passengers to wear a helmet on all roads,
helmet use
a specification that helmets should be fastened, and a reference to
a helmet standard.
that align with
best practice.
Since 2014, five countries have made amendments to existing
legislation to align them with best practice, providing coverage to an
additional 397 million people. Only 63 countries, representing 33%
of the world’s population, restrict child passengers on motorcycles.
Figure 10: Countries with helmet laws meeting best
practice, 2017
All riders, roads, engines, fastening and standard Data not available
All riders, roads, engines and either fastening or standard Not applicable
Not covering all riders or roads or engines / no law
11Increasing seat-belt use
105 countries Wearing a seat-belt reduces the risk of death among drivers and front
seat occupants by 45–50%, and the risk of death and serious injuries
representing
among rear seat occupants by 25%. A requirement that both front
5.3 billion people and rear occupants use seat-belts is a key criterion for best practice.
currently have
laws on seat-belt Since 2014, seven countries have made changes to their seat-belt
legislation: five additional countries now have laws that meet best
use that align with
practice while two countries have made changes that bring their
best practice. laws out of alignment with best practice. The net increase of three
countries accounts for an additional 113 million people covered by
best practice seat-belt laws.
Figure 11: Countries with seat-belt laws meeting best
practice, 2017
Seat-belt law applies to all occupants Not applicable
Seat-belt law applies to front seats occupants Data not available
No seat-belt law or law applies to driver only
12GLOBAL STATUS REPORT ON ROAD SAFETY 2018 Summary
Increasing child restraint use
Child restraints are highly effective in reducing injury and death to 33 countries
child occupants. The use of child restraints can lead to at least a
representing
60% reduction in deaths. Best practice criteria for child restraint
laws include a requirement to place children at least until ten years
652 million people
of age or 135 cm in height in a child restraint; a restriction to seating currently have
children in the front seat; and a reference to a safety standard for laws on the use
child restraints. of child restraint
This review showed that 84 countries have a national child restraint systems that align
law. Among these, 33 countries, representing 9% of the world’s with best practice.
population, meet the overall best practice criteria for child restraints.
Since 2014, four countries have made amendments to legislation
on the use of child restraints to bring them in line with best practice.
Figure 12: Countries with child restraint laws meeting best
practice, 2017
Children up to 10 years/135 cm covered, standard, front seating restrictions Data not available
Children under 4 covered, those between 4 and 10 insufficiently covered or children up to 10 years/135 cm covered, no standard Not applicable
Children under 4 insufficiently covered or no law or law based on age/height or front seating restrictions only
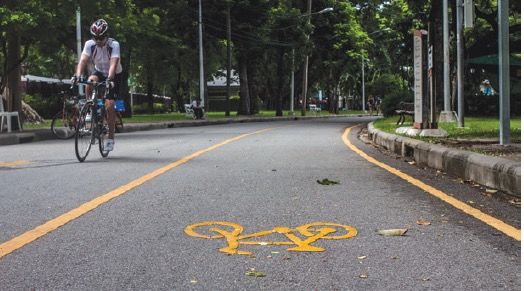
13Safe roads
Road infrastructure is strongly linked to fatal and serious injury
causation in road traffic collisions, and research has shown that
improvements to road infrastructure, particularly design standards
that take into account the safety of all road users, are critical to
making roads safe. This review shows that 112 countries have
national design standards for the management of speed.
Ninety-two countries have national design standards for separating
pedestrians and cyclists from motorized traffic. One hundred and
thirty-two countries have national design standards for the provision
of safe crossings for pedestrians and cyclists.
This review found that 147 countries reported carrying out road safety
audits or star ratings for new roads while 114 countries reported
doing safety assessments or star rating on existing roads.
Safe vehicles
40 countries Vehicle safety is increasingly critical to the prevention of crashes
and has been shown to contribute to substantial reductions in the
representing
number of deaths and serious injuries resulting from road traffic
1 billion people crashes. Features such as electronic stability control and advance
have implemented braking are examples of vehicle safety standards that can prevent
at least 7 or all a crash from occurring or reduce the severity of injuries. Despite
these potential benefits, not all new and used vehicles are required
of the 8 priority
to implement internationally recognized safety standards.
UN vehicle
safety standards. Progress with uptake of the eight2 priority standards has been very
limited since the last review. To-date, 40 mainly high-income countries
have implemented 7–8 of these standards. Eleven countries apply
two to six of the eight priority standards and 124 apply one or none
of the priority standards. Since the last review, one additional country,
India, is applying the front and side impact protection standard.
2 In the previous report, 7 priority standards were identified. An additional standard for motorcycle anti-
lock braking systems (ABS) has been included in this report.
14GLOBAL STATUS REPORT ON ROAD SAFETY 2018 Summary
Figure 13: Countries applying UN vehicle safety standards,
2018
Meets 7 or 8 international vehicle standards Not applicable
Meets 2 to 6 international vehicle standards Data not available
Meets 0 or 1 international vehicle standard
Post-crash care
Emergency care is at the core of the post-crash response. There are a 109 countries have
series of time sensitive actions that are essential to provide effective
a telephone number
care for the injured, beginning with activation of the emergency care
system and continuing with care at the scene, transport, and hospital-
with national
based emergency care. coverage to activate
the emergency
To activate the emergency care system, ideally there should be
care system.
a single telephone number that is valid throughout the country,
easy to remember and available as a free call. This current report
found that 109 countries have at least one number with full national
coverage. The proportion of injured people who die before reaching
a hospital in low- and middle-income countries is over twice that
in high-income countries. Ideally, there would be at least a simple
prehospital system that could provide timely care at the scene with
equipped ambulances staffed with certified providers, and ensure
arrival to an appropriate hospital where there are specialist trauma
care providers. Despite the enormous potential impact of prehospital
care, the current report shows that only 55% of countries have
15a formal process to train and certify prehospital providers while
about half (54%) of countries have speciality training pathways in
emergency medicine and trauma surgery.
Taking stock and looking ahead
The number of road traffic deaths continues to climb, reaching
1.35 million in 2016, while the rates of death relative to the size of
the world population has stabilised in recent years. The progress
that has been achieved in a number of countries to stabilise the
global risk of dying from a road traffic crash has not occurred at
a pace fast enough to compensate for the rising population and
rapid motorization of transport taking place in many parts of the
world. At this rate, the SDG target to halve road traffic deaths by
2020 will not be met. This review of key risk factors does show,
however, that progress is being made in improving key road safety
laws, making infrastructure safer, adopting vehicle standards and
improving access to post-crash care. Further progress will depend
upon future success in addressing the range of significant challenges
which remain.
16Made possible through funding from Bloomberg Philanthropies.
WORLD HEALTH ORGANIZATION
Management of Noncommunicable Diseases,
Disability, Violence and Injury Prevention (NVI)

20 Avenue Appia
1211 Geneva 27
Switzerland
Phone: +41 22 791 2881

http://www.who.int/violence_injury_prevention/road_traffic/en/
You can also read