MI COVID response Data and modeling update - April 20, 2021 - State of ...
←
→
Page content transcription
If your browser does not render page correctly, please read the page content below
MI COVID response
Data and modeling update
April 20, 2021

NOTE: all data as of Apr 17 unless otherwise noted

Executive summary
Percent Positivity (16.4%, ↓2.1) is down 11% from last week but remains 371% higher than the mid-February low.

Case Rate (642.4, ↑90.2) is up 12% since last week, and has increased 504% in the past eight weeks

  Michigan has the highest number of cases (↔), and highest case rate (↔) in the last 7 days (source: CDC COVID
  Data Tracker)

Percent of inpatient beds occupied by individuals with COVID (19.3%, ↑2.8%) has increased 17% since last week
and is up 395% over six weeks

  Michigan has the highest inpatient bed utilization (↔), and the highest adult ICU bed utilization (↔) (source: US
  HHS Protect)

Deaths have increased 25% since last week. There were 306 (↑69) deaths between Apr 4 and Apr 10, and the Death
Rate is 4.4 deaths per million residents (↑1.0)

  Michigan has the 8th highest number of deaths (↔), and T11th highest death rate (↓3) in the last 7 days (source:
  CDC COVID Data Tracker)

The 7-day average state testing rate has increased to 4,461.0 tests/million/day (↑545.8). Daily diagnostic tests (PCR)
is 44.4K per day (↑5.5K), and the weekly average for PCR and antigen tests conducted in Michigan is 64.8K (↑8.1K).

6.07 million COVID-19 vaccine doses reported to MDHHS, 45.6% of Michigan population 16+ has at least one dose
Comparison across states: Summary
What we see today (data through 4/17):
• 13 states are seeing increasing 1 week case trends (>=10%) (down vs. 16 last week)
• 10 states are seeing 1 week increases (>=10%) in new COVID hospital admissions (down vs.
  23 last week)
• Michigan, DC, Maryland, New Jersey and New York have highest per capita hospitalized
  patient numbers.
• Midwest (case data from CDC as of 4/19):
   –   Wisconsin with slight increase in hospitalizations (62/M) and stable cases (104/100k last 7d)
   –   Indiana with stable hospitalizations (120/M), and stable cases (116/100k last 7d)
   –   Illinois showing increase in hospitalizations (171/M), and stable cases (177/100k last 7d)
   –   Ohio with increase in hospitalizations (152/M) and decrease in cases (117/100k last 7d)
   –   Michigan showing increase in hospitalizations (423/M) and slight decrease in cases (485/100k last 7d)

                                                                                                               3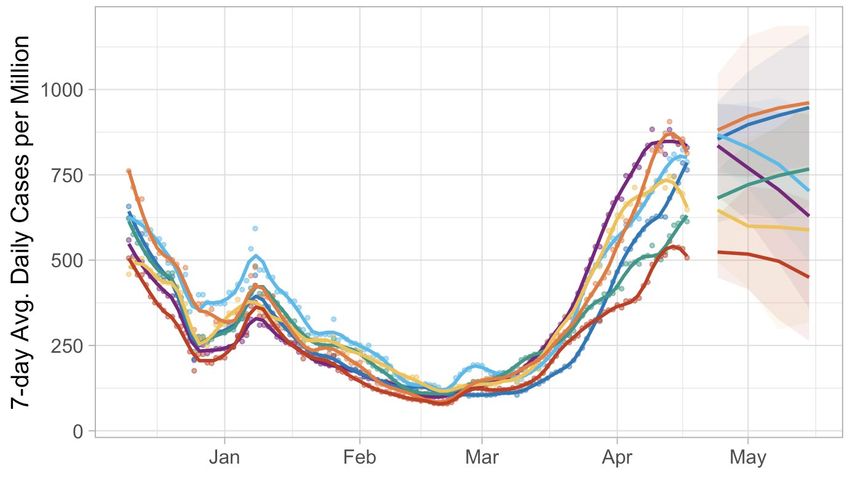
COVID-19 Spread
Statewide positivity has decreased to 16.4%
•   One week decrease of 11% (compared to 17% increase last week)
•   Decreasing for seven days (371% increase since mid-February)
•   Seven MERC regions are above 15% (Risk Level D)
•   One MERC region, Saginaw, is above 20% (Risk Level E)
•   Highest state, regional, and county levels recorded since mid-April 2020

Case rates (642.4 cases/million) are increasing in the state
• One week increase of 12% (compared to 14% last week)
• Increasing for eight weeks (504% cumulative increase since mid-February)
• Increases are seen among all age groups, races, and ethnicities
• Variants in Michigan: 3,455 confirmed B.1.1.7; 15 confirmed B.1.351; 78 confirmed B.1.427/B.1.429 ; 26 confirmed P.1

Number of active outbreaks is up 10% from previous week
• Reported school outbreaks is steady since last week (312)
• Since January, the most cases and clusters related to K-12 sports have been in basketball, hockey, and wrestling
Confirmed and probable case indicators                                             Risk levels
Table Date: 4/17/2021 (7 days from date table was produced: 4/10/2021)   Low   A    B      C     D   E

 Cases                                             Positivity
Statewide Positivity Trends
Daily positivity and 7-day rolling average positivity for Michigan
    0.7
                               7-day average         Daily values

    0.6

    0.5

    0.4

    0.3

    0.2

    0.1

      0
          3/1            4/1             5/1             6/1        7/1   8/1   9/1   10/1   11/1   12/1   1/1   2/1   3/1   4/1

•      Early in the pandemic, testing was not as robust as it has been since July 2020 to present
•      Positivity is an early indicator of SARS-CoV-2 Transmission (as positivity increases, we expect case rates to follow)
•      Current statewide positivity is the highest it has been since April 22, 2020*
•      Positivity is down 11% from last week but remains 371% higher than the mid-February low
•      These are for PCR tests only and exclude tests conducted with Michigan Department of Corrections
    *Note: Testing was not as robust early in the pandemic
    Source: MDHHS – Michigan Disease Surveillance System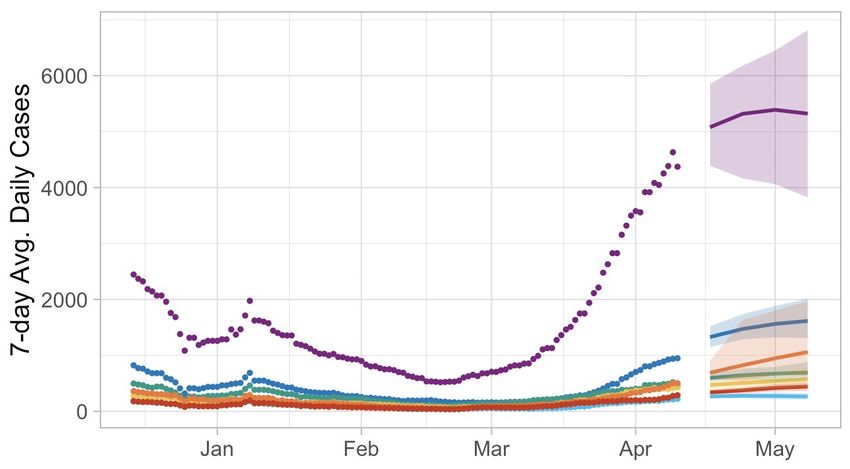
Positivity by county, 4/9-4/15
                                                 Average            # of counties               This week
                                                 positivity per day                             Last week

                                                       =20%                            25
                                                                                        25

                                                 Updates since last week:
                                                 71 of 83 counties saw double digit positivity
                                                 in the last week (1 county increase)
                                                 77 of 83 counties saw positivity > 7% in the
                                                 last week (3 county increase)

 Source: SEOC Testing Results – Excluding MDOC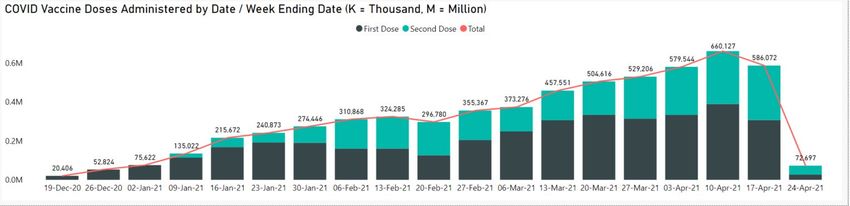
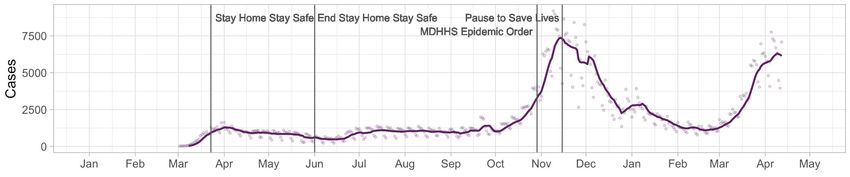
COVID-19 cases by onset date: State of Michigan

            Cumulative confirmed and probable cases, by date of                                                           New confirmed and probable cases, by date of
            onset of symptoms                                                                                             onset of symptoms
              900000                                                                                                        10000

              750000
                                                                                                                              7500
              600000

              450000                                                                                                          5000

              300000
                                                                                                                              2500
              150000

                       0                                                                                                           0
                           3/1        5/1          7/1          9/1         11/1          1/1         3/1                              3/1         5/1          7/1           9/1         11/1          1/1          3/1

Updates since last week:
•     Cases have increased for eight weeks
•     Cumulative cases are approaching 900,000
•     There are over 6,400 new cases per day, an increase of 900 since last week
Note: Case information sourced from MDHHS and reflects date of onset of symptoms (refers to lab-confirmed cases). Case spike on 5/12 is a result of batch of test results, not all of which have onset date of symptoms completed
Source: MDHHS – Michigan Disease Surveillance System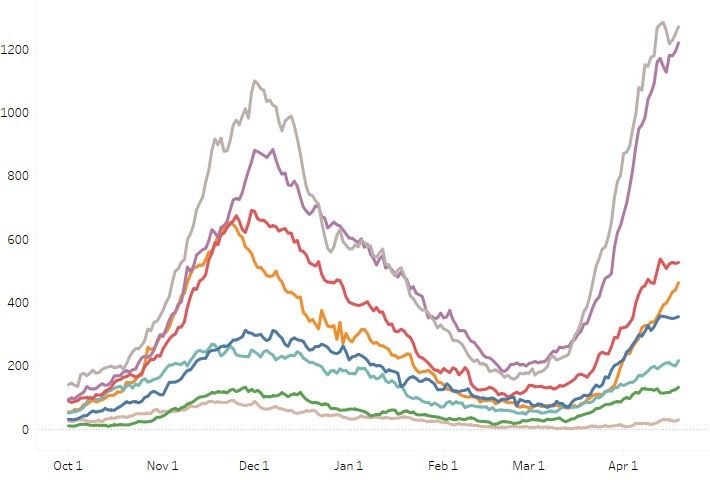
Cumulative COVID-19 Case Rates: Midwest Comparison
                                                                          Cumulative Case Rates (per 100,000)
                                12000

                                10000

                                                                                                                                                                 Michigan
                                 8000

                                 6000

                                 4000

                                 2000

                                      0
                                          3/15     4/15   5/15         6/15      7/15   8/15    9/15   10/15   11/15    12/15   1/15        2/15   3/15   4/15
                                                            Illinois          Indiana    Michigan      Minnesota       Ohio     Wisconsin

•    Cumulative incidence per 100,000 cases in Michigan has been lower than other states in the Midwest following spring 2020 surge
•    Michigan’s mitigation policies helped control the spread of SARS-CoV-2 relative to other states in the Midwest, particular during surge in
     November and December
•    The current trajectory in Michigan is bringing us closer to case rates of our Midwest neighbors

Source: CDC COVID Data Tracker – State Trend Comparison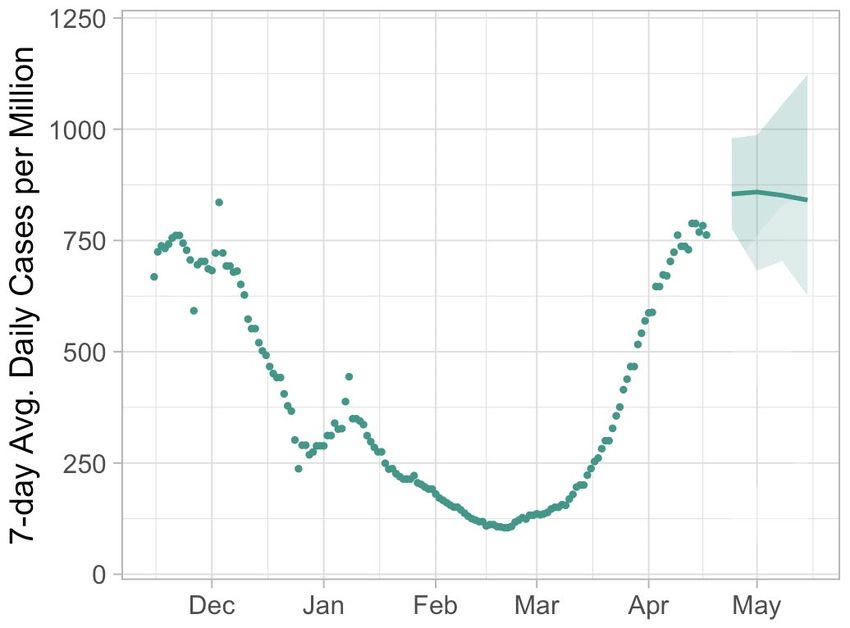
Age group: average new daily cases
Daily new confirmed and probable cases per million by age group (7-day rolling average)

                                   0-9                 30-39               60-69
                                   10-19               40-49               70-79
    1000
                                   20-29               50-59               80+

     800

     600

     400

     200

         0
             3/1            4/1            5/1              6/1            7/1         8/1   9/1   10/1   11/1   12/1   1/1   2/1   3/1   4/1

•      All age groups by decade are increasing
•      Those aged 10-19 have the highest case rates, followed by 20-29, 30-39, 40-49, and 50-59
•      There are over 6,400 new cases per day (↑900)
    Note: Case information sourced from MDHHS and reflects date of onset of symptoms
    Source: MDHHS – Michigan Disease Surveillance System
Age group: average new daily cases and daily case rate
Daily new confirmed and probable cases per million by age group (7-day rolling average)
Age Average Average One Week % Change since
Group daily cases Daily Case % Change (Δ #) 2/19* (Δ #)
Rate
0-9 401.4 348.2 32% (97) 694% (351)
10-19 1150.9 917.1 30% (264) 567% (978)
20-29 1203.0 872.0 4% (45) 505% (1,004)
30-39 1038.3 855.9 8% (75) 530% (874)
40-49 932.3 790.5 5% (45) 517% (781)
50-59 877.6 649.9 7% (60) 490% (729)
60-69 511.1 400.7 12% (53) 382% (405)
70-79 188.6 245.9 11% (19) 276% (138)
80+ 84.1 203.1 13% (10) 177% (54)
* Lowest 7-day avg. following winter surge
Total¶ 6,414.4 642.4 12% (666) 495% (5,314) ¶ Total may not reflect state due to missing age data
• Avg. daily number of cases (1,203.0) is currently highest for 20-29; Avg. daily case rate (917.1) is highest for 10-19
• All age groups under 70 are experiencing an average of more than 400 cases per day
• Since February 19, case rates and number of cases have been highest among those under 70 years of age
Note: Case information sourced from MDHHS and reflects date of onset of symptoms
Source: MDHHS – Michigan Disease Surveillance SystemAverage daily new cases per million people by race and ethnicity
Daily new confirmed and probable cases per million Daily new confirmed and probable cases per
(7 day rolling average) by race category million (7 day rolling average) by ethnicity category
American Indian/Alaska Native Black/African American 500 Hispanic or Latino Not Hispanic or Latino
500
Asian/Pacific Islander White
375 375
250 250
125 125
0 0
1/18 2/1 2/15 3/1 3/15 3/29 4/12 1/18 2/1 2/15 3/1 3/15 3/29 4/12
Updates since last week:
• Cases per million are increasing for all races and ethnicities
• Most recent data show that Blacks and Hispanic/Latinos have the highest case rates
• In the past 30 days, 36% of all cases represent unknown, multiple, or other races (30% of race is unknown, ↓1%)
• In the past 30 days, 34% of all cases have an unknown ethnicity reported (↓2%)
Note: Case information sourced from MDHHS and reflects date of death of confirmed and probable cases.
Source: MDHHS – Michigan Disease Surveillance SystemIdentified COVID-19 Cases Caused by All Variants of Concern
in US and Michigan
SARS-CoV-2 Variants Circulating in the Emergent Variants of Cases in Michigan, Apr 19
United States, Mar 14 – Mar 27 .
149 cases in Wayne attributed to Detroit
Variant MI Reported Cases¶ # of Counties CDC est. prevalence
B.1.1.7 3,455* 67 57.6%
B.1.351 15 10 0.1%
B.1.427/B.1.429 78 16 5.8%
P.1 26 8 0.2%
Data last updated April 20, 2021 * 517 cases within MDOC; ¶ Several cases with county not yet determined
Source: https://covid.cdc.gov/covid-data-tracker/#variant-proportions and Michigan Disease Surveillance System (MDSS)Number of outbreak investigations by site type, week ending Apr 15
Easier to identify outbreak
Pr e - d ecision al, f o r d iscussion o nly Dr af t Harder to identify outbreak
Site type Outbreaks by ongoing/new classification, # Visibility1 Total number of active
Ongoing New Total outbreaks is up 10% from
previous week
K- 12 SCHO O L 269 43 312
MA NUF A CT UR IN G , CONS T R U CT IO N 177 47 224
135 40 175 Following manufacturing/
SNF/L T C/ O T HE R A SSIS T E D LIV ING
*RETA IL 87 42 129 construction (47), the greatest
CHIL DCA R E/Y O U T H PRO G RA M 83 21 104 number of new outbreaks were
*RES TA U RA N T S A ND BA RS 52 26 78 reported inK-12 (43), retail
OFF ICE SET T IN G 51 18 69 (42), SNF/LTC (40),
HEA L T HCA R E 28 7 35 restaurants & bars (26),
*SOCIA L GA THER IN G 16 11 27 childcare/youth programs (21),
COLL EG E/ U N IV E R S IT Y 24 0 24 office settings (18), and social
OTHER 14 8 22 gatherings (11).
*REL I G I O U S SERV I CE S 17 2 19
A GRICU L T U RA L / F O O D PRO CE S S I NG 10 4 14 LHDs reported new outbreaks
CORRE C T I O N S 11 1 12 in all settings except
*PER S O NA L SERV IC E S 9 1 10 college/universities, indoor and
*SHEL T E RS 4 1 5 outdoor community exposures.
*CO MMU N IT Y EXPO S UR E - OUT DO O R 1 0 1
*CO MMU N IT Y EXPO S UR E - INDO O R 1 0 1
TO TA L 989 272 1261
1. Based on a setting’s level of control and the extent of time patrons/residents spend in the particular setting, different settings have differing levels of ability to ascertain whether a case derived from that setting
NOTE: Many factors, including the lack of ability to conduct effective contact tracing in certain settings, may result in significant underreporting of outbreaks. This chart does not provide a complete picture of
outbreaks in Michigan and the absence of identified outbreaks in a particular setting in no way provides evidence that, in fact, that setting is not having outbreaks.
Source: LHD Weekly SitrepsLong-Term Care Facilities: Number of Outbreak Investigations by Week
Weekly new outbreaks in LTC/SNF through April 15
New outbreaks reported in LTC/SNF
120
100
80
60
40
20
0
9-Jul 9-Aug 9-Sep 9-Oct 9-Nov 9-Dec 9-Jan 9-Feb 9-Mar 9-Apr
• The number of outbreaks in long term care facilities had been reflecting case trends in the community
• Outbreaks peaked in mid-November
• Increases are again seen recently in LTC/SNF
Many factors, including the lack of ability to conduct effective contact tracing in certain settings, may result in significant underreporting of outbreaks. This chart does not provide a complete picture of outbreaks in Michigan and the
absence of identified outbreaks in a particular setting in no way provides evidence that, in fact, that setting is not having outbreaks.
Source: LHD Weekly SitrepsTotal Confirmed COVID-19 Cases in Nursing Homes: Residents & Staff
Weekly totals in Nursing Homes through April 16
1180
1200
900
916
600
411 345
300
356
80
62
0 54
5/31/2020 6/30/2020 7/31/2020 8/31/2020 9/30/2020 10/31/2020 11/30/2020 12/31/2020 1/31/2021 2/28/2021 3/31/2021
Weekly Total Confirmed Cases Resident Weekly Total Confirm Cases Staff
• Cases in nursing homes peaked in mid-November
• Increases are again seen recently, reflecting trends seen in the community
• Increases in nursing homes are primarily driven by staff
Source: MDHHS and EM ResourceK-12 school outbreaks, recent and ongoing, week ending Apr 15
Number of reported outbreaks is steady since last week (312) with increases in Middle/Jr High (68 to 70), and Pre-K – Elementary (74 to 86).
High Schools decreased (165 to 151) and Administrative remained the same at 5.
Number of Range of cases
Region Number of reported cases, # # Ongoing - Excluding New # New outbreaks per outbreak
Region 1 492 59 79 2-36
Region 2n 238 34 87 2-16
Region 2s 79 17 19 2-12
Region 3 619 142 49 2-56
Region 5 109 13 16 2-41
Region 6 261 20 29 2-45
Region 7 192 30 29 2-26
Region 8 19 8 4 2-17
Total 2,009 323 312 2-56
Number of Range of cases
Grade level Number of reported cases, # # Ongoing - Excluding New # New outbreaks per outbreak
Pre-school - elem. 244 80 86 2-48
Jr. high/middle school 355 60 70 2-56
High school 1,321 176 151 2-54
Administrative 8 2 5 2-2
Total 1,928 318 312 2-56
Many factors, including the lack of ability to conduct effective contact tracing in certain settings, may result in significant underreporting of outbreaks. This chart does not provide a complete picture
of outbreaks in Michigan and the absence of identified outbreaks in a particular setting in no way provides evidence that, in fact, that setting is not having outbreaks.
Source: LHD Weekly SitrepsCOVID-19 K-12 Sports Related Clusters and Cases
Cumulative Since Jan 2021 through Apr 2021
424 cases 285 cases 242 cases 70 cases 36 cases 36 cases 25 cases
118 clusters 57 clusters 64 clusters 25 clusters 10 clusters 4 clusters 14 clusters
14 cases 13 cases 9 cases 10 cases 6 cases 19 cases
3 clusters 5 clusters 4 clusters 7 clusters 4 clusters 13 clusters
• Cases identified by local public health which include school-affiliated and club/travel/regional sports (spectators,
collegiate, and professional sports as well as secondary cases to collegiate/professional sports are excluded)
• Since January 2021, basketball, hockey, and wrestling have had the highest number of cases and clusters
• Cases and clusters have occurred in 22 different sport settings
Source: MDHHS – Michigan Disease Surveillance SystemCOVID-19 and Healthcare Capacity and COVID Severity Hospitalization metrics vary by indicator COVID-like illness (CLI) has decreased to 10.4% Hospital admissions are decreasing but trends vary by age groups Hospitalizations up ~6% since last week Confirmed census is 4,211 patients which is the highest measure since April 9, 2020 The fastest regional growth was in Regions 5 and 6 (SW/Grand Rapids), as well as Region 8 (UP) Volume of COVID-19 patients in intensive care (ICU) has increased 14% since last week Deaths trends have increased to 4.4 deaths per million Deaths are a lagging indicator of cases and hospitalization Deaths are up 25% since last week Deaths are up 219% since the March 9 low Proportion of deaths among those 60+ is slowly declining
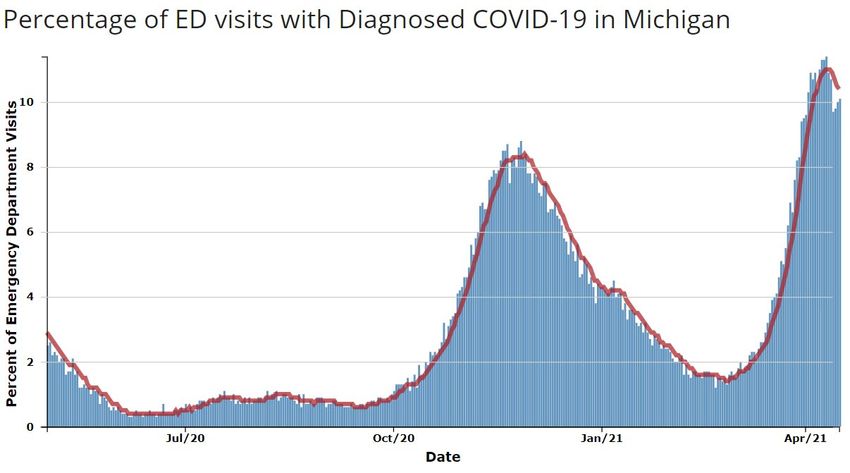
Michigan Trends in Emergency Department Visits for COVID-19-Like
Illness (CLI)

                                                                                         10.4%

                                            Source: https://covid.cdc.gov/covid-data-tracker/#ed-visits
Average Hospital Admissions by Age
Confirmed COVID-19 Hospital Admissions by Age Group - Statewide Rolling Weekly Average through April 19
Age Daily Avg One Week % % Change
150 Group Adm. Change (#) since 2/28*
(#)
Peds 9.3 18% (1.4) 183% (6.0)
100 18-19 3.4 -8% (-0.3) 700% (3.0)
20-29 31.0 -6% (-2.1) 503% (25.9)
30-39 49.7 9% (4.1) 470% (41.0)
50 40-49 71.4 -10% (-8.0) 594% (61.1)
50-59 112.7 -1% (-0.9) 767% (99.7)
60-69 125.0 2% (3.0) 548% (105.7)
0
3/14/2021 3/21/2021 3/28/2021 4/4/2021 4/11/2021 4/18/2021 70-79 91.6 4% (3.4) 397% (73.1)
Peds 18 - 19 20 - 29 30 - 39 40 - 49 50 - 59 60 - 69 70 - 79 80+ Age
80+ 52.4 -12% (-7.1) 246% (37.3)
Unkn
Total¶ 571.4 -4% (-21.1) 468% (470.9)
* Lowest 7-day avg. hospital admissions following winter surge
¶ Total may not reflect state due to missing age data
• Currently, there are approximately 571 daily hospital admissions for COVID-19
• Over the past week, avg. daily hospital admissions has decreased although some groups are still experiencing increases
• Since Feb 28 low, all age groups remain relatively higher with the highest burden among those 50-59 and 60-69
Source: CHECC & EM ResourceStatewide Hospitalization Trends: Total COVID+ Census
COVID+ census in hospitals rose at a much slower
Hospitalization Trends 10/1/2020 – 4/19/2021 rate this week of 6% from the previous week (vs.
Confirmed Positive & Persons Under Investigation (PUI) 26% increase last week). Confirmed census is now
4211 patients which is the highest confirmed
3941 number recorded since April 9, 2020 (2020 peak=
4365 on April 8th)
Confirmed Positive
New hospital COVID admissions this week are down
about 4% (~4000) vs. last week and the number of
new admissions over the last 2 days was the lowest
2 day admission volume in the past 2 weeks.
Hospitalized COVID Positive Long Term
Trend (beginning March 2020)
PUI
22Statewide Hospitalization Trends: Regional COVID+ Census
All regions except Region 2N are showing some
Hospitalization Trends 10/1/2020 – 4/19/2021 increase in hospital COVID census this week.
Confirmed Positive by Region
The fastest growth was in Regions 5,6
Region 1 (SW/Grand Rapids) and 8 (UP).
Region 2N
Region 2S
Region 3 The rest of the state showed very minimal
Region 5
Region 6
growth.
Region 7 Region COVID+ COVID+
Region 8 Hospitalizations (% Δ Hospitalizations
from last week) / MM
Region 1 355 (+4%) 328/M
Region 2N 1271 (+0%) 574/M
Region 2S 1220 (+5%) 548/M
Region 3 526 (+5%) 464/M
Region 5 216 (+14%) 227/M
Region 6 462 (+31%) 315/M
Region 7 132 (+4%) 264/M
Region 8 29 (+53%) 93/M
23Statewide Hospitalization Trends: ICU COVID+ Census
Overall, the census of COVID+ patients in ICUs has increased
Hospitalization Trends 8/1/2020 – 4/19/2021 14% from last week and now exceeds the winter peak
Confirmed Positive in ICUs census. Fastest growth was in Region 1 and 6.
Regions 1, 2N and 5 have >95% overall ICU occupancy.
814 6 Regions have >30% of ICU beds occupied with COVID
patients and Regions 1 and 2N are nearing 40%.
Region Adult COVID+ in Adult ICU % of Adult ICU
ICU Occupancy beds COVID+
Region 1 70 (+52%) 96% 38%
Region 2N 206 (+4%) 98% 38%
Region 2S 264 (+6%) 74% 31%
Confirmed
Positive in ICU Region 3 119 (+3%) 87% 30%
Region 5 39 (-7%) 96% 25%
Region 6 131 (+62%) 71% 36%
Region 7 53 (+26%) 92% 35%
Region 8 13 (+30%) 75% 25%
Hospital bed capacity updated as of 4/16
24Wave 2 and 3 Growth Rate Comparison (through 4/19)
• Statewide Covid+ hospital census is 15% higher than the winter wave (wave #2) when aligned to the same starting point
• Regions 2N and 2S (SE) Covid+ hospital census is 28% higher vs. comparable starting point
• Notably both the state and the SE are showing patterns of slowing growth that are very similar to the winter wave
Covid+ hospital census, State overall Covid+ hospital census, Regions 2N + 2S (SE)
4500
15% ahead (4,211 vs 3,673) 3000
4000
Wave 2 – winter 2020
28% ahead (2,491 vs 1,946)
Wave 2 – winter 2020 2500
3500 Wave 3 – spring 2021 Wave 3 – spring 2021
3000 2000
Nov 18th 2020 Wave 2, Pause
2500
1500
2000
1500 1000 Nov 18th 2020 Wave 2, Pause
1000
500
500 2N = Oakland, Macomb, and St. Clair
2S = Monroe, Washtenaw and Wayne + Detroit
0 0
0 10 20 30 40 50 60 70 0 10 20 30 40 50 60 70
Days since start date: Oct 7th 2020 for Wave 2 Days since start date: Oct 14th 2020 for Wave 2
and Feb 28th 2021 for Wave 3 and Feb 28th 2021 for Wave 3
25Average and total new deaths, by age group
Daily confirmed and probable deaths per million by Under 70 daily confirmed and probable deaths per
age group (7 day rolling average) million by age group (7 day rolling average)
0-19 40-49 70-79 0-19 40-49 Total
20-29 50-59 80+ 20-29 50-59
30-39 60-69 Total 30-39 60-69
75 15
50 10
25 5
0 0
1/18 2/1 2/15 3/1 3/15 3/29 4/12 1/18 2/1 2/15 3/1 3/15 3/29 4/12
Note: Death information sourced from MDHHS and reflects date of death of confirmed and probable cases.
Source: MDHHS – Michigan Disease Surveillance SystemAverage and total new deaths, by age group
Total confirmed and probable deaths by age group
(past 30 days, ending 4/10/2021)
196
• All age groups (by decade) are seeing
increases in deaths
148 • In the past 30 days, 20% of deaths occurred in
those under 60 years of age
119 • This is an increase of 1% from last week
67
27
13
1-5 1-5
0-19 20-29 30-39 40-49 50-59 60-69 70-79 80+
Note: Death information sourced from MDHHS and reflects date of death of confirmed and probable cases.
Source: MDHHS – Michigan Disease Surveillance System30-day rolling average daily deaths per million people by race and
ethnicity
Average daily deaths per million people by race Average daily deaths per million people by
ethnicity
American Indian/Alaska Native Black/African American Hispanic or Latino Not Hispanic or Latino
8 Asian/Pacific Islander White 8
6 6
4 4
2 2
0 0
1/18 2/1 2/15 3/1 3/15 3/29 4/12 1/18 2/1 2/15 3/1 3/15 3/29 4/12
Updates since last week:
• Deaths are a lagging indicator of cases, and death rates are increasing among racial and ethnic groups
• All racial and ethnic groups are seeing an increase in COVID deaths
• Whites and Blacks have the most reported deaths per capita while Non-Hispanic Latino have experienced a larger increase
• Deaths are not adjusted for confounders (e.g., age, sex, comorbidities)
Note: Death information sourced from MDHHS and reflects date of death of confirmed and probable cases.
Source: MDHHS – Michigan Disease Surveillance SystemHow is public health capacity?
Diagnostic testing volume (PCR and antigen) has increased from last week
• PCR testing increased since last week
• Percent of antigen tests declined slightly since last week
Cases identified for investigations has plateaued
• Consistent low proportion of cases interviewed with a source of known infection (indicating community acquisition)
• Consistent low proportion of those quarantining when their symptoms begin (indicating no effective halt in community
transmission)`
Daily diagnostic tests, by message date
Last 90 Days Tests By Test Type and Message Date Weekly Update
90,000 • 64,773 rolling 7-day
80,000
average daily
diagnostic tests
70,000 reported to MDHHS
60,000
(PCR + Ag) (↑)
50,000
• 52,938 average daily
PCR tests (↑)
40,000
• 24.1% are antigen
30,000 tests over the past
week (↓)
20,000
10,000
• 16.4% positivity in
-
PCR tests (↓)
2/1/2021
2/3/2021
2/5/2021
2/7/2021
2/9/2021
3/1/2021
3/3/2021
3/5/2021
3/7/2021
3/9/2021
4/2/2021
4/4/2021
4/6/2021
4/8/2021
1/16/2021
1/18/2021
1/20/2021
1/22/2021
1/24/2021
1/26/2021
1/28/2021
1/30/2021
2/11/2021
2/13/2021
2/15/2021
2/17/2021
2/19/2021
2/21/2021
2/23/2021
2/25/2021
2/27/2021
3/11/2021
3/13/2021
3/15/2021
3/17/2021
3/19/2021
3/21/2021
3/23/2021
3/25/2021
3/27/2021
3/29/2021
3/31/2021
4/10/2021
4/12/2021
4/14/2021
Total Diagnostic Tests Total Serologic Tests Total Antigen Tests 7 day moving average, diag. tests
Source: MDSS/Michigan Medical Advantage Group, MDHHS, testing labsNew Case Investigation Metrics (Statewide)
New Communicable Disease metrics this week:
• Number of case investigations completed increased, and percent completed (20%) increased
• 46% of investigated cases having a known source (46% last week, 46% week prior)
• 30% of investigated cases noting that they were quarantining before symptoms (30% last week)
04/03-04/09 Case report form information 04/10-04/16 Case report form information
48,157 45,754 Yes No Not answered
39,107
36,521
9,050 9,050
9,233 9,233
18% 21%
9,050 17% 20%
36% 49%
(19%) 9,233 37% 50%
46% 30% (20%) 46% 30%
Case investigation complete? Known source of infection? Already quarantining at time Case investigation complete? Known source of infection? Already quarantining at time
of symptom onset? of symptom onset?
Source: MDHHS – Michigan Disease Surveillance SystemDaily Confirmed + Probable COVID Case, Interview Attempt, and Interview Completion Volume
12000
10000
8000
6000
4000
2000
0
COVID Cases Interview Attempted Interview Completed
7-Day Average COVID Cases 7-Day Average Interviews Attempted 7-Day Average Interviews CompletedCOVID-19 Vaccination
Administration
• 9th among national jurisdictions for raw number with first dose; 9th for number fully vaccinated (per CDC data
tracker as of 4/19/2021)
• 79.4% adjusted administration ratio (excluding federal entities, per CDC channel portfolio as of 4/18/2021)
Coverage
• 45.6% of MI residents age 16+ have initiated COVID vaccination series and 31.5% have completed their series
• Coverage is highest among 65-75 and 75+ age groups
• Initiation coverage was highest among Asian, Native Hawaiian or Pacific Islander Race individuals
• Case rates are lower in age groups with higher vaccination coverage
Vaccinated Individuals Who Test Positive
• Number of cases who are fully vaccinated (n=694) is not in excess of what might be expected with vaccines with
95% efficacy.
• Possibility of infection and further transmission is why recommend precautions in public (e.g. wearing masks,
washing hands and social distancing) even after receiving the vaccine until more Michiganders have been able to
be vaccinatedRecommendation to Pause Use of Johnson & Johnson’s Janssen COVID- 19 Vaccine Source: CDC – Recommendation to Pause Use of Johnson & Johnson’s Janssen COVID-19 Vaccine
Doses Delivered and Administered, and Coverage as of 4/20
      8,077,755 doses delivered to Michigan providers*

      6,065,254 doses Administered
      • 79.4% Federal-Jurisdiction adjusted administration ratio (excluding federal entities, per CDC channel portfolio as of
         4/18/2021)

      • 5 weeks with more than 500,000 doses administered in a week; 14 days over 100,000 in a day
      • 586,072 doses administered last week (down ~74,000 mostly due to a pause in J&J administration).
*Includes state allocated doses ordered by State of Michigan, SOM allocation transferred to federal programs, and federal doses from federal programs to Michigan providers. Does
not include federal doses sent to federal providers (i.e., Veteran’s Administration hospitals, federal prison system, or Department of Defense programs). The State of Michigan does
not have control over how much vaccine is allocated or administered by Federal program.
Coverage
Demographics as of
04/20/2021
45.6% of MI residents age 16+ have initiated
COVID vaccination series
31.5% or 2,547,645 people have completed
their series
Age Group
• 72.2% people aged 65 or older (1.27M) have
received one or more doses of vaccine
• 63.6% people aged 65 or older have
completed their vaccine series
Race/Ethnicity
• Initiation coverage highest among those of
Asian, Native Hawaiian or Pacific Islander
Race (35.4%) then NH (Non-Hispanic) White
(34.1%), NH American Indian (30.0%), NH
Black or African American (21.4%) Races,
and Hispanic (21.3%) ethnicity
• 26.7% data missing or unknown
Source: Michigan Coronavirus Dashboard https://www.michigan.gov/coronavirus/0,9753,7-406-98178_103214-547150--,00.htmlComparing Vaccine Coverage and Case Rate Trends (Dec 19 – Apr 10)
Solid lines – case rates per million
Dashed lines – vaccine coverage (%)
1000 70.0%
900
60.0%
800
700 50.0%
600
40.0%
500
30.0%
400
300 20.0%
200
10.0%
100
0 0.0%
12/19 12/26 1/2 1/9 1/16 1/23 1/30 2/6 2/13 2/20 2/27 3/6 3/13 3/20 3/27 4/3 4/10
20-29 years 30-39 years 40-49 years 50-59 years 60-69 years 70-79 years 80+ years
Source: Michigan Disease Surveillance System (MDSS) and Immunization ProgramPotential COVID-19 Vaccination Breakthrough Cases
Process:
Michigan part of CDC’s nationwide investigation (COVID-19 Breakthrough Case Investigations and Reporting | CDC)
Weekly match COVID-19 cases to records of all fully vaccinated persons
Absence of a positive test less than 45 days prior to the post-vaccination positive test
Send data to CDC and, if available, gather respiratory specimens for whole genome sequencing
Michigan Data (1/1/21 through 4/13/21):
694 cases met criteria based on a positive test 14 or more days after being fully vaccinated
Less than 1% of people who were fully vaccinated met this case definition
— Includes 14 deaths, 12 persons 65 years or older, one had prior PCR positive greater than 45 days prior
— 14 cases were hospitalized
Summary Points:
• Number of potential cases identified to date is not in excess of what might be expected with vaccines with 95% efficacy.
• Proportions of those symptomatic, hospitalized, and who died are all lower than those who are unvaccinated.
• Continue to encourage precautions while out in public, including wearing masks, washing hands and social distancing,
even after receiving the vaccine until more Michiganders have been able to be vaccinated.Covidestim.org
Rt estimates suggest
slowing growth over
the coming weeks
with potential for 1
plateau
Epiforecasts.io
• Rt estimates are ~1,
which suggests plateau
or slowed growth for the
next couple of weeksSummer plateau
Note case rates were lower for this increase—
Previous
we are unlikely to reach such low case rates currently
Further
increase
increases have Plateau
resolved in Increase
different ways
Winter surge vs current surge
• Some plateaus and
Peak/plateau
peaks have been
followed by further
increases, others by Decline
declines Increase
Source: MDSS DataRidge regression projections vary by region—some
projected to plateau, others project slowed growth
• Confidence ranges for
all regions include
both plateaus and
slowed growth
Michigan (statewide)
Sources: Data from MDHHS/JHU,
Line is the ridge regression model projection, and the shaded region represents the 95% confidence
region (2.5% and 97.5% quantiles). Cases are plotted by report date.
UM Ridge Regression ModelCOVID-19-Sim Model projects slowing growth
through April/May followed by decline
• Assumes continued
current interventions
• Confidence ranges
range from a plateau
and decline in the next
couple of weeks to
continued growth
through May/June
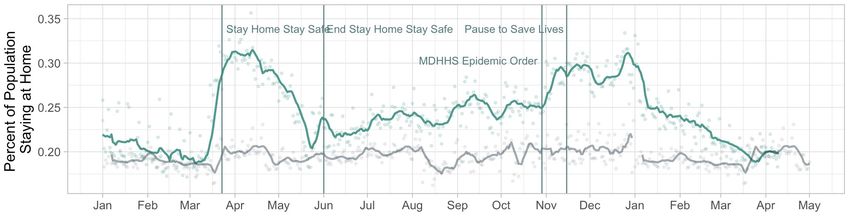
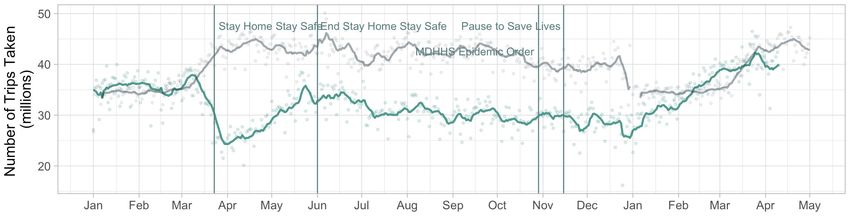
Source: http://covid19sim.orgHow many people are staying at home in Michigan?
2020 - 2021
2019
• % Stay-at-home
levels have recently
declined to 2019-
2020 levels
• Number of trips
taken/day has
recently increased
to 2019-2020 levels
• Most recent data is
4/10/21 (data as of
4/19/21)
Data Source: Bureau of
Transportation StatisticsChange in average mobility
Unacast mobility
patterns in MI
• Most recent data shows
a return toward Change in non-essential visits
baseline mobility
patterns, particularly
for non-essential visits.
• Encounter density has
stayed relatively low.
• Data through 4/15/21 Difference in encounter density
(data as of 4/19/21)
Unacast social distancing
scoreboard
https://www.unacast.com/co
vid19/social-distancing-
scoreboardYou can also read