MI COVID response Data and modeling update - April 13, 2021 - State of ...
←
→
Page content transcription
If your browser does not render page correctly, please read the page content below
MI COVID response
Data and modeling update
April 13, 2021

NOTE: all data as of Apr 10 unless otherwise noted
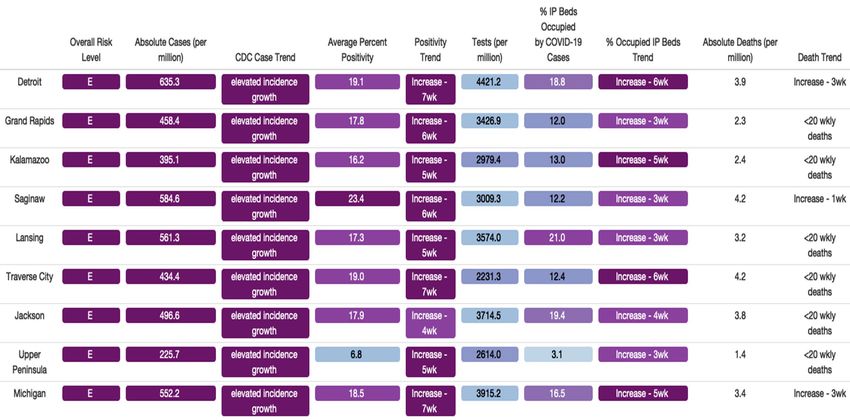
Executive summary
Percent Positivity is up 17% and Case Rates are up 14% since last week. Positivity (18.5%, ↑2.9%) and case rates
(552.2, ↑61.2) have been increasing for seven weeks

  Michigan has the highest number of cases (↑2), and highest case rate (↑2) in the last 7 days (source: CDC COVID
  Data Tracker)

Percent of inpatient beds occupied by individuals with COVID-19 has increased 39% since last week to 16.5%
(↑4.6%). Trends for COVID hospitalizations are increasing for five weeks

  Michigan has the highest inpatient bed utilization (↔), and the highest adult ICU bed utilization (↔) (source: US
  HHS Protect)

Deaths have increased 39% since last week. There were 237 (↑71) deaths between Mar 28 and Apr 3, and the Death
Rate is 3.4 deaths per million residents (↑1.0)

  Michigan has the 8th highest number of deaths (↑4), and T8th highest death rate (↑20) in the last 7 days (source:
  CDC COVID Data Tracker)

The 7-day average state testing rate has increased to 3,915.2 tests/million/day (↑418.1). Daily diagnostic tests (PCR)
is 38.9K per day (↑4.1K), and the weekly average for PCR and antigen tests conducted in Michigan is 56.7K (↑5.0K).

5.4 million COVID-19 vaccine doses reported to MDHHS, 41.9% of Michigan population 16+ has at least one dose
Comparison across states: Summary
What we see today (data through 4/11):
• 16 states are seeing increasing 1 week case trends (>=10%) (down vs. 26 last week)
• 23 states are seeing weekly increases (>=10%) in new COVID hospital admissions (up vs. 21)
• Michigan, DC, New Jersey, New York and Maryland have highest per capita hospitalized
  patient numbers.
• Midwest (case data from CDC):
   –   Wisconsin with increase in hospitalizations (57/M) and increase in cases (108/100k last 7d)
   –   Indiana with increase in hospitalizations (120/M), and increase in cases (116/100k last 7d)
   –   Illinois showing increase in hospitalizations (145/M), and increase in cases (182/100k last 7d)
   –   Ohio with increase in hospitalizations (133/M) and increase in cases (132/100k last 7d)
   –   Michigan showing increase in hospitalizations (389/M) and increase in cases (515/100k last 7d)

                                                                                                         3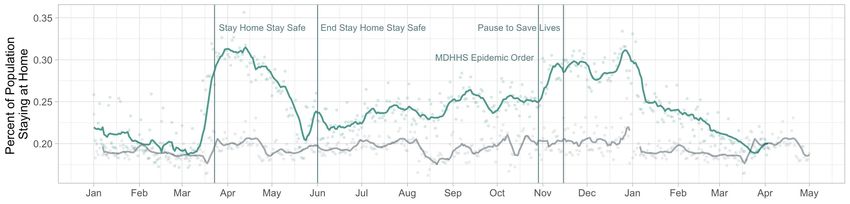
COVID-19 Spread Statewide positivity has increased to 18.5%, and is increasing in all MERC regions • One week increase of 17% (compared to 35% last week) • Increasing for seven weeks (429% cumulative increase since mid-February) • Seven MERC regions are now above 15% (Risk Level D) • One MERC region, Saginaw, above 20% (Risk Level E) • Highest state, regional, and county levels recorded since mid-April 2020 Case rates (552.2 cases/million) have also increased in the state One week increase of 14% (compared to 55% last week) Increasing for seven weeks (434% cumulative increase since mid-February) All eight MERC regions showing an elevated increase growth Increases are seen among all age groups, races, and ethnicities Variants in Michigan: 2,658 (↑841) confirmed B.1.1.7; 9 (↑2) confirmed B.1.351; 9 (↑7) confirmed P.1 Number of active outbreaks is up 16% from previous week — Reported school outbreaks have increased since last week (301 to 312)
Confirmed and probable case indicators                                            Risk levels
Table Date: 4/10/2021 (7 days from date table was produced: 4/3/2021)   Low   A    B      C     D   E

 Cases                                             Positivity

Statewide Positivity Trends
Daily positivity and 7-day rolling average positivity for Michigan
    70%

    60%

    50%

    40%

    30%

    20%

    10%

     0%
       3/10               4/10             5/10              6/10   7/10   8/10   9/10   10/10   11/10   12/10   1/10   2/10   3/10   4/10

•      Early in the pandemic, testing was not as robust as it has been since July 2020 to present
•      Positivity is an early indicator of SARS-CoV-2 Transmission (as positivity increases, we expect case rates to follow)
•      Current statewide positivity is the highest it has been since April 22, 2020*
•      These are for PCR tests only and exclude tests conducted with Michigan Department of Corrections
    *Note: Testing was not as robust early in the pandemic
    Source: MDHHS – Michigan Disease Surveillance System
Positivity by county, 3/26-4/1
                                                 Average            # of counties                This week
                                                 positivity per day                              Last week

                                                       =20%                             25
                                                                                   16

                                                 Updates since last week:
                                                 70 of 83 counties saw double digit positivity
                                                 in the last week (7 county increase)
                                                 74 of 83 counties saw positivity > 7% in the
                                                 last week (1 county increase)

 Source: SEOC Testing Results – Excluding MDOC
Cumulative COVID-19 Case Rates: Midwest Comparison
                                                                                 Cumulative Case Rates (per 100,000)
                            12000

                            10000

                             8000                                                                                                                        Michigan

                             6000

                             4000

                             2000

                                  0
                                      3/1       4/1       5/1          6/1     7/1     8/1     9/1    10/1    11/1      12/1   1/1     2/1   3/1   4/1
                                                            Illinois         Indiana     Michigan     Minnesota        Ohio    Wisconsin

•    Cumulative incidence per 100,000 cases in Michigan has been lower than other states in the Midwest following spring 2020 surge
•    Michigan’s mitigation policies helped control the spread of SARS-CoV-2 relative to other states in the Midwest, particular during surge in
     November and December
•    The current trajectory in Michigan is bringing us closer to case rates of our Midwest neighbors

Source: CDC COVID Data Tracker – State Trend Comparison
COVID-19 cases by onset date: State of Michigan

            Cumulative confirmed and probable cases, by date of                                                           New confirmed and probable cases, by date of
            onset of symptoms                                                                                             onset of symptoms
              900000                                                                                                        10000

              750000
                                                                                                                              7500
              600000

              450000                                                                                                          5000

              300000
                                                                                                                              2500
              150000

                       0                                                                                                           0
                           3/1         5/1          7/1          9/1         11/1          1/1          3/1                            3/1         5/1           7/1          9/1          11/1          1/1          3/1

Updates since last week:
•     Cases have increased for over seven weeks
•     Statewide case rate above risk level E (above 150 cases/million)
•     There are over 5,500 new cases per day
Note: Case information sourced from MDHHS and reflects date of onset of symptoms (refers to lab-confirmed cases). Case spike on 5/12 is a result of batch of test results, not all of which have onset date of symptoms completed
Source: MDHHS – Michigan Disease Surveillance System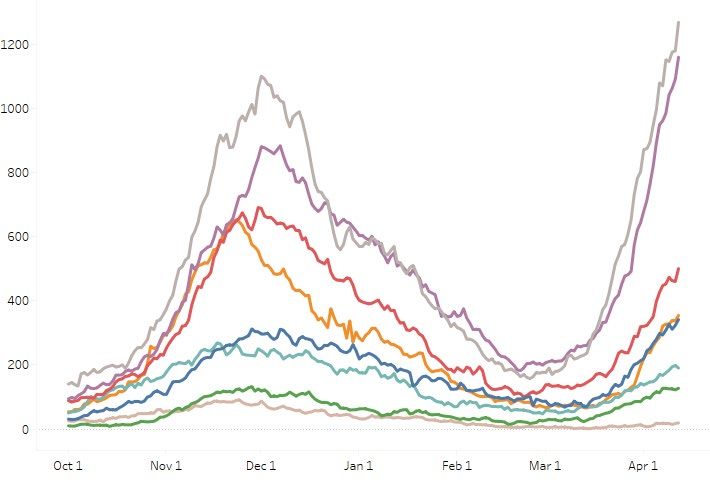
Age group: average new daily cases
Daily new confirmed and probable cases per million by age group (7-day rolling average)

                                   0-9                 30-39               60-69
    1000                           10-19               40-49               70-79
                                   20-29               50-59               80+

     800

     600

     400

     200

         0
             3/1            4/1             5/1             6/1             7/1        8/1   9/1   10/1   11/1   12/1   1/1   2/1   3/1   4/1

•      All age groups by decade are increasing
•      Those aged 20-29 and 30-39 have the highest case rates
•      There are over 5,500 new cases per day
    Note: Case information sourced from MDHHS and reflects date of onset of symptoms
    Source: MDHHS – Michigan Disease Surveillance System
Age group: average new daily cases and daily case rate
Daily new confirmed and probable cases per million by age group (7-day rolling average)
Age Average Average One Week % Change since
Group daily cases Daily Case % Change (Δ #) 2/19* (Δ #)
Rate
0-9 285.3 247.5 14% (35) 479% (236)
10-19 827.3 659.2 3% (27) 386% (657)
20-29 1123.6 814.4 15% (146) 483% (931)
30-39 935.3 771.0 16% (126) 501% (780)
40-49 845.3 716.7 16% (116) 482% (700)
50-59 796.4 589.8 13% (89) 457% (653)
60-69 440.0 344.9 15% (56) 331% (338)
70-79 162.4 211.8 26% (33) 231% (113)
80+ 70.9 171.1 18% (11) 138% (41)
* Lowest 7-day avg. following winter surge
Total¶ 5,513.1 552.2 13% (639) 429% (4,450) ¶ Total may not reflect state due to missing age data
• Daily number of cases (1,123.6) and daily case rate (814.4 cases/mil) is currently highest for those 20-29
• All age groups under 70 are experiencing an average of more than 200 cases per day
• Since February 19, case rate increases and number of cases have been highest among those under 70 years of age
Note: Case information sourced from MDHHS and reflects date of onset of symptoms
Source: MDHHS – Michigan Disease Surveillance SystemAverage daily new cases per million people by race and ethnicity
Daily new confirmed and probable cases per million Daily new confirmed and probable cases per
(7 day rolling average) by race category million (7 day rolling average) by ethnicity category
American Indian/Alaska Native Black/African American Hispanic or Latino Not Hispanic or Latino
450 450
Asian/Pacific Islander White
300 300
150 150
0 0
1/11 1/25 2/8 2/22 3/8 3/22 4/5 1/11 1/25 2/8 2/22 3/8 3/22 4/5
Updates since last week:
• Cases per million are increasing for all races and ethnicities
• Most recent data show that Blacks and Hispanic/Latinos have the highest case rates
• In the past 30 days, 37% of all cases represent unknown, multiple, or other races (31% of race is unknown, ↑1%)
• In the past 30 days, 36% of all cases have an unknown ethnicity reported (↑ 3%)
Note: Case information sourced from MDHHS and reflects date of death of confirmed and probable cases.
Source: MDHHS – Michigan Disease Surveillance SystemIdentified COVID-19 Cases Caused by All Variants of Concern
in US and Michigan
Emergent Variant Cases of Concern in Emergent Variants of Cases in Michigan
the United States .
112 cases in Wayne attributed to Detroit
Variant Reported Cases in MI Number of Counties
Reporting Cases
(↑1) B.1.1.7 2,640* 62
(↑5) B.1.351 9 6
(↑9) P.1 9 5
Data last updated April 12, 2021 * 513 cases within MDOC; 4 cases currently out of state or county unknown
Source: https://www.cdc.gov/coronavirus/2019-ncov/transmission/variant-cases.html and Michigan Disease Surveillance System (MDSS)Number of outbreak investigations by site type, week ending Apr 8
Easier to identify outbreak
Pr e - d ecision al, f o r d iscussion o nly Dr af t Harder to identify outbreak
Site type Outbreaks by ongoing/new classification, # Visibility1 Total number of active
Ongoing New Total outbreaks is up 16% from
previous week
K- 12 SCHO O L 264 48 312
MA NUF A CT UR IN G , CONS T R U CT IO N 160 39 199
122 29 151 Following K-12 (48), the
SNF/L T C/ O T HE R A SSIS T E D LIV ING
CHIL DCA R E/Y O U T H PRO G RA M 79 27 106 greatest number of new
*RETA IL 65 29 94 outbreaks were reported in
OFF ICE SET T IN G 42 23 65 manufacturing/ construction
*RES TA U RA N T S A ND BA RS 35 23 58 (39), SNF/LTC (29), retail (29),
HEA L T HCA R E 28 4 32 childcare/youth programs (27),
COLL EG E/ U N IV E R S IT Y 21 3 24 office settings (23), and
*SOCIA L GA THER IN G 18 5 23 restaurants & bars (23).
OTHER 15 5 20
*REL I G I O U S SERV I CE S 12 6 18 LHDs reported new outbreaks
*PER S O NA L SERV IC E S 14 3 17 in all settings except shelters
CORRE C T I O N S 13 3 16 and outdoor community
A GRICU L T U RA L / F O O D PRO CE S S I NG 9 1 10 exposures.
*SHEL T E RS 4 0 4
*CO MMU N IT Y EXPO S UR E - INDO O R 1 1 2
*CO MMU N IT Y EXPO S UR E - OUT DO O R 1 0 1
TO TA L 903 249 1152
1. Based on a setting’s level of control and the extent of time patrons/residents spend in the particular setting, different settings have differing levels of ability to ascertain whether a case derived from that setting
NOTE: Many factors, including the lack of ability to conduct effective contact tracing in certain settings, may result in significant underreporting of outbreaks. This chart does not provide a complete picture of
outbreaks in Michigan and the absence of identified outbreaks in a particular setting in no way provides evidence that, in fact, that setting is not having outbreaks.
Source: LHD Weekly SitrepsLong-Term Care Facilities: Number of Outbreak Investigations by Week
Weekly new outbreaks in LTC/SNF through April 8
New outbreaks reported in LTC/SNF
120
100
80
60
40
20
0
9-Jul 23-Jul 6-Aug 20-Aug 3-Sep 17-Sep 1-Oct 15-Oct 29-Oct 12-Nov 26-Nov 10-Dec 24-Dec 7-Jan 21-Jan 4-Feb 18-Feb 4-Mar 18-Mar 1-Apr
• The number of outbreaks in long term care facilities had been reflecting case trends in the community
• Outbreaks peaked in mid-November
• Increases are again seen recently in LTC/SNF
Many factors, including the lack of ability to conduct effective contact tracing in certain settings, may result in significant underreporting of outbreaks. This chart does not provide a complete picture of outbreaks in Michigan and the
absence of identified outbreaks in a particular setting in no way provides evidence that, in fact, that setting is not having outbreaks.
Source: LHD Weekly SitrepsSTATE OF MICHIGAN WEEKLY TOTAL CONFIRMED COVID-19 CASES IN
NURSING HOMES - RESIDENTS AND STAFF
05/31/2020 to 04/09/2021
1400
1180
1200
1126
1091
1000 993
967
912 916
888
792
800 816 754
719
600
514
547 485
431 489
417 456 471
411
387
400 416 402
356 285 301 272 254
239 287
209
242 254 266 257 262
217 217 154 223
200 134 192 188 142
185
181
116 110
164 168 109 176
92 85 150 88 106
160 143
78 75 64 129
64 119 67 59
111
52 54 108 42 57 100 38 93 98 54
101 50 53
76 8025 6532 7731 8336 94
0
Weekly Total Confirmed Cases Resident Weekly Total Confirm Cases StaffK-12 school outbreaks, recent and ongoing, week ending Apr 8
Number of reported outbreaks increased since last week (301 to 312) including increases in Administrative (4 to 5), Middle/Jr High (64 to 68),
and Pre-K – Elementary (61 to 74). Only High Schools decreased (172 to 165).
Number of Range of cases
Region Number of reported cases,# # Ongoing - Excluding New # New outbreaks per outbreak
Region 1 385 99 60 2-59
Region 2n 306 61 103 2-28
Region 2s 139 30 27 2-20
Region 3 539 65 43 2-54
Region 5 143 15 22 2-41
Region 6 246 27 30 2-45
Region 7 151 21 25 2-26
Region 8 19 0 2 2-17
Total 1,928 318 312 2-59
Number of Range of cases
Grade level Number of reported cases,# # Ongoing - Excluding New # New outbreaks per outbreak
Pre-school - elem. 244 80 74 2-44
Jr. high/middle school 355 60 68 2-59
High school 1,321 176 165 2-54
Administrative 8 2 5 2-2
Total 1,928 318 312 2-59
Many factors, including the lack of ability to conduct effective contact tracing in certain settings, may result in significant underreporting of outbreaks. This chart does not provide a complete picture
of outbreaks in Michigan and the absence of identified outbreaks in a particular setting in no way provides evidence that, in fact, that setting is not having outbreaks.
Source: LHD Weekly SitrepsCOVID-19 K-12 Sports Related Clusters and Cases
Over 291 clusters associated with 1,091 cases since January 2021
394 cases 271 cases 229 cases 63 cases 32 cases 27 cases 14 cases
106 clusters 51 clusters 62 clusters 21 clusters 8 clusters 3 clusters 3 clusters
12 cases 11 cases 9 cases 10 cases 20 cases
6 clusters 8 clusters 4 clusters 7 clusters 13 clusters
• Cases identified by local public health which include school-affiliated and club/travel/regional sports (spectators,
collegiate, and professional sports as well as secondary cases to collegiate/professional sports are excluded)
• Since January 2021, basketball, hockey, and wrestling have had the highest number of cases and clusters
• Cases and clusters have occurred in 20 different sport settings
Source: MDHHS – Michigan Disease Surveillance System - Cumulative between Jan 2021 and Apr 2021COVID-19 and Healthcare Capacity and COVID Severity Hospitalizations and ICU utilization are increasing COVID-like illness (CLI) has increased to 10.9% Hospital admissions are increasing for all age groups and are highest for those 50-59 and 60-69 years Hospitalizations up ~26% since last week All regions are showing increasing hospitalization trends this week Volume of COVID-19 patients in intensive care (ICU) has increased 25% since last week Deaths trends have shifted and are now increasing to 3.4 deaths per million Deaths are a lagging indicator of cases and hospitalization Deaths are up 39% since last week (accelerated growth) Deaths are up 144% since the March 9 low Proportion of deaths among those 60+ is slowly declining
Michigan Trends in Emergency Department Visits for COVID-19-Like
Illness (CLI)

                                                                                     10.9%

                                            Source: https://covid.cdc.gov/covid-data-tracker/#ed-visits
Average Hospital Admissions by Age
Confirmed COVID-19 Hospital Admissions by Age Group - Statewide Rolling Weekly Average
Confirmed COVID-19 Hospital Admissions by Age Group - Statewide Age Daily Avg One Week % % Change
120 Rolling Weekly Average Group Adm. Change (#) since 2/28*
(#)
Peds 7.9 -10% (-0.9) 139% (4.6)
90
18-19 3.7 73% (1.6) 767% (3.3)
20-29 33.1 30% (7.6) 544% (28.0)
60
30-39 45.6 7% (3.0) 423% (36.9)
40-49 79.4 28% (17.4) 672% (69.1)
30 50-59 113.6 16% (15.7) 774% (100.6)
60-69 122.0 35% (31.7) 533% (102.7)
0 70-79 88.1 38% (24.4) 378% (69.7)
3/7/2021 3/14/2021 3/21/2021 3/28/2021 4/4/2021 4/11/2021
80+ 59.6 24% (11.6) 293% (44.4)
Peds 18 - 19 20 - 29 30 - 39 40 - 49 50 - 59 60 - 69 70 - 79 80+ Age… Total¶ 592.6 28% (129.6) 489% (492.0)
* Lowest 7-day avg. hospital admissions following winter surge
¶ Total may not reflect state due to missing age data
• Currently, there are approximately 593 daily hospital admissions for COVID-19
• Over the past week, those 60-69 have seen the greatest increase in avg. daily hospital admissions
• Since Feb 28 low, those 50-69 have seen the greatest increase in avg. daily hospital admissions and percent change
Source: CHECC & EM ResourceStatewide Hospitalization Trends: Total COVID+ Census
COVID+ census in hospitals continues to rise, though at
Hospitalization Trends 10/1/2020 – 4/12/2021 a slower rate. This week is up 26% from the previous
Confirmed Positive & Persons Under Investigation (PUI) week (vs. 45% increase last week) and exceeds the
Dec. 1st 2020 winter peak.
3941
Doubling time has slowed to ~21 days this week (from
doubling every 12-14 days over the past 3 weeks)
Confirmed Positive
Slower increase is driven mainly by faster discharge
rates as new admissions for COVID were up ~40%
week over week (~4100 new admissions this week)
Hospitalized COVID Positive Long Term
Trend (beginning March 2020)
PUI
22Statewide Hospitalization Trends: Regional COVID+ Census
All regions are showing increasing
Hospitalization Trends 10/1/2020 – 4/12/2021 hospitalization trends this week although
Confirmed Positive by Region growth is slower in Region 7 and 8 this week.
Region 1 4 Regions are >300/M and Region 2N + 2S are
Region 2N
Region 2S >500/M population hospitalized.
Region 3
Region 5
Region 6
Region 7 Region COVID+ COVID+
Region 8 Hospitalizations (% Δ Hospitalizations
from last week) / MM
Region 1 341 (+22%) 315/M
Region 2N 1268 (+27%) 573/M
Region 2S 1159 (+30%) 520/M
Region 3 500 (+26%) 441/M
Region 5 190 (+23%) 199/M
Region 6 354 (+29%) 241/M
Region 7 127 (+9%) 254/M
Region 8 19 (+6%) 61/M
23Statewide Hospitalization Trends: ICU COVID+ Census
Overall, volume of COVID+ patients in ICUs has increased 25%
Hospitalization Trends 8/1/2020 – 4/12/2021 from last week mainly in Regions 2S, 2N and 3.
Confirmed Positive in ICUs
Total ICU COVID+ census is nearing winter peak levels.
Regions 1 and 3 have >90% overall ICU occupancy.
814
4 regions have >30% of ICU beds occupied with COVID
patients.
Region Adult COVID+ in Adult ICU % of Adult ICU
ICU Occupancy beds COVID+
Region 1 46 (-4%) 95% 24%
Region 2N 198 (+30%) 78% 34%
Confirmed Region 2S 250 (+51%) 82% 33%
Positive in ICU Region 3 115 (+28%) 92% 32%
Region 5 42 (+11%) 88% 26%
Region 6 81 (+4%) 78% 32%
Region 7 42 (-14%) 77% 23%
Region 8 10 (+25%) 66% 17%
Hospital bed capacity updated as of 4/9
24Wave 2 and 3 Growth Rate Comparison (through 4/12)
• Statewide hospitalizations are 16% higher than the winter wave (wave #2) when aligned to the same starting point.
• Regions 2N and 2S (SE) are a week ahead of their winter wave growth with 44% higher hospitalizations vs. comparable
starting point reflecting earlier start and continued rise in census this wave (wave #3)
Covid+ hospital census, State overall Covid+ hospital census, Regions 2N + 2S (SE)
4500 3000
16% ahead (3,958 vs 3,404) 44% ahead (2,427 vs 1,686)
4000
Wave 2 – fall-winter 2020 2500
Wave 2 – fall-winter 2020
3500 Wave 3 – spring 2021 Wave 3 – spring 2021
3000 2000
Nov 18th 2020 Wave 2, Pause
2500
1500
2000
1500 1000 Nov 18th 2020 Wave 2, Pause
1000
500
500 2N = Oakland, Macomb, and St. Clair
2S = Monroe, Washtenaw and Wayne + Detroit
0 0
0 10 20 30 40 50 60 70 0 10 20 30 40 50 60 70
Days since start date: Oct 7th 2020 for Wave 2 Days since start date: Oct 14th 2020 for Wave 2
and Feb 28th 2021 for Wave 3 and Feb 28th 2021 for Wave 3
25Average and total new deaths, by age group
Daily confirmed and probable deaths per million by Under 70 daily confirmed and probable deaths per
age group (7 day rolling average) million by age group (7 day rolling average)
0-19 40-49 70-79 0-19 40-49 Total
20-29 50-59 80+ 20-29 50-59
30-39 60-69 Total 30-39 60-69
100
14
80 12
10
60
8
40 6
4
20
2
0 0
1/11 1/25 2/8 2/22 3/8 3/22 4/5 1/11 1/25 2/8 2/22 3/8 3/22 4/5
Note: Death information sourced from MDHHS and reflects date of death of confirmed and probable cases.
Source: MDHHS – Michigan Disease Surveillance SystemAverage and total new deaths, by age group
Total confirmed and probable deaths by age group
(past 30 days, ending 4/3/2021)
234
• All age groups (by decade) are seeing
increases in deaths
175
• In the past 30 days, 19% of deaths occurred in
those under 60 years of age
136
• This is an increase of 4% from last week
73
31
15
5
1-5
0-19 20-29 30-39 40-49 50-59 60-69 70-79 80+
Note: Death information sourced from MDHHS and reflects date of death of confirmed and probable cases.
Source: MDHHS – Michigan Disease Surveillance System30-day rolling average daily deaths per million people by race and
ethnicity
Average daily deaths per million people by race Average daily deaths per million people by
ethnicity
American Indian/Alaska Native Black/African American Hispanic or Latino Not Hispanic or Latino
12 Asian/Pacific Islander White 12
8 8
4 4
0 0
1/11 1/25 2/8 2/22 3/8 3/22 4/5 1/11 1/25 2/8 2/22 3/8 3/22 4/5
Updates since last week:
• Deaths are a lagging indicator of cases, and death rates are increasing among racial and ethnic groups
• Whites and Blacks have the most reported deaths per capita while Non-Hispanic Latino have experienced a larger increase
• Deaths are not adjusted for confounders (e.g., age, sex, comorbidities)
Note: Death information sourced from MDHHS and reflects date of death of confirmed and probable cases.
Source: MDHHS – Michigan Disease Surveillance SystemHow is public health capacity?
Diagnostic testing volume (PCR and antigen) has increased from last week
• PCR testing increased since last week
• Percent of antigen tests declined slightly since last week
Testing
• Testing is higher in Michigan compared to the nation, but this doesn’t explain the higher positivity
• K-12
• College and University
• Pop-up testing for spring break travelers
• Support for community testing sites in socially vulnerable areas continues
Cases identified for investigations has sharply increased
• Number of cases not investigated this week (39,107) exceeds total number of cases reported the prior week (34,666)
• Consistent low proportion of cases interviewed with a source of known infection (indicating community acquisition)
• As cases have increased, the percent of interviews completed has declined
• Consistent low proportion of those quarantining when their symptoms begin (indicating no effective halt in community
transmission)`
Daily diagnostic tests, by message date
Last 90 Days Tests By Test Type and Message Date Weekly Update
80,000 • 56,658 rolling 7-day
average daily
70,000
diagnostic tests
60,000 reported to MDHHS
(PCR + Ag) (↑)
50,000
• 42,623 average daily
40,000 PCR tests (↑)
• 24.8% are antigen
30,000
tests over the past
20,000 week (↓)
10,000
• 18.5% positivity in
- PCR tests (↑)
1/9/2021
2/2/2021
2/4/2021
2/6/2021
2/8/2021
3/2/2021
3/4/2021
3/6/2021
3/8/2021
4/1/2021
4/3/2021
4/5/2021
4/7/2021
1/11/2021
1/13/2021
1/15/2021
1/17/2021
1/19/2021
1/21/2021
1/23/2021
1/25/2021
1/27/2021
1/29/2021
1/31/2021
2/10/2021
2/12/2021
2/14/2021
2/16/2021
2/18/2021
2/20/2021
2/22/2021
2/24/2021
2/26/2021
2/28/2021
3/10/2021
3/12/2021
3/14/2021
3/16/2021
3/18/2021
3/20/2021
3/22/2021
3/24/2021
3/26/2021
3/28/2021
3/30/2021
Total Diagnostic Tests Total Antigen Tests 7 day moving average, diag. tests
Source: MDSS/Michigan Medical Advantage Group, MDHHS, testing labsPCR Tests per 100,000
% Positivity
PCR Tests
Neighborhood
    Testing Sites*

*We continue to support community testing
sites in socially vulnerable areas
K-12 and
Sports *plus approx. 3k per week from independent sports clubs
*
Testing
• Testing in K-12 students is at an all time high
• We have received 34K tests from schools and youth sports clubs in the current week alone
• We continue to have testing available for educators on a weekly basisSpring Break Pop-Up Events • We continue to work with school districts to host post-spring break testing sites • We have collected over 17k tests thus far, with many more events planned
We are following this trend in percent positivity closely
New Case Investigation Metrics (Statewide)
New Communicable Disease metrics this week:
• Number of cases not investigated this week (39,107) exceeds total number of cases reported the prior week (34,666)
• Number of case investigations completed increased although percent completed (19%) decreased
• 46% of investigated cases having a known source (46% last week, 45% week prior)
• 30% of investigated cases noting that they were quarantining before symptoms (28% last week)
        03/27-04/02 Case report form information                                            04/03-04/10 Case report form information
                                                                                                    48,157                                   Yes        No        Not answered

            34,666

                                                                                                     39,107
            26,449
                                            8,217                     8,217
                                                                                                                                  9,050                         9,050
                                             17%                       21%
                                             37%                                                                                   18%                           21%
             8,217                                                     51%
                                                                                                     9,050                         36%                           49%
             (24%)
                                             46%                       28%                           (19%)                         46%                           30%
   Case investigation complete? Known source of infection?   Already quarantining at time   Case investigation complete? Known source of infection?   Already quarantining at time
                                                                 of symptom onset?                                                                        of symptom onset?

Source: MDHHS – Michigan Disease Surveillance System
COVID-19 Vaccination
National Comparisons
10th for number with first dose; 10th for number fully vaccinated
Vaccine Coverage
• 41.9% of MI residents have initiated COVID vaccination series and 27.5% have completed their series
Addressing vaccine disparities
• Coverage was highest among Non-Hispanic White individuals
• Racial/ethnic disparities smaller in 65 years and older age group
• Case rates are lower in age groups with higher vaccination coverage
Vaccinated Individuals Who Test Positive
• Number of cases who are fully vaccinated (n=334) is not in excess of what might be expected with vaccines with
95% efficacy.
• Possibility of infection and further transmission is why recommend precautions in public (e.g. wearing masks,
washing hands and social distancing) even after receiving the vaccine until more Michiganders have been able to
be vaccinatedDoses Shipped, Administered, and Coverage 6,233,325 state doses shipped (including state doses transferred to federal programs 5,445,355 doses administered 4 weeks with more than 500,000 doses administered in a week; 10 days over 100,000 in a day 632,661 doses administered last week 41.9% of MI residents have initiated COVID vaccination series 27.5% have completed their series or 2,226,729 people
Vaccine Coverage by Age Group
Vaccination by Age 80
Group (4/12/21 data) 70
70.8 70
60.8 61.4
60
70.5% people aged 65 or older
(1.24M) have received one or more 50
doses of vaccine 50
61.4% people aged 65 or older have 40
completed their vaccine series 34
30.6
29.1
30
21.1
20 18.1
15.6
13.5
10.1
10
2.9
0
16-19 20-29 30-39 40-49 50-64 65-74 75+
Initiation Completion
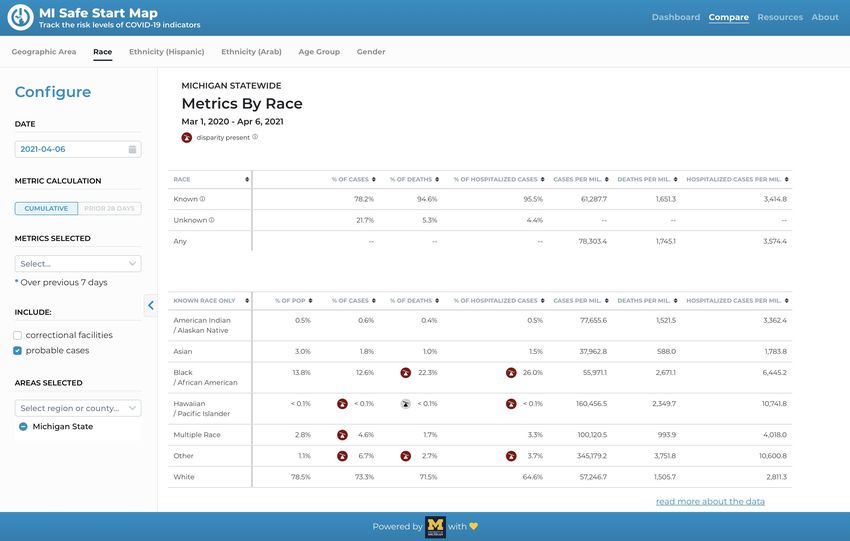
Source: Michigan Coronavirus Dashboard https://www.michigan.gov/coronavirus/0,9753,7-406-98178_103214-547150--,00.htmlCoverage by Race: State Level data 4/12/21
16 and older 65 and older
• Coverage was highest among those of NH (Non-Hispanic) White Race (31.2%), then NH Asian, Native Hawaiian or Pacific Islander Race (30.8), NH American
Indian (27.8%), NH Black or African American (19.2%) Races, and Hispanic (18.3%) ethnicity
• Initial Coverage disparities are seen in 65+ age group showed the same disparity, but the differences between Non-Hispanic White individuals (47.6%) and
Non-Hispanic Black or Hispanic individuals (37.1% and 37.7%) were smaller.
• 28.7% data missing or unknown
Source: Michigan Coronavirus Dashboard https://www.michigan.gov/coronavirus/0,9753,7-406-98178_103214-547150--,00.htmlComparing Vaccine Coverage and Case Rate Trends (Dec 19 – Apr 3)
Solid lines – case rates per million (7-day rolling average)
Dashed lines – vaccine coverage (%)
900 70.0%
800
60.0%
700
50.0%
600
500 40.0%
400 30.0%
300
20.0%
200
10.0%
100
0 0.0%
12/19 12/26 1/2 1/9 1/16 1/23 1/30 2/6 2/13 2/20 2/27 3/6 3/13 3/20 3/27 4/3
20-29 years 30-39 years 40-49 years 50-59 years 60-69 years 70-79 years 80+ years
Source: Michigan Disease Surveillance System (MDSS) and Immunization ProgramPotential COVID-19 Vaccination Breakthrough Cases
Process:
Michigan part of CDC’s nationwide investigation (CDC website forthcoming)
Weekly match COVID-19 cases to records of all fully vaccinated persons
Absence of a positive test less than 45 days prior to the post-vaccination positive test
Send data to CDC and, if available, gather respiratory specimens for whole genome sequencing
Michigan Data (1/1/21 through 4/6/21):
334 cases met criteria based on symptom onset or positive test 14 or more days after being fully vaccinated
Less than 1% of people who were fully vaccinated met this case definition
— Includes 4 deaths, all persons 65 years or older, three had prior PCR positive greater than 45 days prior
— 16 cases were hospitalized
Summary Points:
• Number of potential cases identified to date is not in excess of what might be expected with vaccines with 95% efficacy.
• Proportions of those symptomatic, hospitalized, and who died are all lower than those who are unvaccinated.
• Continue to encourage precautions while out in public, including wearing masks, washing hands and social distancing,
even after receiving the vaccine until more Michiganders have been able to be vaccinated.Household Infection Rate
(Secondary Attack Rate)
The % of housemates infected from a single person First Household
infection
• SARS-CoV-2: 16.6%
• Compare to SARS-CoV (2003) 7.5% and MERS 4.7%.
• New study of 55 Dutch households:
69% of households had additional infections and
43% of household members infected.
Madewell et al. JAMA Network Open. 2020;3(12):e2031756. doi:10.1001/jamanetworkopen.2020.31756
Reukers et al., Clinical Infectious Diseases, 2021;, ciab237, https://doi.org/10.1093/cid/ciab237COVID-19
vaccines: an
unprecedented
leap in vaccine
development
and rollout
Source: Our World in Data
Initial studies of
mRNA vaccines Human testing of RNA vaccines for
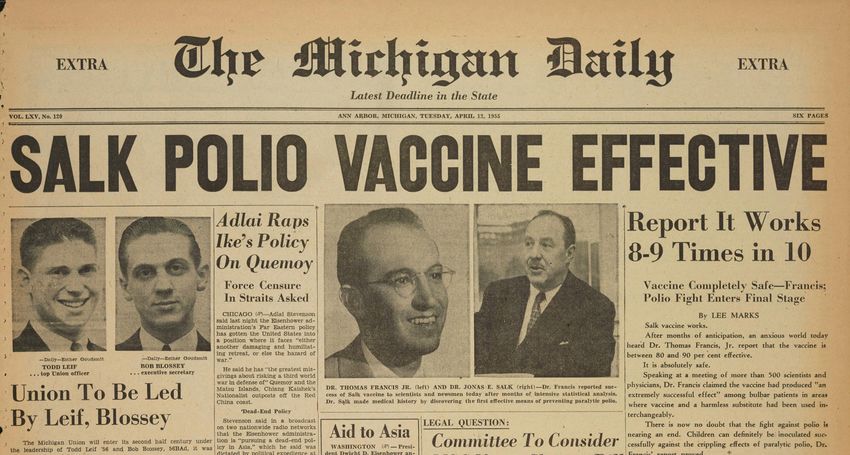
rabies, avian flu, Zika, & other virusesCOVID-19 vaccines represent an unprecedented
leap forward in vaccine development & rollout
• Rapid coverage
Michigan COVID vaccine increase in COVID
initiation and completion vaccine coverage
for 16+ (16+) compared to
1955 polio vaccine
rollout (MI Start Map updates: • Cases, deaths, and
hospitalized cases can
new disparities dashboard now be compared by:
• Race
• Ethnicity
• Age group
• Gender
• Disparity indicated if a
group has at least 33%
more cases, deaths, or
hospitalized cases than
expected based on
their proportion of the
population
• Mistartmap.info
Supported
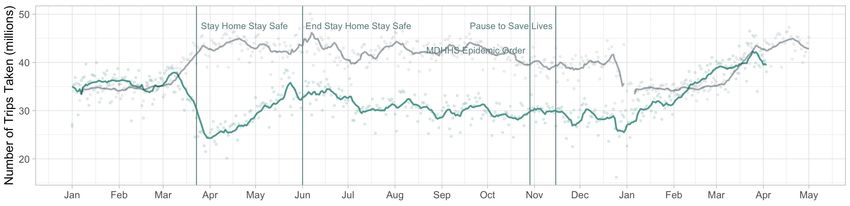
by MDHHSHow many people are staying at home in Michigan?
2020 - 2021
2019
• % Stay-at-home
levels have recently
declined to 2019
levels
• Number of trips
taken/day has
recently increased
to 2019 levels
• Most recent data is
4/3/21 (data as of
4/12/21)
Data Source: Bureau of
Transportation StatisticsChange in average mobility
Unacast mobility
patterns in MI
• Most recent data shows
a return toward
baseline mobility Change in non-essential visits
patterns, particularly
for non-essential visits
and average mobility.
• Encounter density has
stayed relatively low.
• Data through 4/8/21 Difference in encounter density
(data as of 4/12/21)
unacast social distancing
scoreboard
https://www.unacast.com/co
vid19/social-distancing-
scoreboardYou can also read