APPENDIX 2A REVIEW OF CURRENT CONDITIONS - DEMOGRAPHICS - jpspn
←
→
Page content transcription
If your browser does not render page correctly, please read the page content below
National Strategic Plan for Solid Waste Management                                       Volume 3

                                                                                 Appendix 2A

                                         APPENDIX 2A

                   REVIEW OF CURRENT CONDITIONS –
                           DEMOGRAPHICS

1.      Vision 2020, The Third Outline Perspective Plan (OPP3) and Eighth Malaysia
        Plan (RM-8)

        The National Vision Policy, Vision 2020, is a long-term plan aimed at developing the
        country into a “fully developed nation by the year 2020” in all dimensions:
        economically, politically, socially, spiritually, psychologically and culturally. The path
        to achieving this vision is through intensive and accelerated industrial development,
        an accelerated export-based manufacturing sector and service sector with emphasis
        on information technology.

        Whilst Vision 2020 provides the long-term goals, OPP3 (2001-2010) is an instalment
        plan of Vision 2020 and provides the framework for achieving certain socio-economic
        targets within a ten-year period. Its central objective is national unity - to be achieved
        by enhancing regional balance, diversifying economic base of the less developed
        States into manufacturing and services in the agriculture sector, and improving
        urban-rural linkages.

        RM-8 (2001-2005) identifies the growth strategies and directions for the next five
        years and confirmed the growth sectors of the economy, namely services and
        manufacturing. The trend of development in RM-8 is likely to reinforce concentration
        of industries and population in existing urbanised conurbations where the linkages
        and urban services and infrastructure already exist. For all areas, RM-8 has
        emphasised the need to enhance the quality of life and ensure that the principle of
        environmentally sustainable development is adhered to.

2.      Implication of the National Plans on Urbanisation

        Pegged on industrialisation, the three National Plans will have an immediate
        consequence on urbanisation and the development of urban areas, in particular the
        existing urban conurbations. Inevitably, the urban sector will continue to be the
        engine for economic growth and the dynamics for social change. To play that role
        effectively, the growing urban areas must be ensured of the necessary infrastructure
        and services, the required support administration and the appropriate policies. In the
        expedient pursuit of industrialisation and economic growth, there is a potential
        danger of making sacrifices that may become permanent detractions to Malaysian
        urban centres. One of these detractions could be a compounded solid (including
        industrial) waste problem. Therefore, it is incumbent to take steps to maintain a
        liveable urban environment. Proper and effective solid waste management that is in
        accordance with the best principles of public health, economics, engineering,
        conservation, aesthetics and environmental considerations must be given priority.

                                                Page 1 of 19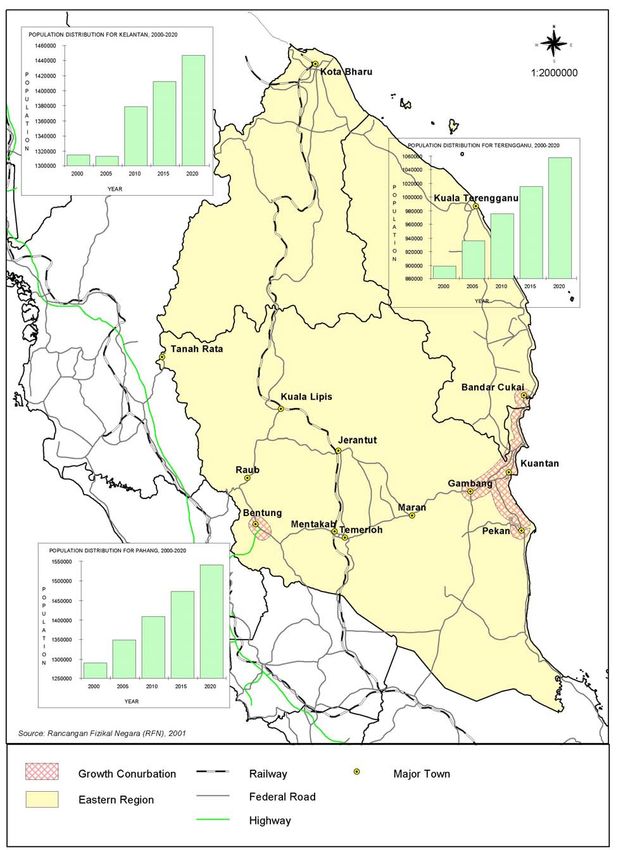
National Strategic Plan for Solid Waste Management                                          Volume 3

                                                                                    Appendix 2A

3.         Rancangan Fizikal Negara (RFN)

           Whilst the National Plans set the strategy and targets for national development, there
           is, however, little discussion on geographical location or physical planning to
           accommodate the distribution of industrial development and future population.
           However, RM-8 has identified the Rancangan Fizikal Negara (RFN) as the tool to
           provide the necessary physical planning and management direction1, firstly, by
           translating the various aspects of the national vision, strategies and targets into
           spatial or physical form and secondly, by anticipating the impact of the National Plans
           on urban development, the pattern of settlements, and the provision of infrastructure,
           utilities and services.

4.         Planning Framework

           i.      Hierarchy of Urban Centres

           There is a need to understand the urbanisation trend in the country to anticipate the
           implications of urban growth on waste generation, the spatial distribution of such
           generation, land required to accommodate the facilities necessary to manage solid
           waste, and the distribution and location of future waste management facilities.
           Appropriate location of waste management facilities is particularly important, firstly, to
           reduce or minimise the impact on water catchment areas for dams and water intakes,
           environmentally sensitive areas for life support system and residential areas, and
           secondly, to ensure optimum coverage of service areas.

           The Federal Department of Town and Country Planning has a functional hierarchy of
           urban centres for Peninsular Malaysia (Table 1) designed to meet the needs for
           evaluating the adequacy of services and infrastructure and to provide the criteria to
           justify for improvement when such services and infrastructure are not in place or not
           adequate to the level of the centre. In the light of urban population increases and
           differences in the growth of urban centres over the past two decades, the urban
           hierarchy of 1989 was updated in 2000 taking into account only those centres with
           80,000 population and above (Table 1). In addition to population, the updated urban
           hierarchy also took into account other criteria that included: the centrality of the
           centres within their respective regions; the capacity of these centres to provide their
           regions with functional services, communications, business administration, higher
           levels of health and educational services; an emerging suburban or conurbation
           forming around these centres; and the ability of these centres to stimulate economic
           development of their regions.

1
    Eighth Malaysia Plan, page 154

                                                Page 2 of 19
National Strategic Plan for Solid Waste Management                                                            Volume 3

                                                                                                    Appendix 2A

                      Table 1: Updated National Functional Urban Hierarchy, 2000

                    Functional                                                                      Population
        Level                         Characteristics                Urban Centre
                    Hierarchy                                                                       (Year 2000)
              1      National             Metropolis              WP Kuala Lumpur                    1,379,310
                      Centre
              2      National             Metropolis                 Johor Bahru                       630,603
                     Regional                                        Georgetown                        180,573
                      Centre                                           Kuantan                         289,395
              3    State Centre         State capitals                   Ipoh                          574,041
                                                                      Shah Alam                        319,612
                                                                      Seremban                         290,999
                                                                 Kuala Terengganu                      255,109
                                                                     Kota Bahru                        252,714
                                                                       Alor Star                       186,524
                                                                       Melaka                          149,518
                                                                       Kangar                           54,390
              4     State Sub-          Urban (major                    Klang                          631,676
                      Centre               towns)                   Petaling Jaya                      438,084
                                                                    Subang Jaya                        423,338
                                                             Ampang Jaya (Ulu Langat)                  348,794
                                                                        Kajang                         207,322
                                                                       Taiping                         199,330
                                                                   Selayang Baru                       187,733
                                                                   Batu 9 Cheras                       177,521
                                                                   Sungai Petani                       174,609
                                                                   Bukit Mertajam                      165,422
                                                                        Kluang                         134,880
                                                              Ampang Jaya (Gombak)                     126,459
                                                                      Batu Pahat                       123,237
                                                                        Kulim                          117,454
                                                             Sungai Ara (Pulau Pinang)                 112293
                                                                         Muar                          102,273
                                                                     Butterworth                        99,227
                                                                       Gelugor                          98,748
                                                              Ayer Itam (Pulau Pinang)                  95,895
                                                                       Sekudai                          90,405
                                                                    Pasir Gudang                        89,317
        Source: Table B4.3, Package B, Chapter 4, Rancangan Fizikal Negara, JPBD, 2001
                  (Extrapolated from the Preliminary Population Count Report for Rural and Urban Areas, Census 2000)

        ii.       Special Feature Towns

        In addition to the existing urban centres, there are other towns that are economically
        significant, even though they do not have the 80,000 population cut-off point used to
        classify as area as “urban”. Though these towns are not listed in the Federal Town
        and Country Planning Department’s updated functional hierarchy of urban centres,
        nonetheless, they are considered in the current solid waste study due to their
        inherent or potential national significance and the fact that they might be future
        engines of economic growth to the regions where they are located. These towns
        include:

                                                     Page 3 of 19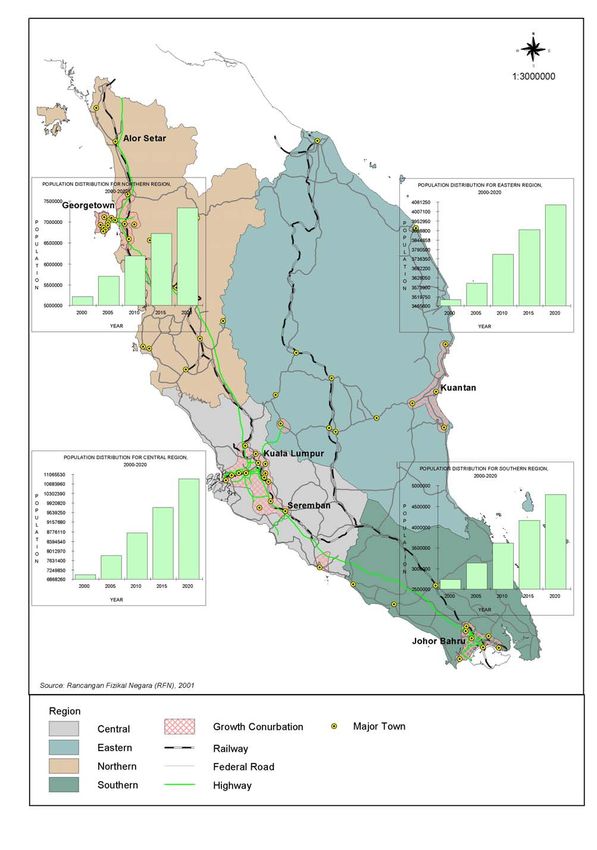
National Strategic Plan for Solid Waste Management                                    Volume 3

                                                                               Appendix 2A

        a)       Border Towns

        Though not industrial in nature, the border towns, namely, Bukit Kayu Hitam, Padang
        Besar and Rantau Panjang may be the locations of future international economic
        projects. These towns, located at the border with Thailand - a member of the
        Indonesia-Malaysia-Thailand Growth Triangle – could potentially become
        economically significant once some of the following projects take off: the gas pipeline
        project linking Southern Thailand to Malaysia, the Common Border Wholesale
        Markets in Kedah and Perlis, the landbridge, telecommunications, tourism, hinterland
        development and human resource development projects.

        b)       Tourism Towns

        Other towns like Port Dickson, Mersing, Kemaman, Kuah, Tanah Rata and Fraser’s
        Hill are tourist-dependent and whose environmental degradation might jeopardise
        their special appeal.

        c)       Special Industry Towns

        Special industry towns include Kerteh (oil industry), Cyberjaya (knowledge-based
        industry), and other towns currently being planned by the various State
        Governments, for example, Proton City (motor industry) in Selangor, though nascent
        in their development, will eventually grow, expand and fulfil a specific national role
        and objective.

        d)       Future Transport/Communication Nodes

        Future communications and transports nodes that include Temerloh-Mentakab,
        Kuala Lipis and Gua Musang will attain their economic and functional importance and
        population size once the new transportation developments are in place.

        e)       Special National Interest Centres

        Putrajaya and Cyberjaya form a group of potentially important urban centres that are
        assigned special roles in the nation’s development. When fully developed, these
        national interest urban centres will have an increasingly crucial role and position in
        the future hierarchy of urban centres.

5.      Regional Hierarchies

        To minimise duplication of infrastructure and services as well as to ensure optimum
        service coverage, the Draft RFN has divided the Peninsular Malaysia into four (4)
        regions.
        i.       Central Region comprising Selangor, Negeri Sembilan and Melaka;
        ii.      Northern Region comprising Pulau Pinang, Kedah, Perlis and Perak;
        iii.     Southern Region covering Johor
        iv.      Eastern Region comprising Pahang, Terengganu and Kelantan.

                                                Page 4 of 19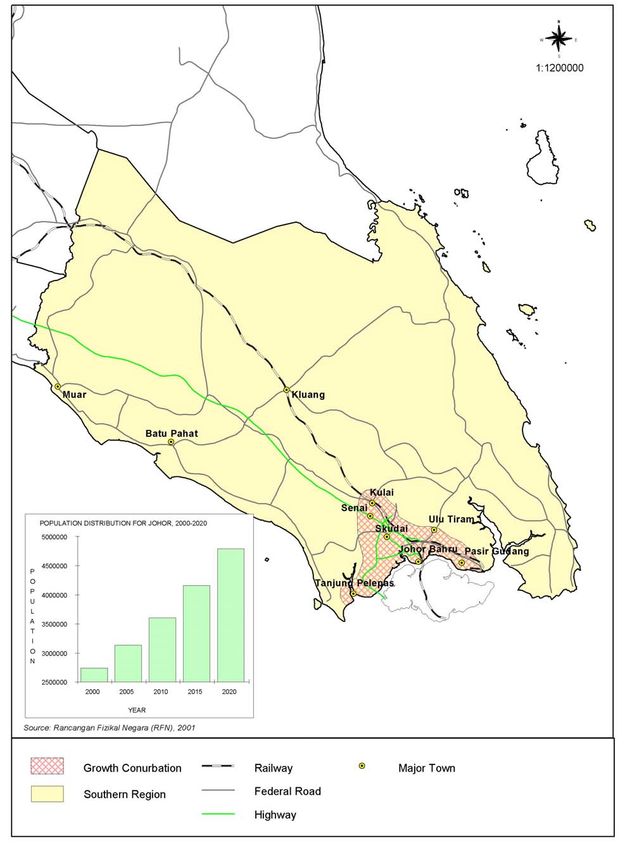
National Strategic Plan for Solid Waste Management                                                  Volume 3

                                                                                           Appendix 2A

        The population distribution in each of these regions is shown in Figure 1 to Figure 4
        and the comparative population distribution in Peninsular Malaysia is shown in
        Figure 5. Regionalisation of basic urban services may overcome problems related to
        inadequacies in forward planning, poor administration and management, and lapses
        in pollution control currently faced by some Local Authorities in the dispensation of
        these services.

6       Urbanisation Trend

        Urbanisation rate is a measure of the population that resides in “urban areas” 2 as
        opposed to rural areas. The urbanisation rate of the regions, States and major urban
        centres is shown in Tables 2, 3 and 4 respectively.

        Peninsular Malaysia experienced rapid urbanisation over the past decades whereby
        the proportion of people staying in urban areas increased from 28.7% in 1970 to 65%
        in 2000. The trend favoured urbanisation along the west coast as opposed to regions
        along the east coast and the northern border states. The fastest growing urban
        centres were those clustering around the main urban centres of WP Kuala Lumpur,
        Petaling Jaya-Subang Jaya-Klang, Penang and Johor Bahru. By 2000, the urban
        conurbation of these four major urban centres accounted for at least 64% of the
        Peninsular Malaysia’s urban population.

                          Table 2: Urbanisation Rate by Regions, 1970 – 2000

                                                               Urbanisation Rate
                     Region
                                                1970            1980            1991           2000
        Central                                  35.2           50.6            72.3            84.8
        Southern                                 28.0           35.2            45.0            63.9
        Northern                                 27.8           30.0            51.4            56.9
        Eastern                                  19.4           31.0            35.2            40.7
        Source: Department of Statistics, Preliminary Count Report for Rural and Urban Areas
                Census 1970, 1980, 1991, 2000

2
  An urban area, as defined by the Department of Statistics, is an area of 10,000 population or more or a
contiguous built-up area located at the periphery of established town boundaries, where at least 60% of the
related population base are engaged in non-agricultural activities and at least 30% of their housing units are
equipped with modern toilet facilities.

                                                 Page 5 of 19
National Strategic Plan for Solid Waste Management Volume 3
Appendix 2A
Table 3 : Urbanisation Rate by States, 1970 – 2000
Urbanisation Rate
State AAGR%
1970 1980 1991 2000
1991-2000
WP Kuala Lumpur 100.0 100.0 100.0 100.0 1.4
Selangor 26.2 34.2 75.2 88.3 7.8
Pulau Pinang 51.0 47.5 75.0 79.5 2.2
Melaka 25.1 23.4 38.7 67.3 8.1
Johor 26.3 35.2 47.8 63.9 5.6
Perak 27.5 32.2 53.6 59.5 2.0
Negeri Sembilan 21.6 32.6 42.0 55.0 5.0
Terengganu 27.0 42.9 44.5 49.4 2.7
Pahang 19.0 26.1 30.4 42.1 5.5
Kedah 12.6 14.4 32.5 38.7 4.0
Perlis 0.0 8.9 26.6 33.8 3.5
Kelantan 15.1 28.1 33.5 33.5 1.0
Peninsular
28.7 37.2 54.3 65.2 4.6
Malaysia
Source: Department of Statistics, Preliminary Count Report for Rural and Urban Areas
Census 1970, 1980, 1991, 2000
Urbanisation rate = Percentage of population living in urban areas
AAGR = Average Annual Growth Rate
Page 6 of 19National Strategic Plan for Solid Waste Management Volume 3
Appendix 2A
Table 4: Population of Growing Urban Centres, 1991 – 2000
Population
% Growth Ranking Most
Urban Centre
1991 2000 Rapid Growth
Subang Jaya 79,002 423,338 435.9 1
Sekudai 19,556 93,405 337.6 2
Batu 9 Cheras 50,952 177,521 248.0 3
Pasir Gudang 28,161 89,317 217.2 4
Kulim 52,328 117,454 124.5 5
Kajang 100,497 207,322 106.3 6
Shah Alam 158,439 319,612 103.0 7
Gelugor 54,880 98,748 80.0 8
Ampang Jaya (Ulu Langat) 195,160 348,794 78.7 9
Klang 368,379 631,676 71.5 10
Sungai Ara 68,190 112,293 64.7 11
Seremban 193,237 290,999 50.6 12
Sungai Petani 116,977 174,609 49.3 13
Batu Pahat 84,100 123,237 46.5 14
Muar 70,434 102,273 45.2 15
Kuantan 202,445 289,395 42.9 16
Johor Bahru 441,703 630,603 42.8 17
Selayang Baru 134,197 187,733 39.9 18
Kluang 98,669 134,880 36.7 19
Bukit Mertajam 121,992 165,422 35.6 20
Ampang Jaya (Gombak) 95,292 126,459 32.7 21
Melaka 113,752 149,518 31.4 22
Petaling Jaya 350,995 438,084 24.8 23
Ipoh 468,841 574,041 22.4 24
Ayer Itam 79,410 95,895 20.8 25
WP Kuala Lumpur 1,145,342 1,379,310 20.4 26
Alor Setar 164,444 186,524 13.4 27
Kuala Terengganu 228,119 255,109 11.9 28
Kangar 48,638 54,390 11.4 29
Kota Bahru 234,581 252,714 7.7 30
Butterworth 93,906 99,227 5.7 31
Taiping 200,324 199,330 -0.5 32
Pulau Pinang (Georgetown) 219,603 180,573 -17.8 33
Source: Dept of Statistics, Preliminary Count Report for Rural and Urban Areas Census 1991,
2000
Page 7 of 19National Strategic Plan for Solid Waste Management Volume 3
Appendix 2A
Figure 1: Population Distribution for Central Region, 2000-2020
Page 8 of 19National Strategic Plan for Solid Waste Management Volume 3
Appendix 2A
Figure 2: Population Distribution for Southern Region, 2000-2020
Page 9 of 19National Strategic Plan for Solid Waste Management Volume 3
Appendix 2A
Figure 3: Population Distribution for Northern Region, 2000-2020
Page 10 of 19National Strategic Plan for Solid Waste Management Volume 3
Appendix 2A
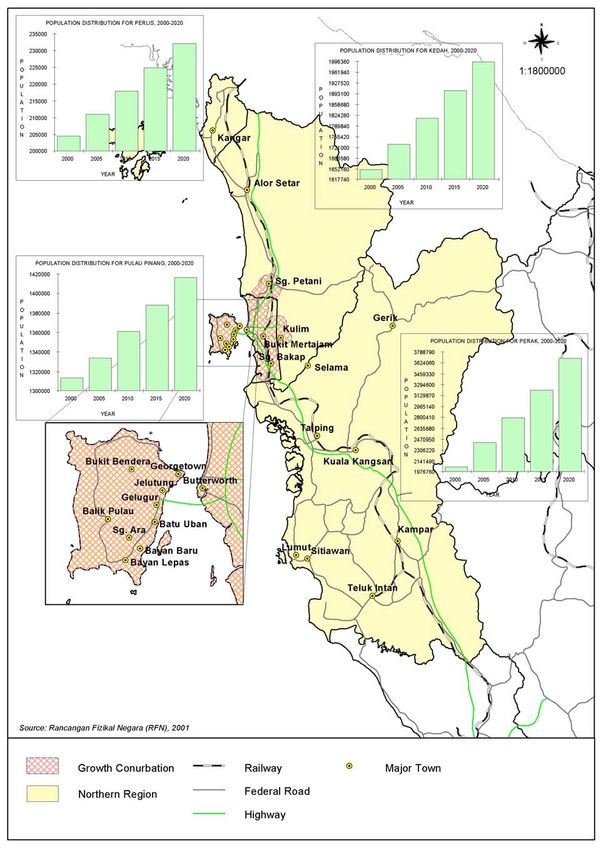
Figure 4: Population Distribution for Eastern Region, 2000-2020
Page 11 of 19National Strategic Plan for Solid Waste Management Volume 3
Appendix 2A
Figure 5: Population Distribution by Regions, 2000-2020
Page 12 of 19National Strategic Plan for Solid Waste Management Volume 3
Appendix 2A
i. Central Region
Benchmarked with the EU countries and Japan where the urbanisation rate ranges
between 80% to 95%, WP Kuala Lumpur and Selangor and the Central Region in
general are deemed fully urbanised or “developed” based on the Year 2000 Census.
The Central Region has an urban conurbation centred on WP Kuala Lumpur, and
stretches from Rawang in the north to Port Klang in the west and Seremban in the
south. Refer to Figure 1. Its “developed” status is attributed to the tremendous
growth of Subang Jaya, Shah Alam, Klang, Kajang and Cheras from 1991 – 2000.
Other smaller urban centres within the Central Region also indicated remarkable
urban growth that far exceeded both the national average urban population growth
rate as well as the growth rate of the major urban centres. Rawang increased its
population from 24,000 in 1991 to 65,000 in 2000 (170% increase within one inter-
censal period); Nilai grew from 2,000 in 1991 to 30,000 and Belakong in Ulu Langat
from less than 5,000 to 50,000 within one inter-censal period.
Census 2000 indicates that the Central Region has a population of 6,694,600, of
which 1,305,800 reside in WP Kuala Lumpur, 3,952,800 in Selangor and the balance
in Melaka and Negeri Sembilan. According to the Draft National Spatial Plan, the WP
Kuala Lumpur conurbation has an urban population of at least 4.8 million people by
Year 2000, which represents about 26% of the population in Peninsular Malaysia or
40% of the total urban population. If the urban population of Melaka and the minor
urban centres of Selangor and Negeri Sembilan are included in the conurbation, the
estimated urban population for the Central Region for Year 2000 is close to 5.9
million.
ii. Southern Region
The Southern Region, dominated by Johor, shows an intermediate stage of
urbanisation. Much of its urban growth over the past decade was contributed by
tremendous growth in the Local Authority areas of Johor Bahru, Pasir Gudang,
Sekudai, Muar, Batu Pahat and Kluang. Refer to Figure 2. Further, according to
Census 2000, other “minor towns” such as Senai, Ulu Tiram and Kulai have grown
significantly since 1991. During one inter-censal period Senai grew from 18,000 to
45,000 from 1991-2000, Ulu Tiram from 22,000 to 50,000 and Kulai from 30,000 to
50,000.
Total population in Johor is 2,584,900 according to Census 2000. Using base data
from the Department of Statistics, the Draft National Spatial Plan in May 2002
estimated that the Johor Bahru conurbation, spanning an area from Tanjung Pelepas
in the west to Kulai in the north and Pasir Gudang in the east, has an urban
population of at least 1 million people. In fact, the total urban population for the
Southern Region in Year 2000 could be as high as 1.65 million if the urban
population of the other urban centres and towns, like Batu Pahat, Muar, Segamat
and Kluang are included in the conurbation.
iii. Northern Region
Despite dramatic urban growth in Pulau Pinang over the past two decades especially
in the suburbs of Georgetown, the urbanisation rate of 57% in Northern Region is
clearly affected by the relative low urbanisation of Kedah and Perlis. The fact that
Page 13 of 19National Strategic Plan for Solid Waste Management Volume 3
Appendix 2A
both Georgetown and Butterworth, the traditional urban growth centres of the
Northern Region, have exhausted their developable land and are no longer able to
support or accommodate any population increase without undergoing extensive
urban renewal and redevelopment.
The Northern Region has a population of 4,973,942 according to Census 2000.
With Pulau Pinang (Georgetown and Butterworth) as the centre, the Northern Region
urban conurbation stretches from Sg. Petani in the north to Kulim in the east and Sg.
Bakap in the south. Refer to Figure 3. With reference to Census 2000 figures, the
Draft National Spatial Plan estimates that the Northern Region urban conurbation has
a population of at least 1.2 million or 23% of the region’s total population. However,
the total urban population can be as high as 2.9 million or 56% of the region’s
population if other urban centres like Alor Star, Ipoh and Taiping and minor urban
centres and towns within the region are included.
iv. Eastern Region
The Eastern Region is still distinctly agricultural in nature, but with an emerging
industrial base developing around Kuantan. The Kuantan conurbation stretching from
Cukai in the north to Gambang in the west and Pekan in the south, has an urban
population of about 350,000 or about 10% of the region’s population of 3,500,215,
according to the Draft National Spatial Plan. Refer to Figure 4. In contrast, Kota
Bahru, Kuala Terengganu and other intermediate towns in the Region generally
registered growth rates that were lower than the national average rate of natural
increase. Unless these towns increase their economic efficiency, their population will
continue to decline in favour of other Regions.
7. Existing Population Distribution and Rural-urban Split
Based on Census 2000, the population for the States within Peninsular Malaysia over
the last two inter-censal periods is shown in Table 5 and the rural-urban split shown
in Table 6.
Page 14 of 19National Strategic Plan for Solid Waste Management Volume 3
Appendix 2A
Table 5: Distribution of Population (Number & Percentage) and Average Annual
Growth Rate (%) by State, 1980, 1991 and 2000
Percentage
Population Size AAGR (%)
Distribution (%)
State
1980- 1991-
1980 1991 2000 1980 1991 2000
1991 2000
Johor 1,638,229 2,162,357 2,584,997 14.3 14.6 14.8 2.5 2.6
Kedah 1,116,140 1,364,504 1,571,077 9.8 9.2 8.9 1.8 2.1
Kelantan 893,753 1,207,684 1,287,367 7.8 8.2 7.1 2.8 0.9
Melaka 464,754 529,199 605,239 4.1 3.6 3.4 1.2 2.0
Negeri Sembilan 573,578 722,017 829,774 5.0 4.9 4.6 2.1 1.9
Pahang 798,782 1,081,148 1,229,104 7.0 7.3 7.0 2.8 1.9
Perak 1,805,198 1,974,893 1,973,368 15.8 13.3 11.1 0.8 0.4
Perlis 148,276 190,182 198,288 1.3 1.3 1.1 2.3 0.8
Pulau Pinang 954,638 1,116,801 1,231,209 8.4 7.5 7.1 1.4 1.8
Selangor 1,515,537 2,413,567 3,945,594 13.3 16.3 22.6 4.3 6.1
Terengganu 540,626 808,556 880,234 4.7 5.5 4.9 3.7 1.2
WP Kuala 977,102 1,226,708 1,305,792 8.6 8.3 7.4 2.1 1.3
Lumpur
WP Putrajaya - - 7,223 - - - - -
Peninsular
11,426,613 14,797,616 17,649,266 100.0 100.0 100.0 2.4 2.5
Malaysia
Source: Department of Statistics, Census 1980, 1991 and 2000
Note: Average Annual Growth Rate
Page 15 of 19National Strategic Plan for Solid Waste Management Volume 3
Appendix 2A
Table 6: Rural and Urban Split by States, 2000
Number Percentage
State
Urban Rural Total Urban Rural Total
Johor 1,751,260 833,737 2,584,997 67.8 32.2 100
Kedah 638,456 932,621 1,571,077 40.6 59.4 100
Kelantan 439,860 847,507 1,287,367 34.2 65.8 100
Melaka 427,887 177,352 605,239 70.7 29.3 100
Negeri Sembilan 472,958 356,816 829,774 57.0 43.0 100
Pahang 542,406 686,698 1,229,104 44.1 55.9 100
Perak 1,220,485 753,883 1,973,368 61.8 38.2 100
Perlis 69,104 129,184 198,288 34.9 65.1 100
Pulau Pinang 1,044,192 187,017 1,231,209 74.8 15.2 100
Selangor 3,707,155 238,439 3,945,594 94.0 6.0 100
Terengganu 444,020 436,214 880,234 50.4 49.6 100
WP Kuala 1,305,792 - 1,305,792 100 - 100
Lumpur
WP Putrajaya 7,223 - 7,223 100 - 100
Peninsular
12,070,798 5,578,468 17,649,266 68.4 31.6 100
Malaysia
Source: Department of Statistics, Census 2000
High average annual growth rates were registered for Selangor (6.1%) and Johor
(2.6%), which were significantly higher than the average of 2.5% for the Peninsular
Malaysia. Concomitantly these States including Melaka also showed significant
average annual urban growth rates ranging from 7.8% for Selangor, 5.6% for Johor
and 8.1% for Melaka, as compared to 4.6% for the Peninsular Malaysia. Much of the
growth, particularly in the urban areas of Selangor, Johor and Melaka, is attributed to
in-migration from the rural areas, compared to the laggard States such as Kelantan,
Perlis, Perak and Terengganu, which recorded much lower average annual growth
rates ranging from 0.4% to 1.2%.
Page 16 of 19National Strategic Plan for Solid Waste Management Volume 3
Appendix 2A
8. Population Projections
The population levels, and the scale of commercial, industrial and service sector
within a defined area or catchment largely determine the nature and volume of solid
waste generated, and the type and scope of facilities required to manage the waste.
There are a number of documents on current and future population projections and
their distribution over the Peninsular Malaysia. Population statistics that have been
documented and employed in various studies include:
(a) Department of Statistics (DOS) Population Projections, 2000 – 2020 (based
on 2000 Census);
(b) Population projections in Structure Plans (SP) reports prepared for Districts
and generally for Year 1995 – Year 2010/2020;
(c) Population projections in Local Plans (LP) reports prepared for Local
Authority areas and generally for Years 1995 – Year 2010/2020;
(d) Population projections undertaken for the National Water Resources Study
(NWR) prepared in 1999 for States, Districts and selected urban areas,
spanning 1991 – 2050 and based on 1999 Census information.
(e) Population projections undertaken for the study on the Viability of
Privatisation of Sewerage Services (PSS) prepared in 2000, spanning 1999 –
2035 and based on 1991 Census information; and
(f) Population projections prepared for the RFN in 2000, spanning 2000 – 2020
and based on 2000 Census.
The documented projections have been reviewed and compared. The projections
documented by SP, LP, NWR and PSS are based on 1991 Census information, and
their adoption is not recommended because:
(a) the estimates are based on 1991 Census;
(b) the estimates for WP Kuala Lumpur and Selangor are significantly under
enumerated compared to the 2000 Census figure;
(c) the estimates for Kelantan and Terengganu are significantly over enumerated
compared to the 2000 Census figure; and
(d) the impact and implication of special national interest centres like Putrajaya
and Cyberjaya and other mega-scale committed developments might not
have been factored in.
For the purpose of this study, the population projections for the period 2000 – 2020
prepared by DOS in 2002 are adopted as the basis for modelling waste generation in
the various States of the Peninsular. The reasons being as follow:
(a) the projections are current and based on 2000 Census;
(b) the projections have incorporated areas that were previously not regarded as
part of an urban area; and
(c) the projections have factored in changes to urbanisation and migration trends
and the pull factor and employment potential of existing and emerging urban
centres and their immediate conurbations.
Population projections prepared for the RFN were also referred to and comparisons
made with projections by DOS to take cognisance of the implication certain national
interest projects, e.g. Putrajaya and Cyberjaya, may have on the migration pattern,
the potential employment opportunities certain industrial projects might generate and
Page 17 of 19National Strategic Plan for Solid Waste Management Volume 3
Appendix 2A
the implication of the policies, strategies, objectives and growth targets of Vision
2020, OPP3 and RM-8 on future urbanisation trend.
9. Population Distribution by States
By Year 2020, the Department of Statistics (DOS) has estimated a projected
population of 27.68 million. The percentage increase in population levels varies from
State to State as shown in Table 7. Population levels in Johor, Negeri Sembilan and
WP Kuala Lumpur would grow between 50% - 100% over the plan period, whilst in
overall terms (both rural and urban), the east coast States of Kelantan, Terengganu,
and Pahang shall be comparatively much lower, registering growth rates of less than
1% per annum.
Table 7: Population Projection by State, 2000-2020
Population
State
2000 2005 2010 2015 2020
Perlis 198,300 211,100 245,600 270,800 298,600
Kedah 1,571,100 1,848,100 2,044,200 2,264,600 2,503,700
Pulau Pinang 1,231,200 1,468,800 1,609,900 1,750,900 1,889,200
Perak 1,973,400 2,256,400 2,440,900 2,653,700 2,882,600
Northern Region 4,974,000 5,784,400 6,340,600 6,730,000 7,574,100
Selangor 3,952,800 4,736,100 5,287,900 5,812,800 6,311,600
WP Kuala Lumpur 1,305,800 1,556,200 1,681,600 1,776,100 1,845,800
Negeri Sembilan 829,800 948,300 1,033,000 1,126,400 1,221,300
Melaka 605,200 713,000 786,200 865,900 948,700
Central Region 6,693,600 7,311,900 8,788,700 9,736,400 10,327,400
Johor 2,584,900 3,101,200 3,459,400 3,835,800 4,223,600
Southern Region 2,584,900 3,101,200 3,459,400 4,154,700 4,223,600
Pahang 1,229,100 1,427,000 1,574,300 1,740,000 1,915,800
Terengganu 880,200 1,016,500 1,148,500 1,015,900 1,482,800
Kelantan 1,287,400 1,505,600 1,678,000 1,894,200 2,158,800
Eastern Region 3,396,700 3,949,100 4,400,800 3,902,100 5,557,400
Peninsular Malaysia 17,649,200 20,146,600 22,989,500 24,523,200 27,682,500
Source: Projections prepared by Department of Statistics, 2002
Page 18 of 19National Strategic Plan for Solid Waste Management Volume 3
Appendix 2A
10. Projected Rural-Urban Split
The estimated rural-urban split is based on the Department of Statistics’ definition of
“urban area” as encompassing “contiguous built-up areas located at the periphery of
established town boundaries, where at least 60% of the related population base are
engaged in non-agricultural activities and at least 30% of their housing units are
equipped with modern toilets facilities”. The urban-based population according to
Census 2000 was 12,070,798 and represents 68.4% of the total population in the
Peninsular Malaysia.
Meanwhile, RM-8 has estimated that urbanisation would increase to 69.7% by the
end of the Plan period (Year 2005) and the urban population to grow at a slower rate
of 3.8% per annum during that period. The more developed States are expected to
attract more people to the urban centres due to acceleration in economic activities,
greater job opportunities and a better quality of life. Among the more developed
States, Selangor is expected to record the highest urban growth at 5% per annum
followed by Johor at 3.8% per annum.
Using employment-based population distribution up to 2020 prepared by the RFN in
May 2002, the projected urban/rural population or split for 2020 was determined at
73.5% to 26.5%. Table 8 tabulate the percentages of urban population every five
years from years 2000 to 2020.
Table 8: Projected Level of Urbanisation, 2000 – 2020
2000 (a) 2005 (b) 2010 (c) 2015 (c) 2020 (d)
State (% Urban (% Urban (% Urban (% Urban (% Urban
Population) Population) Population) Population) Population)
Kedah 40.6 43.3 45.2 47.3 49.6
Perak 61.8 65.3 69.6 74.6 80.0
Perlis 34.9 38.9 39.4 40.0 40.7
Pulau Pinang 74.8 83.3 85.2 87.2 89.1
Northern Region 59.7 61.9 65.6 68.6 71.7
Melaka 70.7 75.3 74.8 74.4 74.3
N.Sembilan 57.0 58.2 62.3 63.2 61.0
Selangor 93.8 92.7 93.2 93.7 94.2
WP Kuala Lumpur 100.0 100.0 100.0 100.0 100.0
Central Region 88.4 88.0 89.1 89.4 89.7
Kelantan 34.2 36.7 36.6 36.5 36.4
Pahang 44.1 44.0 42.8 41.5 40.1
Terengganu 50.4 50.1 50.3 50.6 50.9
Johor 67.8 69.1 68.8 68.6 68.3
Southern Region 67.8 69.1 68.8 68.6 68.3
Eastern Region 42.0 42.9 42.4 42.0 41.5
P. Malaysia 68.4 69.7 71.0 71.7 73.5
Notes: (a) 2000 Census, Preliminary Count Report for Urban and Rural Areas
(b) RM-8 Estimates
(c) Projections derived by Study Team, 2002.
(d) Projections prepared by Department of Statistics, 2002.
Page 19 of 19You can also read