MI COVID response Data and modeling update February 2, 2021 - NOTE: all data as of Jan 30 unless otherwise noted - State of ...
←
→
Page content transcription
If your browser does not render page correctly, please read the page content below

MI COVID response
Data and modeling update
February 2, 2021

NOTE: all data as of Jan 30 unless otherwise noted
Executive summary
Michigan has the 22nd highest number of cases (↑1) , 18th highest number of deaths (↓4), 47th highest case rate
(↑2), and T39th highest death rate (↓10) in the last 7 days (source: CDC COVID Data Tracker)

Michigan has the 37th highest hospitalization rate as a percent of total beds (↓2), and 16th highest number of
COVID patients in the ICU (↑1) (source: Becker’s Hospital Review)

Case rates (181.8, ↓21.2) and percent positivity (5.7%, ↓0.5%) are declining for 20 or more days

7.3% of available inpatient beds are filled with COVID patients (↓1.9%) and state trends for COVID hospitalizations
are decreasing

There were 373 deaths (↓60) between Jan 17 and Jan 23, and death rate is 5.4 deaths per million residents (↓0.8)

Daily diagnostic tests increased to an average of 41.2K per day (↑0.1K) over the last week and the state testing rate
is 3,780.0 tests/million/day (↑126.6)

1,001,873 COVID-19 vaccine doses reported to MDHHS, 9.8% of population has had at least one dose

Science updates on COVID-19 in schools, and sporting events, as well as new B.1.1.7 findings, and mobility data in
Michigan

                                                                                                                        2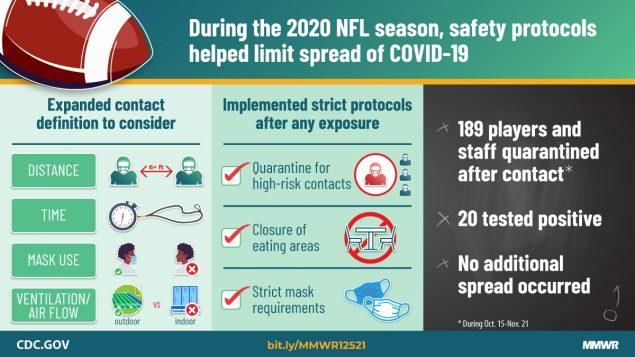
Comparison across states: Summary 2/1/21
What we see today:
• 2 states (LA, PA) seeing increasing 1 week case trends (up vs. 1 last week)
• 43 states (down vs. 44) with significant outbreaks (high/increasing cases, increasing/high
  positivity increasing/high hospitalizations over 2 weeks (>100 per M))
• Arizona (504/M), Georgia, New York, Nevada, California have highest per capita
  hospitalized patient numbers
• Midwest:
   –   Wisconsin showing slight drop in hospitalizations (117/M) and drop in cases (264/M)
   –   Indiana with moderate decline in hospitalizations (235/M), and sharp drop in cases (332/M)
   –   Illinois showing slow decline in hospitalizations (195/M), cases dropping (276/M)
   –   Ohio with declining hospitalizations (209/M) and stable cases (385/M)
   –   Michigan showing continued decline in hospitalizations (125/M) and slight decline in cases (192/M)

                                                                                                            3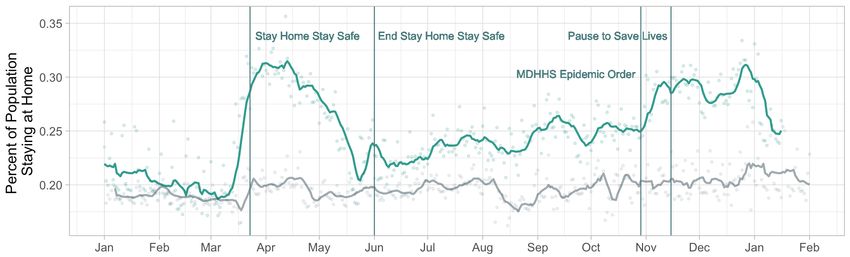
COVID-19 Spread
Statewide positivity has decreased to 5.7%, and is decreasing in all MERC regions
• Seven of eight MERC regions now below 7% (Risk Level A)
• One region, Upper Peninsula, is below 3% (Risk Level Low)
• Majority of counties (74) have positivity below 10%
Case rates have steadily declined to 181.8 cases per million (Risk Level E)
76% decrease from the mid-November peak
Declines are seen among most age groups, races, and ethnicities
In the past 30 days, approximately one of five cases have race and ethnicity missing
Variant is in Michigan: increased vigilance in use of masks and social distancing and increase testing
— 467 cases with the B.1.1.7 variant have been identified in the US, 25 in Michigan
Number of active outbreaks is up 2% from previous week
— Reported school outbreaks have increased since last week (54 to 86) with outbreaks increasing in all K-12 school
settings
Confirmed and probable case indicators                                             Risk levels
Table Date: 1/30/2021 (7 days from date table was produced: 1/23/2021)   Low   A   B       C     D   E

 Cases                                             Positivity
                                                                                                         5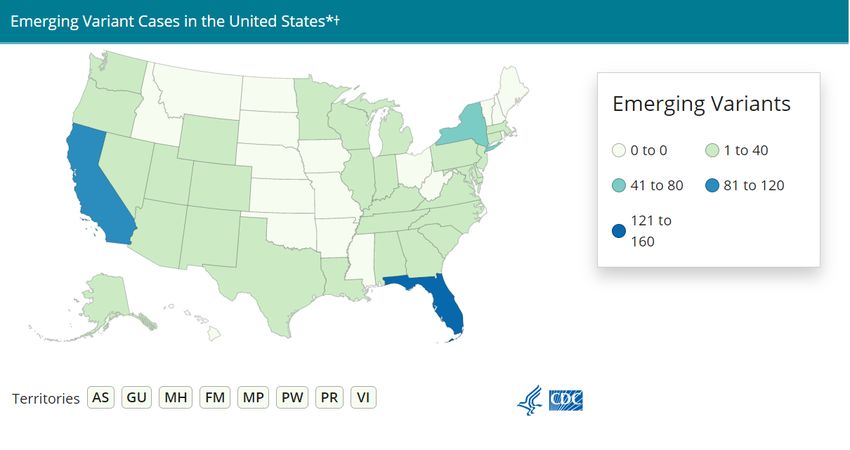
Recent statewide trends

     Statewide trends                                                                                                      Regional breakdown: Cases, hospitalization rate, and
                                                                                                                           positivity
                                             7-day average       Daily values                                                                             Positivity: 7-day average positivity, %
                                                                                                                                                          Cases: 7-day average cases per million
                            20.0%                                                                                                                         Hosp. rate: 7-day average hospitalization rate, %

                            15.0%

Positivity, %               10.0%

                                                                                                          Current: 5.7%                                                             Positivity: 2.5%
                             5.0%                                                                                                                                                   Cases: 162.2
                                                                                                                                                                                    Hosp. rate: 5.1%
                             0.0%
                                      11/2      11/16    11/30      12/14       12/28     1/11     1/25

                            1000

                             800
                                                                                                                            Positivity: 5.7%
                             600                                                                                            Cases: 162.4
Daily cases                                                                                                                 Hosp. rate: 4.6%
                             400
per million
                             200
                                                                                                          Current: 181.8               Positivity: 5.4%
                                                                                                                                                                                          Positivity: 6.1%
                                0                                                                                                      Cases: 187.3
                                                                                                                                                                                          Cases: 194.6
                                     11/2     11/16     11/30     12/14     12/28       1/11     1/25                                  Hosp. rate: 6.7%
                                                                                                                                                                                          Hosp. rate: 7.5%

                            20%                                                                                                      Positivity: 6.7%
                                                                                                                                     Cases: 223.7
                            15%
Daily                                                                                                                                Hosp. rate: 11.5%
                            10%                                                                                                                                                            Positivity: 5.5%
hospitalization                                                                                           Current: 7.3%                                                                    Cases: 166.4
                             5%                                                                                                    Positivity: 6.9%
rate, %                                                                                                                                                                                    Hosp. rate: 7.4%
                                                                                                                                   Cases: 217.3
                             0%
                                                                                                                                   Hosp. rate: 6.5%
                                  11/2        11/16     11/30     12/14     12/28       1/11     1/25                                                                                       Positivity: 8.0%
                                                                                                                                                                                            Cases: 251.1
                                                                                                                                                                                            Hosp. rate: 9.5%
  Source: https://mistartmap.info/
                                                                                                                                                                                                       6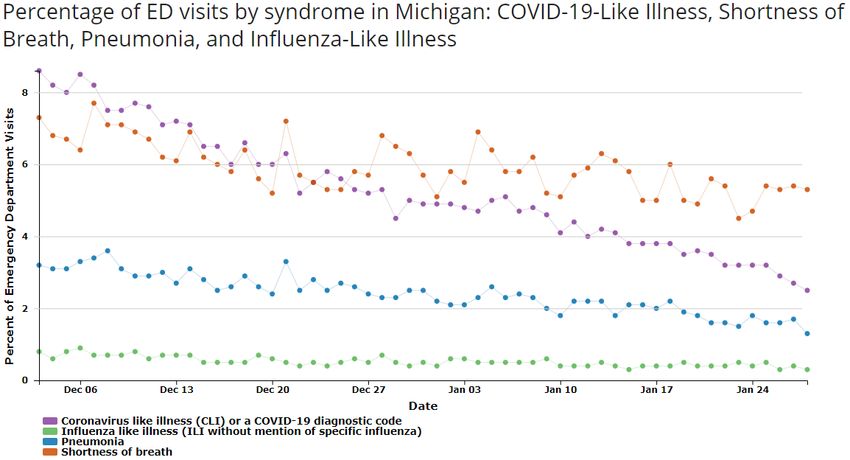
Positivity by county, 1/22-1/28
                                                 Average            # of counties
                                                 positivity per day
                                                                                          This week
                                                       =20%           0
                                                                       1

                                                 Updates since last week:
                                                 9 of 83 counties saw double digit positivity in
                                                 the last week (4 county decrease)

                                                                                                      7
 Source: SEOC Testing Results – Excluding MDOC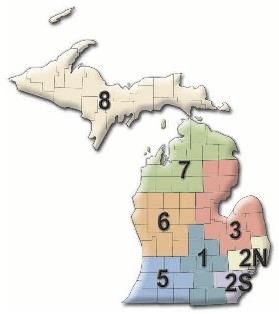
Age group: average new daily cases
Daily new confirmed and probable cases per million by age group (7-day rolling average)
1000
                                                                                                     0-29    50-69
 900
                                                                                                     30-49   70+
 800

 700

 600

 500

 400

 300

 200

 100

     0
         3/1               4/1                5/1                 6/1              7/1   8/1   9/1   10/1      11/1   12/1   1/1

    •     30-49 age group continues to have the highest cases per million
    •     All age groups are now decreasing
                                                                                                                                   8
Note: Case information sourced from MDHHS and reflects date of onset of symptoms
Source: MDHHS – Michigan Disease Surveillance System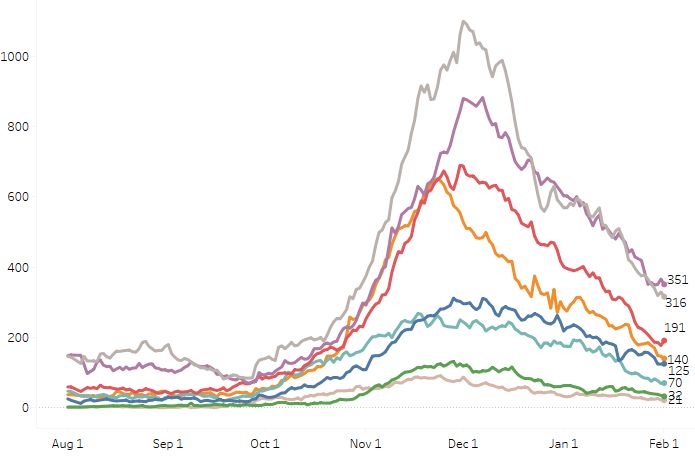
Average daily new cases per million people by race and ethnicity

        Daily new confirmed and probable cases per million                                                    Daily new confirmed and probable cases per
        (7 day rolling average) by race category                                                              million (7 day rolling average) by ethnicity category
                        American Indian/Alaska Native                     Black/African American                          Hispanic or Latino      Not Hispanic or Latino
                        Asian/Pacific Islander                            White
          600                                                                                                 600

          500                                                                                                 500

          400                                                                                                 400

          300                                                                                                 300

          200                                                                                                 200

          100                                                                                                 100

              0                                                                                                 0
                  3/1    4/1     5/1      6/1      7/1     8/1      9/1 10/1 11/1 12/1                  1/1         3/1   4/1   5/1   6/1   7/1   8/1   9/1 10/1 11/1 12/1   1/1
Updates since last week:
•     Cases per million are now decreasing for all racial groups, as well as both Hispanic/Latinos and non-Hispanic/Latinos
•     In the past 30 days, 26% of all cases represent unknown, multiple, or other races (17% of race is unknown)
•     In the past 30 days, 21% of all cases have an unknown ethnicity reported

                                                                                                                                                                                   9
Note: Case information sourced from MDHHS and reflects date of death of confirmed and probable cases.
Source: MDHHS – Michigan Disease Surveillance System
Identified US COVID-19 Cases Caused by
             All Variants of Concern      Top Five States Variant
                                                                                                                                                                          Count
                                                                                                                                 FL                                        147
                                                                                                                                 CA                                        113
                                                                                                                                 NY                                        42
                                                                                                                                 MI                                         25*
                                                                                                                                 GA                                          18

                                                                                                                                  32 states and territories have B.1.1.7
                                                                                                                                  1 state (MN) has P.1
                                                                                                                                  2 states (MD, SC) have B.1.351

Data last updated January 31, 2021. The cases identified are based on a sampling of SARS-CoV-2-positive specimens and do not
represent the total number of B.1.1.7, B.1.351, and P.1 lineage cases that may be circulating in the United States and may not   * Additional cases identified in MI after the CDC
match numbers reported by states, territories, tribes, and local officials.                                                      dashboard was published
Source: https://www.cdc.gov/coronavirus/2019-ncov/transmission/variant-cases.html
Michigan COVID-19 Variant and Response
Situation: 25 cases and counting Response
• 50% more transmissible = increased numbers • Increase identification: samples from hospital
of cases, hospitalizations, and deaths laboratories
• Slow spread of B 1.1.7 to allow for vaccination • Rapid case Investigation and consider
of vulnerable individuals inclusion of extra day before onset
• Identified in Michigan • Impacted area;
• 19 individuals in Washtenaw County • Public notification of impacted areas
• 6 individuals in Wayne County • Strictly enforce isolation and full 14-day
• Expect there are more quarantine
• Emphasize testing in affected areas
• Public Action: • Expand testing capacity in areas where the
• Masks (and face shields) variant has been detected.
• Social Distancing • Actively work to obtain testing for exposed
• Hand washing individuals, particularly those that are known to
• Get tested if traveled out of MI in last 14 days have been exposed to the variant strain.Recent trends: Positivity Recent trends: Case Rates
Washtenaw
County
All charts
Wayne represent
County data from
07/30/20 –
01/28/21
Detroit City
Source: MI Start Map; MDOC excluded 12Number of outbreak investigations by site type, week ending Jan 28
Easier to identify outbreak
Pre-decisional, for discussion only Draft Harder to identify outbreak
Site type Outbreaks by ongoing/new classification, # Visibility1 Total number of active
Ongoing New Total outbreaks is up 2% from
previous week
SNF/LTC/OTHER ASSISTED LIVING 347 43 390
MANUFACTURING, CONSTRUCTION 77 13 90
K-12 SCHOOL 55 31 86 Following LTCs, the greatest
*RETAIL 45 13 58 number of new outbreaks were
HEALTHCARE 45 10 55 reported in K-12 schools (31),
OFFICE SETTING 16 17 33 office setting (17),
CORRECTIONS 23 2 25 manufacturing/construction
*SOCIAL GATHERING 21 3 24 (13), retail (13), childcare (12),
C H I L D C A R E / Y O U T H P R O G R A M 12 12 24 and healthcare (10).
C O L L E G E / U N I V E R S I T Y 15 4 19
*RELIGIOUS SERVICES 15 2 17 LHDs reported new outbreaks
OTHER 14 3 17 in all settings
A G R I C U L T U R A L / F O O D P R O C E S S I N G 10 2 12
*SHELTERS 5 2 7
*RESTAURANTS AND BARS 3 3 6
*PERSONAL SERVICES 0 2 2
*COMMUNITY EXPOSURE - INDOOR 1 1 2
*COMMUNITY EXPOSURE - OUTDOOR 0 1 1
TOTAL 704 164 868
1. Based on a setting’s level of control and the extent of time patrons/residents spend in the particular setting, different settings have differing levels of ability to ascertain whether a case derived from that setting
NOTE: Many factors, including the lack of ability to conduct effective contact tracing in certain settings, may result in significant underreporting of outbreaks. This chart does not provide a complete picture of
outbreaks in Michigan and the absence of identified outbreaks in a particular setting in no way provides evidence that, in fact, that setting is not having outbreaks. 13
Source: LHD Weekly SitrepsK-12 school outbreaks, recent and ongoing, week ending Jan 28
Number of reported outbreaks increased since last week (54 to 86) including increases in High Schools (21 to 28), Middle/Jr High (8 to 14),
Pre K-Elementary (22 to 39), and Administrative (3 to 4).
Number of Range of cases
Region Number of reported cases, # # Ongoing - Excluding New # New outbreaks per outbreak
Region 1 58 22 20 2-13
Region 2n 14 0 4 2-7
Region 2s 24 10 6 2-16
Region 3 133 27 17 3-21
Region 5 19 14 8 2-13
Region 6 74 18 16 2-17
Region 7 13 17 11 2-11
Region 8 8 20 4 2-20
Total 343 128 86 2-21
Number of Range of cases
Grade level Number of reported cases, # # Ongoing - Excluding New # New outbreaks per outbreak
Pre-school - elem. 130 46 39 2-20
Jr. high/middle school 77 40 14 2-20
High school 128 37 29 2-21
Administrative 8 5 4 2-5
Total 343 128 86 2-21
Many factors, including the lack of ability to conduct effective contact tracing in certain settings, may result in significant underreporting of outbreaks. This chart does not provide a complete picture
of outbreaks in Michigan and the absence of identified outbreaks in a particular setting in no way provides evidence that, in fact, that setting is not having outbreaks.
Source: LHD Weekly Sitreps 14COVID-19 and Healthcare Capacity and COVID Severity Hospitalizations and ICU utilization are decreasing COVID-like illness (CLI) continues with downward trend and is below 3% Hospitalizations down 68% since December 1st peak ICU occupancy declined 15% over last week All regions at or below 15% of Adult ICU beds with patients positive for COVID Current deaths are a lagging indicator of cases, but the number of deaths have declined for six weeks 61% decrease from the peak on December 10 Decreases in deaths seen among most ages, races, and ethnicities
Michigan Trends in Emergency Department Visits for COVID-19-Like
Illness (CLI)

                                                                                              2.5%

                                            Source: https://covid.cdc.gov/covid-data-tracker/#ed-visits
Statewide Hospitalization Trends: Total COVID+ Census
This week, COVID+ census in hospitals is
Hospitalization Trends 7/1/2020 – 2/1/2021
Confirmed Positive & Persons Under Investigation (PUI)
down 18% from the previous week and
down 68% from the December 1 peak.
Hospitalized COVID Positive Long Term
Confirmed Positive Trend (beginning March 2020)
PUI
17Statewide Hospitalization Trends: Regional COVID+ Census
All regions are showing significant decreasing
Hospitalization Trends 8/1/2020 – 2/1/2021
Confirmed Positive by Region trends in COVID+ hospitalizations.
Region 1
Region 2N All regions are below 200 hospitalized per
Region 2S million of the population and 4/8 are below
Region 3
Region 5 100 per million.
Region 6
Region 7
Region 8 Region COVID+ COVID+
Hospitalizations (% Δ Hospitalizations
from last week) / MM
Region 1 125 (-17%) 116/M
Region 2N 316 (-16%) 143/M
Region 2S 351 (-16%) 158/M
Region 3 191 (-15%) 168/M
Region 5 70 (-20%) 73/M
Region 6 140 (-23%) 95/M
Region 7 32 (-30%) 64/M
Region 8 21 (-22%) 67/M
18Statewide Hospitalization Trends: ICU+ COVID Census
The census of COVID+ patients in ICUs have declined 15% over
the past week overall with nearly all regions showing declining
Hospitalization Trends 8/1/2020 – 2/1/2021 trend.
Confirmed Positive in ICUs
Region 5 showed a substantial increase percentage wise but the
absolute increase was 9 patients.
No regions have >15% of ICU beds occupied by COVID+ patients.
Region Adult COVID+ in Adult ICU % of Adult ICU
ICU (% Δ from Occupancy beds COVID+
last week)
Region 1 28 (-20%) 87% 15%
Region 2N 58 (-28%) 79% 10%
Region 2S 83 (-17%) 75% 11%
Confirmed Positive in ICU
Region 3 53 (-5%) 82% 15%
Region 5 22 (+69%) 86% 14%
Region 6 38 (-19%) 71% 11%
Region 7 27 (-16%) 67% 15%
Region 8 7 (-13%) 64% 12%
Hospital bed capacity updated as of 1/29
19Average and total new deaths, by age group
Daily confirmed and probable deaths per million by Total confirmed and probable deaths by age group
age group (7 day rolling average) (past 30 days, ending 1/23/2021)
0-19 40-49 70-79
20-29 50-59 80+ 1,086
175 30-39 60-69 Total
8% of deaths below age sixty
150
125
100 579
75
338
50
25 108
10 14 44
0 1-5
11/2 11/16 11/30 12/14 12/28 1/11 1/25 0-19 20-29 30-39 40-49 50-59 60-69 70-79 80+
Note: Death information sourced from MDHHS and reflects date of death of confirmed and probable cases.
Source: MDHHS – Michigan Disease Surveillance System 2030-day rolling average daily deaths per million people by race and
ethnicity
Average daily deaths per million people by race Average daily deaths per million people by
ethnicity
American Indian/Alaska Native Black/African American Hispanic or Latino Not Hispanic or Latino
16 Asian/Pacific Islander White 16
14 14
12 12
10 10
8 8
6 6
4 4
2 2
0 0
11/2 11/16 11/30 12/14 12/28 1/11 1/25 11/2 11/16 11/30 12/14 12/28 1/11 1/25
Updates since last week:
• Deaths are a lagging indicator of cases, and death rates are decreasing among racial and ethnic groups
• Whites and Non-Hispanic/Latino have the most reported deaths per capita
• Deaths are not adjusted for confounders (e.g., age, sex, comorbidities)
21
Note: Death information sourced from MDHHS and reflects date of death of confirmed and probable cases.
Source: MDHHS – Michigan Disease Surveillance SystemHow is public health capacity?
Testing volume is 47,200 tests (↑)
• 12.2% are antigen tests
• Testing by county ranges from 1,100 to 8,900 daily tests per million residents
Case investigations progress has plateaued
• Consistent number of cases interviewed, however, proportion completed has increased
• Consistent low proportion of cases interviewed with a source of known infection (indicating community acquisition)
• Consistent low proportion of those quarantining when their symptoms begin (indicating no effective halt in community
transmission)`
Daily diagnostic tests, by message date
Last 90 Days Tests By Test Type and Message Date Weekly Update
100,000 • 47,200 (↑) rolling 7-
90,000
day average daily
diagnostic tests
80,000
reported to MDHHS
70,000 (PCR + Ag)
60,000
• 41,212 average daily
PCR tests (16,788
50,000 short of 58,000 goal)
40,000 • 16.7% of counties
30,000
meeting testing
capacity threshold
20,000 (goal 100%)
10,000 • 12.2% are antigen
-
tests over the past
week (↓1.5%)
• 4.0% positivity in
Total Diagnostic Tests Total Antigen Tests 7 day moving average, diag. tests antigen tests (↓0.2%)
23
Source: MDSS/Michigan Medical Advantage Group, MDHHS, testing labsNew Case Investigation Metrics (Statewide)
New Communicable Disease metrics slightly increased since last week:
• 46% of investigated cases having a known source (42% last week, 43% week prior)
• 26% of investigated cases noting that they were quarantining before symptoms (26% last week)
01/16-01/22 Case report form information 01/23-01/29 Case report form information
Yes No Not answered
8,312 8,391
1,014 7,298 7,298 1,577
6,814 6,814
29%
43% 31% 23%
7,298
(88%) 6,814
45% (81%) 23% 51%
15%
42% 46%
26%
26%
Case investigation complete? Known source of infection? Already quarantining at time Case investigation complete? Known source of infection? Already quarantining at time
of symptom onset? of symptom onset?
24
Source: MDHHS – Michigan Disease Surveillance SystemCOVID-19 Vaccination - MI 16th in nation for doses administered per 100,000 people - 9.8% of Michiganders have first dose of vaccine (up from 7.8% last week and 5.4 two weeks ago) - More than 1 million doses reported to MDHHS - More than 200,000 people fully vaccinated - Of doses reported in the last week, 44% of all first doses have been administered to people aged 65 and older - LTC Federal Pharmacy Partnership: ➢ 100% of skilled nursing facilities have had first 1st dose clinic ➢ 81,336 residents and staff vaccinated ➢ Added another partner to effort (Managed Care Health Associates) ➢ Active recruiting of facilities who had been listed as opted out of the program underway.
Michigan COVID Vaccine Distribution &
        Administration as of 02/02/2021
                                                                  State Rank
      Total Distributed (Number)                                      10
      Distributed per 100K                                               37
      Total Administered (Number)                                         7
      Administered per 100K*                                             16
      People with One+ Doses (Number)                                     9

      People with One+ Doses per 100k                                    16
      People with Two Doses (Number)                                      7
      People with Two Doses per 100k                                     17

CDC Ranking Data for the 50 States as of Feb 2, 2021 at 1:55 pm *States with lower administration rank are: Alaska, West Virginia, New Mexico, North Dakota, Connecticut, South Dakota,
Doses Shipped and Administered
Enrolled Doses Total Doses Administered 1st Dose
Providers Shipped Coverage,
16+
Data as of 1/31/21 2/1/21 2/1/21 1st Dose 2nd Dose 2/1/21
Michigan Distributed 2,047 1,305,325 1,001,873 801,691 200,182 9.8%
Federal LTC Program 430,200
Total Distribution 1,737,325Vaccination by Age % of first dose
Group Age Category
People with One
or More Doses
People with Two
Doses
vaccine by
Age Group
16-19 years 4,033 1,059 0.4%
More than 363,000 people aged 65
years or older have received one or 20-29 years 70,313 30,830 6.9%
more doses of vaccine.
36% of all first doses have been 30-39 years 99,086 46,426 9.8%
administered to people aged 65 and
older 40-49 years 105,205 42,974 10.4%
50-64 years 171,769 66,678 16.9%
Of doses reported in the last week, 44% 65-74 years 190,968 17,475 18.6%
of all first doses have been
administered to people aged 65 and 75+ years 172,861 8,609 16.9%
older.Doses Administered Per Day (2/1/21)
2 days administering more than 50,000 doses/day administeredFederal Long-Term Care Facility (LTCF) Pharmacy Partnership Program
Data as of 1/24/21
• MHA added to
partnership 1st Clinic Residents & Staff Clinics
Facilities %
Complete Vaccinated Next 7 Days
• Added more LTC Pharmacy and Phase
to this federal CVS Part A (SNF) 269 269 100% 36,989 0
program.
CVS Part B (Other LTCF) 717 699 97% 25,524 5
• Active recruiting
of facilities who Walgreens Part A (SNF) 145 145 100% 16,383 71
had been listed as
opted out of the Walgreens Part B (Other LTCF) 2,065 1,284 62% 32,023 487
program
Managed Health Care Assoc (Other LTCF) 1,192 85 7% 432 124
underway.
Totals 4,388 1,753 51% 81,336 687Science Round Up
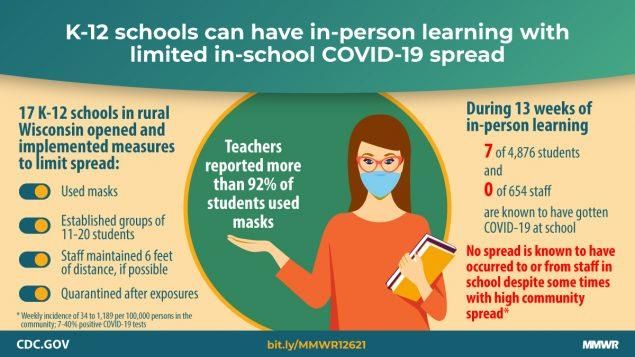
• K-12 schools can have in-person learning with limited in-school COVID-19 spread
• Large COVID-19 outbreak reported in high school wrestling tournament
• NFL revised COVID-19 protocols after initial outbreaks
• New studies of B.1.1.7 severity
• Most recent data shows some return toward baseline mobility patterns, particularly for non-essential visits
(data through 1/26/21)Study on School Re-opening – Wisconsin • 17 participating schools (8 K-6; 9 7th-12th) • 2-3 layer masks purchased for all students • Exclusion of symptomatic children and siblings • Strict cohorting and keeping students next to a buddy.
CDC Report: High School Wrestling Tournament

        38 infections in 130 attendees,                                  Local community rates were
        10 high schools                                                  259 new cases / million / day.

                                                                         384 in-school close contacts
          30% of household members                                       quarantined. 1,700 total
          infected.                                                      school days lost.
          One death in a contact >50                                     20% of non-household
          years old.                                                     members infected.

Atherstone C, et al. SARS-CoV-2 Transmission Associated with High School Wrestling Tournaments – Florida, December 2020
– January 2021. MMWR Jan 29, 2021. 70(4);141-143.
NFL Revised Protocols after initial outbreaks
NFL enhanced safety protocols included:
• No indoor meetings
• Proximity monitors to identify high risk contacts
• Masks required during practice and in weight room
• No seating for meals
• Locker room limited to
New studies of B.1.1.7 severity (UK)

 • 4 analyses comparing risk of death in • Increase seen across age groups.
   variant infections vs non-variant
   infection.
                                         • No effect on hospitalizations found
                                           yet.
 • Adjusted for age, location, time
                                               • Limitations – Impact of B.1.1.7
 • Estimated risk increase of 35-90%             outbreaks in nursing homes unclear

                        Example CFR Change: 1.7%          2.3% - 3.2%
NERVTAG Report on B.1.1.7 severity – UK SAGE
How many people are staying at home in Michigan?
2020 • Stay-at-home levels
2019 increased in
November
• Recently declined
back to pre-
November levels
• Overall increase
compared to 2019
• Most recent data is
1/16/21
Data Sources: Bureau of
Transportation Statistics,
MDHHSChange in average mobility
Unacast mobility
patterns in MI
Change in non-essential visits
Most recent data shows
some return toward
baseline mobility
patterns, particularly for
non-essential visits
(data through 1/26/21)
Difference in encounter density
unacast social distancing
scoreboard
https://www.unacast.com/co
vid19/social-distancing-
scoreboardYou can also read