MI COVID response Data and modeling update - October 12, 2021 - State of ...

Page created by Eleanor Vega
 
CONTINUE READING
MI COVID response Data and modeling update - October 12, 2021 - State of ...
MI COVID response
Data and modeling update
October 12, 2021
MI COVID response Data and modeling update - October 12, 2021 - State of ...
Executive Summary
Special Population Focus: Children
Cases and hospitalizations are increasing compared to last week
There were 393 outbreaks and clusters in K-12 schools
7% of school districts (36) have rescinded their school mask policies

Michigan remains at High Transmission
Percent positivity (11.2%) increased for two weeks (10.3% last week)
Case rate (304.4 cases/million) is increasing for three and half months (258.9 cases/million prior week)
   In the last 7 days, only 3 states reported more cases than Michigan (this week rank 55th lowest; 52nd last week), and Michigan case rate is 46th
   lowest (T37th last week)
   100% of positive tests available for sequencing in Michigan were Delta variant in the last 4 weeks
Percent of inpatient beds occupied by individuals with COVID (9.3%) is increasing for 12 weeks (up from 8.0% last week)
   Michigan has 30th lowest inpatient bed utilization (20th last week) and 28th lowest adult ICU bed utilization (13th last week)
Death rate (3.0 deaths/million) is increasing for one week (2.8 last week). There were 210 COVID deaths between Sep 28-Oct 4
   Michigan has the 36th lowest number of deaths (30th last week), and T16th lowest death rate (T10th last week) in the last 7 days
7-day average state testing rate increased to 4,095.1 tests/million/day. Daily diagnostic tests (PCR) is 41.5K per day, and the weekly average for
   PCR and antigen tests conducted in Michigan is 52.2K.
Nearly 11.0 million COVID-19 vaccine doses administered, 52.7% of population is fully vaccinated (5.26 million people)

                                                                                                                                                2
MI COVID response Data and modeling update - October 12, 2021 - State of ...
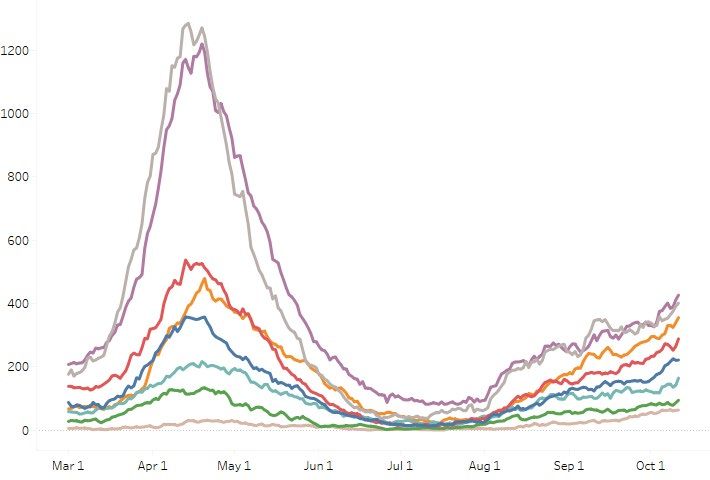
COVID-19 and Pediatric
      Populations
      Cases and hospitalizations

                       National                        Public Health     Other      Science
Special Populations                Spread   Severity
                      Comparison                        Response       Indicators   Roundup
MI COVID response Data and modeling update - October 12, 2021 - State of ...
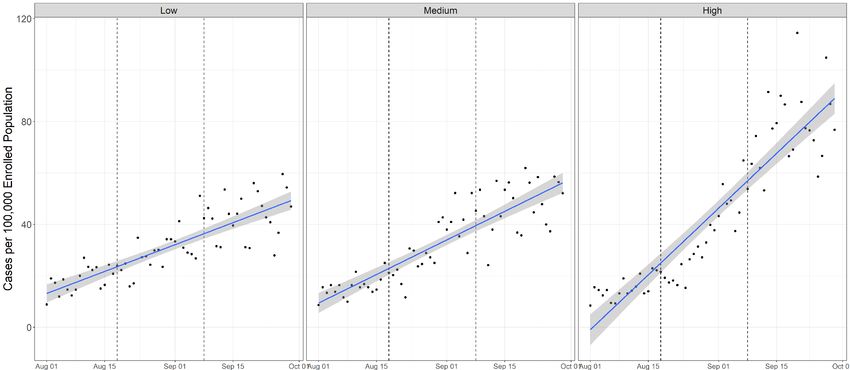
Overview of metrics for individuals < 18

                                                                                                                 *                                   *

                                                                                                                                                               <

                                                                                                                                                               <
 • Each day more than 425 children under age 12 become infected with COVID-19, 50 more children per day than last week
 • Pediatric case rates are steady at 305.6 cases/million (last week: 269.4 cases/million)
 • Pediatric (
MI COVID response Data and modeling update - October 12, 2021 - State of ...
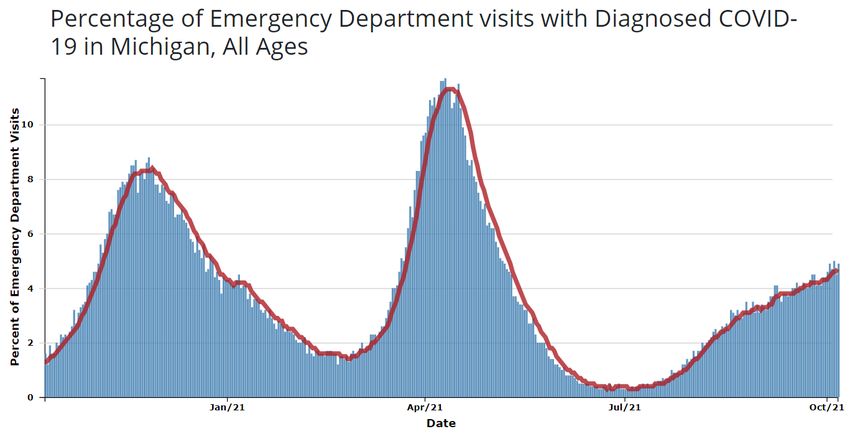
Statewide Hospitalization Trends: Pediatric COVID+ Census
                                       The census of COVID+ Pediatric
                                       patients (
MI COVID response Data and modeling update - October 12, 2021 - State of ...
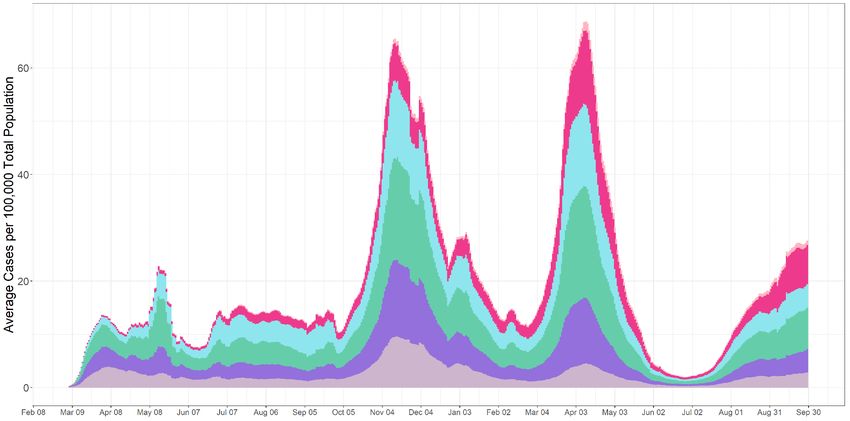
What do we know about
      COVID-19 impact on
      Michigan children and
      schools

                       National                        Public Health     Other      Science
Special Populations                Spread   Severity
                      Comparison                        Response       Indicators   Roundup
MI COVID response Data and modeling update - October 12, 2021 - State of ...
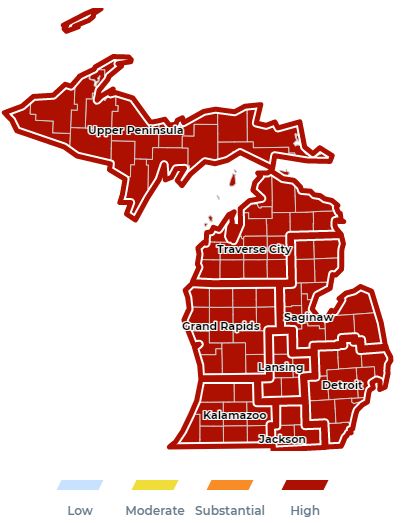
Number of Weekly Reported Outbreaks
    Number of outbreak investigations by site type, week ending Oct 7
                                                                                                                                                                                                             Visibility1           Easier to identify outbreak
                                                                        Site type          Outbreaks by ongoing/new classification, #                                                                                              Harder to identify outbreak
                                                                                                                                     Ongoing                                          New          Total
                                                                  K- 12 SCHO O L                                                                                         312            81          393                           Total number of active
                                 SNF/L T C/ O T HE R        A SSIS T E D LIV ING                                          108     30     138                                                                                      outbreaks is up 6% from
                                        CHIL DCA R E/Y O U T H          PRO G RA M                        31 1142                                                                                                                 previous week, with 161 new
                                MA NUF A CT UR IN G , CONS T R U CT IO N                                  33 740                                                                                                                  outbreaks identified
                                                                           *RETA IL                    22 6 28
                                                                             OTHER                     21 4 25
                                                                                                                                                                                                                                  K-12 schools reported the
                                                                  HEA L T HCA R E                    12 3 15
                                                                                                                                                                                                                                  greatest number of new
                                                                CORRE C T I O N S                     9 4 13
                                                                                                                                                                                                                                  outbreaks and clusters (81)
                                                       *SOCIA L GA THER IN G                         8 4 12
                                                                                                     8 4 12
                                                                                                                                                                                                                                  this week, and there were an
                                             *RES TA U RA N T S A ND BA RS
                                                                                                     7 4 11
                                                                                                                                                                                                                                  additional 11 new outbreaks in
                                                             OFF ICE SET T IN G
                                                    COLL EG E/ U N IV E R S IT Y                      9 2 11
                                                                                                                                                                                                                                  childcare and youth programs
                             *CO MMU N IT Y EXPO S UR E - OUT DO O R                                 7 0    7                                                                                                                     for a total of 92 outbreaks in
                                                                      *SHEL T E RS                  3 0    3                                                                                                                      settings primarily with 0-19-
                                *CO MMU N IT Y EXPO S UR E - INDO O R                               2 0    2                                                                                                                      year-olds. (57% of all known
                                                   *REL I G I O U S SERV I CE S                     1 1    2                                                                                                                      new outbreaks)
                                                   *PER S O NA L SERV IC E S                        2 0    2
                               A GRICU L T U RA L / F O O D        PRO CE S S I NG                  2 0    2                                                                                                                      The next greatest number of
                                                                                                                                                                                                          758                     new outbreaks was among
                                                                            TO TA L                                                 597                                                      161
                                                                                                                                                                                                                                  SNF/LTC (30), followed by
   1. Based on a setting’s level of control and the extent of time patrons/residents spend in the particular setting, different settings have differing levels of ability to ascertain whether a case derived from that setting   manufacturing/construction (7),
   NOTE: Many factors, including the lack of ability to conduct effective contact tracing in certain settings, may result in significant underreporting of outbreaks. This chart does not provide a complete picture of           retail (6), and eight other
   outbreaks in Michigan and the absence of identified outbreaks in a particular setting in no way provides evidence that, in fact, that setting is not having outbreaks.                                                         settings with at least 1 new
   NOTE (10/4): MDHHS adopted the new CSTE school cluster and outbreak definition which impacts how transmissions within school-sponsored settings are reported to the health department
                                                                                                                                                                                                                                  outbreak in the last week.
   Source: LHD Weekly Sitreps

                                          National                                                                                                            Public Health                                 Other                            Science
Special Populations                                                                  Spread                                 Severity                                                                                                                        7
                                         Comparison                                                                                                              Response                               Indicators                          Roundup
K-12 school clusters and outbreaks, recent and ongoing, week ending Oct 7
     Number of reported outbreaks increased since last week (364 to 393), including increases in High Schools (123 to 133), Middle/Jr High (89 to
     92), and Pre K-Elementary (146 to 164). Only Administration declined (5 to 4).
                                                                                                          Number of             Range of cases
     Region          Number of reported cases, #                        # Ongoing - Excluding New # New   outbreaks             per outbreak
       Region 1                                    446       96                                                                                                                                           75             2-29
       Region 2n                      170     80                                                                                                                                                          50             2-31
       Region 2s                     152     7                                                                                                                                                            25             2-23
       Region 3                                                       836    106                                                                                                                          97             2-47
       Region 5                    106      57                                                                                                                                                            19             2-46
       Region 6                                  383     42                                                                                                                                               55             2-61
       Region 7                    107      13                                                                                                                                                            24             2-12
       Region 8                                  400     38                                                                                                                                               48             2-43
       Total                                                                               2,600                                                                 439                                    393              2-61

                                                                                                                                                                                                Number of          Range of cases
     Grade level                   Number of reported cases, #                                                                 # Ongoing - Excluding New                 # New                  outbreaks          per outbreak
     Pre-school - elem.                                850                    167                                                                                                                        164             2-40
     Jr. high/middle school                      621                 85                                                                                                                                   92             2-35
     High school                                             1,111                         187                                                                                                           133             2-61
     Administrative                18 0                                                                                                                                                                    4              2-9
     Total                                                                                    2,600                                                               439                                    393             2-61
     Many factors, including the lack of ability to conduct effective contact tracing in certain settings, may result in significant underreporting of outbreaks. This chart does not provide a complete picture
     of outbreaks in Michigan and the absence of identified outbreaks in a particular setting in no way provides evidence that, in fact, that setting is not having outbreaks.
     NOTE (10/4): MDHHS adopted the new CSTE school cluster and outbreak definition which impacts how transmissions within school-sponsored settings are reported to the health department

     Source: LHD Weekly Sitreps

                                         National                                                                                                           Public Health                                 Other        Science
Special Populations                                                                 Spread                                Severity                                                                                               8
                                        Comparison                                                                                                             Response                               Indicators      Roundup
MI School Districts and Mask Policy as of Oct 11, 2021
       Yes – Any masking policy in some subset of school grades
       No – No mask policies (includes unknown)

            NUMBER OF SCHOOL DISTRICTS                                           NUMBER OF STUDENTS* IN SCHOOL                              NUMBER OF SCHOOL
             WITH MASK POLICIES IN K-12                                           DISTRICTS WITH MASK POLICIES                          DISTRICTS WITH MASK POLICY
                     SETTINGS                                                                                                                    REVERSAL
                                                                                                                                 600

                                                                                                                                 500                                 36

                                                                               No, 504627                                        400
                                                                  Yes, 222                                                                                          275
                                                                                                                                 300
                                                                                                                     Yes,        200
             No, 311                                                                                                748181
                                                                                                                                 100                                222

                                                                                                                                   0
                                                                                                                                       Mask Policy Present   No Mask Policy   Mask Policy Rescinded

  •     42% (222/533) of K-12 school districts have mandatory mask policies
  •     School districts with mandatory mask policies cover 60% (748,181/1,252,808) of K-12 students*
  •     Not all K-12 grades or students may be covered by masks polices; examples include policies for those through K-6, or only during higher levels
        of community transmission
  •     7% (36/533) of K-12 school districts have rescinded their mask policies
        * Student size based on school enrollment numbers; Buses and public transportation are federally required to enforce mask mandates
Source: Executive Office of Governor School District Mask Policy Database

                                       National                                                                  Public Health                     Other                       Science
Special Populations                                                         Spread          Severity
                                      Comparison                                                                   Response                     Indicators                    Roundup
Case increases are                          First days of school in Michigan

  largest in school aged
  children (5-18 year olds)
  • School aged children (5-18 y)
    saw a rapid rise beginning over
    the school reopening period that
    has remained high following
    back-to-school
  • 31-50 year olds are now
    beginning to increase to next
    highest, above other age groups
  • Previous surges had larger
    proportions of cases in adults
Data source: MDSS case data as of 10/6/2021
Districts without                                                                                                                First days
                                                                                                                                 of school in                                 Few mask rules
 mask requirements                                                                                                                Michigan
 are experiencing                                                                                                                                                                    Partial mask rules
 higher case rates
                                                                                                                                                                                       Masks required
• 5-18 year old school population case
  rates are higher and rose faster in
  districts without mask requirements

                                                                    7-day Avg
• Districts with complete or partial
  mask requirements have lower case
  rates with slower increases
                                                                                  Aug 01                      Aug 15                             Sep 01                     Sep 15                            Oct 01
• Note districts may change categories                                              High mask index (more mask rules)                      Medium                           Low mask index (few mask rules)
  as mask rules change
                                                                                                First days                                First days                                   First days
• Districts with mask rules may also                                                            of school                                 of school                                    of school

  have other prevention measures that                                                               in
                                                                                                Michigan
                                                                                                                                              in
                                                                                                                                          Michigan
                                                                                                                                                                                           in
                                                                                                                                                                                       Michigan
  can contribute to lower transmission
  levels
        High mask index = mask required for all grades;
        Medium = partial mask req. (tiered, some grades, based
        on vax status, staff only); Low = None or unknown. Blue
        line & shaded region is a linear trend fit. Data Sources:
        MDSS/MDHHS case data as of 10/6/2021 geocoded to
        school district, EOG School District Mask Policy Tracker
        data. Note: Cases are among all 5-18 year olds,
        population is the school-enrolled population.                           Aug 01 Aug 15       Sep 01   Sep 15 Oct 01Aug 01 Aug 15       Sep 01      Sep 15 Oct 01Aug 01 Aug 15       Sep 01   Sep 15 Oct 01
Global, National and
Michigan Trends
Global and National Comparisons
  Globally, 237,973,161 cases and 4,854,144 deaths (Data* through
  10/10/21)
  •   Countries with the highest case count are U.S. (44,340,408), India                                               National and Michigan 7-day average New Cases per 100K†
      (33,971,607), and Brazil (21,575,820)                                                                            100

  United States: Nearly all US jurisdictions have High community
                                                                                                                        75
  transmission¶
  •   California and Connecticut are Substantial
  •   Palau and Puerto Rico are Moderate                                                                                50
  •   While National case rates are decreasing, Michigan case rates
      continue to increase and are higher than U.S. total rate
                                                                                                                        25
  •   7-day moving average of daily new cases decreased 11.6%
      compared with previous 7-day moving average
  •   Percent positivity has decreased from the previous week, now at                                                        0
      6.1%. The number of PCR tests performed has increased.                                                                     3/2   5/2   7/2    9/2     11/2     1/2     3/2      5/2   7/2   9/2
                                                                                                                                                       Michigan       United States
  Midwest states maintain High transmission levels†
  •  Overall plateau in Region 5 but some states (MI, MN, WI) are seeing
     increases

     Source: * Johns Hopkins Coronavirus Resource Center; ¶ CDC COVID Data Tracker Weekly Review; † CDC COVID Data Tracker

                                    National                                                                                           Public Health                 Other                  Science
Special Populations                                                      Spread                           Severity
                                   Comparison                                                                                            Response                  Indicators               Roundup
State Comparison: Ohio and Indiana
Ohio Confirmed New Cases / 1M (7 days average)                                                              Indiana Confirmed New Cases / 1M (7 days average)

                                                                                                            1000
1000

                                                                                                             500
 500

   0                                                                                                           0
                Jul 1, 20   Sep 1, 20 Nov 1, 20 Jan 1, 21 Mar 1, 21 May 1, 21 Jul 1, 21   Sep 1, 21                         Jul 1, 20   Sep 1, 20 Nov 1, 20 Jan 1, 21 Mar 1, 21 May 1, 21 Jul 1, 21   Sep 1, 21

                                                                                                            60K
60K
           Percent Positive (7 day average)                      New Tests
                                                                                                                         Percent Positive (7 day average)
                                                                                                            40K
40K
                                                                                                                                                                                       New Tests                  11.4%
                                                                                                  10.3%
                                                                                                            20K
20K

 0K                                                                                                          0K

       May 1, 20 Jul 1, 20 Sep 1, 20 Nov 1, 20 Jan 1, 21 Mar 1, 21 May 1, 21 Jul 1, 21    Sep 1, 21                May 1, 20 Jul 1, 20 Sep 1, 20 Nov 1, 20 Jan 1, 21 Mar 1, 21 May 1, 21 Jul 1, 21    Sep 1, 21

   0                                                                                                           0

 -50           Mobility retails and recreational                                                             -50
                                                                                                                         Mobility retails and recreational

 400                                                                                                         400
                    Hospitalizations / 1M                                                             290                         Hospitalizations / 1M
                                                                                                                                                                                                                    224
 200                                                                                                         200

   0                                                                                                           0
       May 1, 20 Jul 1, 20 Sep 1, 20 Nov 1, 20 Jan 1, 21 Mar 1, 21 May 1, 21 Jul 1, 21    Sep 1, 21                May 1, 20 Jul 1, 20 Sep 1, 20 Nov 1, 20 Jan 1, 21 Mar 1, 21 May 1, 21 Jul 1, 21    Sep 1, 21

                                                                                                                                                                                                                   14
State Comparison: Wisconsin and Michigan
Wisconsin Confirmed New Cases / 1M (7 days average)                                                          Michigan Confirmed New Cases / 1M (7 days average)

                                                                                                             800
1000
                                                                                                             600

                                                                                                             400
 500
                                                                                                             200
   0                                                                                                           0
                Jul 1, 20   Sep 1, 20 Nov 1, 20 Jan 1, 21 Mar 1, 21 May 1, 21 Jul 1, 21   Sep 1, 21                          Jul 1, 20   Sep 1, 20 Nov 1, 20 Jan 1, 21 Mar 1, 21 May 1, 21 Jul 1, 21   Sep 1, 21

60K
                                                                                                             80K
           Percent Positive (7 day average)                      New Tests
                                                                                                             70K
40K                                                                                                          60K          Percent Positive (7 day average)
                                                                                                             50K
                                                                                                                                                                                        New Tests
                                                                                                      9.5%   40K
20K                                                                                                          30K
                                                                                                             20K                                                                                                   9.6%
                                                                                                             10K
 0K
       May 1, 20 Jul 1, 20 Sep 1, 20 Nov 1, 20 Jan 1, 21 Mar 1, 21 May 1, 21 Jul 1, 21    Sep 1, 21                 May 1, 20 Jul 1, 20 Sep 1, 20 Nov 1, 20 Jan 1, 21 Mar 1, 21 May 1, 21 Jul 1, 21    Sep 1, 21

   0                                                                                                            0

 -50           Mobility retails and recreational                                                              -50
                                                                                                                          Mobility retails and recreational

                                                                                                             -100
 400                                                                                                          400
 300                                                                                                  212                      Hospitalizations / 1M                                                               188
                    Hospitalizations / 1M
 200                                                                                                          200
 100
                                                                                                                0
       May 1, 20 Jul 1, 20 Sep 1, 20 Nov 1, 20 Jan 1, 21 Mar 1, 21 May 1, 21 Jul 1, 21    Sep 1, 21                 May 1, 20 Jul 1, 20 Sep 1, 20 Nov 1, 20 Jan 1, 21 Mar 1, 21 May 1, 21 Jul 1, 21    Sep 1, 21

                                                                                                                                                                                                                   15
State Comparison: Illinois and Minnesota
Illinois Confirmed New Cases / 1M (7 days average)                                                           Minnesota Confirmed New Cases / 1M (7 days average)

1000                                                                                                         1000

 500                                                                                                          500

   0                                                                                                            0
                Jul 1, 20   Sep 1, 20 Nov 1, 20 Jan 1, 21 Mar 1, 21 May 1, 21 Jul 1, 21   Sep 1, 21                          Jul 1, 20   Sep 1, 20 Nov 1, 20 Jan 1, 21 Mar 1, 21 May 1, 21 Jul 1, 21   Sep 1, 21

                                                                                                             100K

100K
           Percent Positive (7 day average)                      New Tests
                                                                                                                          Percent Positive (7 day average)
                                                                                                                                                                                                                   9.5%

                                                                                                             50K                                                                        New Tests
50K

                                                                                                      2.6%

 0K                                                                                                           0K

       May 1, 20 Jul 1, 20 Sep 1, 20 Nov 1, 20 Jan 1, 21 Mar 1, 21 May 1, 21 Jul 1, 21    Sep 1, 21                 May 1, 20 Jul 1, 20 Sep 1, 20 Nov 1, 20 Jan 1, 21 Mar 1, 21 May 1, 21 Jul 1, 21    Sep 1, 21

   0
                                                                                                                0

 -50           Mobility retails and recreational                                                              -50
                                                                                                                          Mobility retails and recreational

 400
                                                                                                              300
 300                                                                                                                           Hospitalizations / 1M
                    Hospitalizations / 1M                                                                     200                                                                                                   163
 200
 100                                                                                                          100
                                                                                                      110
                                                                                                                0
       May 1, 20 Jul 1, 20 Sep 1, 20 Nov 1, 20 Jan 1, 21 Mar 1, 21 May 1, 21 Jul 1, 21    Sep 1, 21                 May 1, 20 Jul 1, 20 Sep 1, 20 Nov 1, 20 Jan 1, 21 Mar 1, 21 May 1, 21 Jul 1, 21    Sep 1, 21

                                                                                                                                                                                                                   16
Key Messages: COVID-19 Burden Among Younger Ages Remains High
     Statewide positivity increased 11.2% (last week: 10.3%)
     •   This is a 9% increase in the past week (prior week: 17% increase)
     •   Positivity is increasing in all MERC regions
     •   Positivity in seven regions is above 10%

     Case rate has increased to 304.4 cases/million (last week: 258.9 cases/million)
     • Increasing for three and a half months (June 26 low)
     • Cases per million are plateaued or increasing in most MERC regions;
     • 10-19-years-olds are experiencing the greatest case burden (596 daily cases; 474.8 cases/mil)

     Michigan is at High Transmission level
     •   All counties in Michigan are at high transmission level
     •   CDC recommends all individuals, regardless of vaccination status, should mask indoors
     •   The U.S. is at high transmission level (195.3 cases/100,000 in last 7 days) with 52 states/territories in substantial or high transmission

     Number of active outbreaks is up 6% from last week
     • 161 new outbreaks were identified in the past week
     • K-12 reported the most total outbreaks (312) and new outbreaks (81) this week

                          National                                                         Public Health              Other                Science
Special Populations                               Spread                Severity
                         Comparison                                                          Response               Indicators            Roundup
Confirmed and probable case indicators                                                              Risk levels
           Table Date: 10/11/2021 (7 days from date table was produced: 10/4/2021)                  Low    A    B      C      D      E

             Cases                                               Positivity

                       National                                               Public Health     Other                      Science
Special Populations                   Spread          Severity                                                                           18
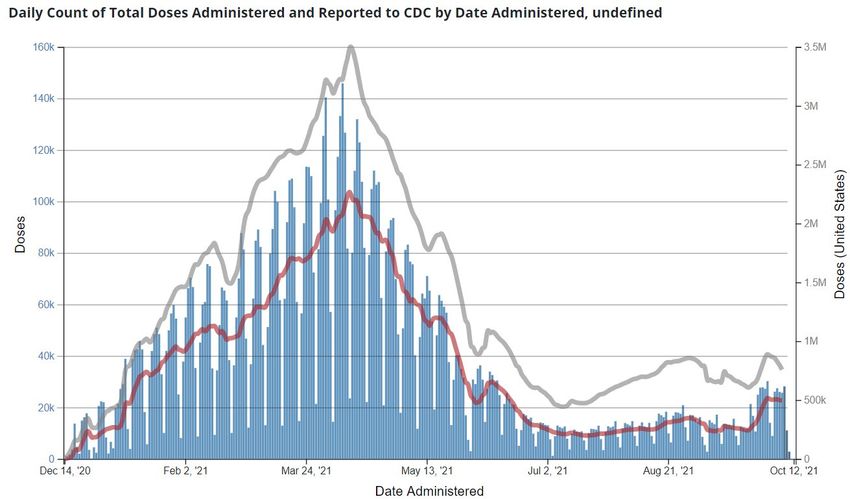
                      Comparison                                               Response       Indicators                Roundup
Michigan Lag adjusted COVID cases by onset date
 New confirmed cases by onset actual and adjusted as of October 11, 2021 (-2 days)

                                  • The gray line is cases reported
    3500
              ADJUSTED              as of 10/11 by onset date.
              NEW_CASES
                                  • The blue line is the expected
    3000
                                    adjustment for cases by onset
                                    date as data is backfilled
    2500
                                  • The increasing delay between
                                    onset of symptoms and date
    2000
                                    of testing means that recent
                                    case numbers underestimate
    1500
                                    the true number of cases
    1000

     500

       0
              Jun 2      Jun 12      Jun 22   Jul 2   Jul 12   Jul 22   Aug 1   Aug 11   Aug 21   Aug 31   Sep 10   Sep 20   Sep 30   Oct 10

                                                                                                                                               19
Michigan at High Transmission Level

   Dashboard | CDC | MI Start Map for most recent data by
   reporting date

                       National                             Public Health     Other      Science
Special Populations                Spread        Severity                                          20
                      Comparison                             Response       Indicators   Roundup
Time Trends – Positivity, Case Rates, Hospitalizations, Deaths
            COVID-19 transmission remains high and early indicators show Delta surge may be speeding up again
           Daily Positive Test Rate                             Daily Inpatient Beds Occupied by COVID patients

           Daily Case Rate                                      Daily Deaths

                       National                                      Public Health      Other          Science
Special Populations                   Spread         Severity                                                    21
                      Comparison                                      Response        Indicators      Roundup
Time Trends – Annual Comparison
            We are heading into the winter months (and holiday season) starting at higher cases rates than last
             year

            7- day rolling average of Rates 2020 vs 2021
             800                                                                                  2020 Holiday wave
                    Alpha (B.1.1.7) wave
             700

             600

             500

             400
                                                                 Delta (B.1.617.2) wave
             300
                          First wave
             200

             100

              0
                   3/1 3/15 3/29 4/12 4/26 5/10 5/24 6/7 6/21 7/5 7/19 8/2 8/16 8/30 9/13 9/27 10/1110/25 11/8 11/22 12/6 12/20 1/3 1/17 1/31 2/14 2/28
                                                            Weekly Case Rate 2020       Weekly Case Rate 2021

                           National                                                        Public Health             Other                Science
Special Populations                                Spread               Severity                                                                    22
                          Comparison                                                         Response              Indicators            Roundup
Case Rate Trends by Age Group
    Daily new confirmed and probable cases per million by age group (7-day rolling average)
                                0-9                  30-39             60-69
                                10-19                40-49             70-79
        1000                    20-29                50-59             80+                                     500

                                                                                                               400
         750

                                                                                                               300
         500
                                                                                                               200

         250
                                                                                                               100

             0                                                                                                      0
                 3/1     5/1          7/1      9/1      11/1        1/1       3/1          5/1   7/1   9/1              6/26   7/10   7/24     8/7   8/21      9/4   9/18     10/2

    •      Case rate trends for all age groups are plateaued or increasing
    •      Case rates for all age groups are between 187 and 475 cases per million (through 10/4)
    •      Case rates are highest for 10-19-year-olds followed by 30-39, 40-49, 20-29, and 0-9
        Note: Case information sourced from MDHHS and reflects date of onset of symptoms
        Source: MDHHS – Michigan Disease Surveillance System

                                         National                                                                              Public Health           Other                Science
Special Populations                                                            Spread                    Severity                                                                     23
                                        Comparison                                                                               Response            Indicators             Roundup
Number of Cases and CaseRates by Age Group, data as of Oct 11
    Daily new confirmed and probable cases per million by age group (7-day rolling average)

                       Age                Average†                    Average†                  One Week          •   Trend numbers and comparisons are being
                      Group              daily cases                 Daily Case               % Change (Δ #)*         impacted by longer backfill times – the data
                                                                        Rate                                          in this table are comparing the two time
                  0-9                          299.7                      260.0                      4% (+12)         points from the most recent data file
                  10-19                        595.9                      474.8                     4% (+23)      •   Average daily number of cases (595.9) and
                  20-29                        405.4                      293.9                      7% (+26)         avg. daily case rate (474.8 case/mil) are
                                                                                                                      highest for those aged 10-19
                  30-39                        475.0                      391.5                     10% (+43)
                                                                                                                  •   This week the highest growth was among
                  40-49                        390.7                      331.3                      8% (+29)
                                                                                                                      those 70+
                  50-59                        344.6                      255.2                     12% (+36)
                                                                                                                  •   Case rates for age groups 10-19, 30-39, and
                  60-69                        271.4                      212.8                     15% (+35)
                                                                                                                      40-49 are all higher than the state
                  70-79                        171.9                      224.1                     29% (+39)
                                                                                                                  •   Case rates bottomed out on June 26, 2021
                  80+                           77.6                      187.3                     32% (+19)
                  Total¶                     3,047.9                      304.4                     9% (256.4)
                 † Rolling 7-day average; ¶ Total may not reflect state due to missing age data
                 Note: Case information sourced from MDHHS and reflects date of onset of symptoms
                 Source: MDHHS – Michigan Disease Surveillance System

                           National                                                                              Public Health         Other              Science
Special Populations                                               Spread                            Severity                                                         24
                          Comparison                                                                              Response           Indicators          Roundup
Case Rates by Reported Racial and Ethnic Group
             Daily new confirmed and probable cases per million                                                            Daily new confirmed and probable cases per
             (7 day rolling average) by race category                                                                      million (7 day rolling average) by ethnicity category
               400        American Indian/Alaska Native                    Black/African American                          400          Hispanic or Latino     Not Hispanic or Latino
                          Asian/Pacific Islander                           White
                              Race                      Case Rate
                                                                                                                                                             Race                  Case Rate
               300            American Indian/          315.0                                                              300
                              Alaskan Native                                                                                                                 Hispanic/Latino       203.5

                              Asian/Pacific Islander    88.3                                                                                                 Non-Hispanic          214.4

               200            Black/African American    147.6                                                              200
                              White                     230.0

               100                                                                                                         100

                   0                                                                                                         0
                       6/26          7/10        7/24      8/7        8/21         9/4        9/18           10/2                6/26      7/10      7/24      8/7          8/21           9/4   9/18   10/2
     Updates since last week:
     •    Cases per million are increasing for Whites, Blacks, and Non-Hispanics; case rates are plateaued for Asian/Pacific Islanders
     •    The high number of cases with missing race/ethnicity data, and those multiracial or other are impacting the case rates shown here
     •    American Indian/Alaskan Native have the highest case rates but are declining; Case rates for Non-Hispanic recently surpassed that
          for Hispanics
     •    In the past 30 days, 24% (↑1%) of race data and 28% (↔) ethnicity data was either missing or reported as unknown
     Note: Case information sourced from MDHHS and reflects date of death of confirmed and probable cases.
     Source: MDHHS – Michigan Disease Surveillance System

                                        National                                                                                        Public Health                  Other                       Science
Special Populations                                                          Spread                             Severity                                                                                       25
                                       Comparison                                                                                        Response                    Indicators                   Roundup
Identified COVID-19 Delta Variants by County
     Last week (Oct 4, 2021)                           This week (Oct 11, 2021)

Data last updated Oct 11, 2021
Source: MDSS

                                  National                        Public Health     Other      Science
Special Populations                           Spread   Severity
                                 Comparison                        Response       Indicators   Roundup
Key Messages: Healthcare Capacity and COVID Severity

     Hospitalizations and ICU utilization are increasing
      4.9% of ED visits are for COVID diagnosis (up from 4.1% last week)
      Hospital admissions are increasing for most age groups this week
      Hospital census has increased 18% (vs. up 10% week prior)
      All regions experienced increasing trends in hospital census this week
        Regions 1, 3, 6, and 8 now have above 200/million population hospitalized
        Most growth is in Regions 1, 5, and 6
      Volume of COVID-19 patients in intensive care has increased 15% since last week (vs. 12% increase last week)

     Death rate is increased to 3.0 daily deaths/million residents (up from 2.8 deaths/million last week)
      Overall trends for daily average deaths are increasing for Whites, Non-Hispanics, and Hispanics
      Currently, American Indian/Alaskan Natives and Whites have the highest death rates
      In the past 30 days, there have been 6 deaths among confirmed and probable COVID-19 cases under the age of 20

                       National                                            Public Health        Other             Science
Special Populations                      Spread            Severity
                      Comparison                                            Response          Indicators         Roundup
Michigan Trends in Emergency Department (ED) Visits for
       Diagnosed COVID-19

                                                                                                                             4.9%

  •    Trends for ED visits have increased to 4.9% since last week (4.1% week prior)
  •    Trends vary by age groups with most age groups seeing an increase
  •    Over past week, those 40-49 years saw highest number of avg. daily ED CLI visits (6.8%), but those between 40 and 74 all above state average
Source: https://covid.cdc.gov/covid-data-tracker/#ed-visits

                                   National                                             Public Health            Other               Science
Special Populations                                           Spread   Severity
                                  Comparison                                              Response             Indicators           Roundup
Average Hospital Admissions by Age Groups
                             Confirmed COVID-19 Hospital Admissions by Age Group - Statewide Rolling Weekly Average
        60                                                                                                                                                                 60-69
        55
        50
        45
        40
        35
        30
        25
        20
        15
        10
         5
         0
          9/5/2021      9/8/2021     9/11/2021   9/14/2021    9/17/2021    9/20/2021     9/23/2021       9/26/2021   9/29/2021   10/2/2021     10/5/2021   10/8/2021 10/11/202

                         0 - 11       12 - 17      18 - 19       20 - 29       30 - 39         40 - 49          50 - 59      60 - 69         70 - 79       80+      Age
                                                                                                                                                                    Unkn

    •    Trends for daily average hospital admissions have increased 22% since last week (vs. 6% increase prior week)
    •    Most age groups experienced a one week increase in daily hospital admissions
    •    Over the past week, those 60-69 years have seen the highest number of avg. daily hospital admissions (59 admissions)
    Source: CHECC & EM Resource

                                   National                                                                  Public Health               Other                   Science
Special Populations                                          Spread                Severity                                                                                29
                                  Comparison                                                                   Response                Indicators                Roundup
Average Hospital Admissions Are Increase for all Age Groups

                                                                                                                        60-69

                                                                                                                                 Peds

    •   Trends for daily average hospital admissions have increased 22% since last week (vs. 6% increase prior week)
    •   Most age groups experienced a one week increase in daily hospital admissions
    •   Over the past week, those 60-69 years have seen the highest number of avg. daily hospital admissions (59 admissions)
    Source: CHECC & EM Resource

                                   National                                  Public Health         Other               Science
Special Populations                            Spread        Severity                                                            30
                                  Comparison                                  Response           Indicators        Roundup
Number of Hospital Admissions and Admission Rates are Increasing for Most
 Age Groups
    Daily new hospital admission per million by age group (7 -day rolling average)
          Age                  Average† daily                          Average† Daily                        One Week              •   Through October 11, there were an average of 261
         Group               number of hospital                          Hospital                          % Change (Δ #)              hospital admissions per day due to COVID-19, which
                                admissions                            Admission Rate*                                                  is 47 (22%) more than last week
      0-11                                  3.3                                    2.4                               -8% (-
Statewide Hospitalization Trends: Total COVID+ Census
         Hospitalization Trends 3/1/2021 – 10/11/2021         The COVID+ census in hospitals has
     Confirmed Positive & Persons Under Investigation (PUI)   increased 18% from the previous week
                                                              (previous week’s increase was 10%)

                      Confirmed Positive

                                                                  Hospitalized COVID Positive Long Term
                                                                     Trend (beginning March 2020)

            PUI

                                                                                                          32
Statewide Hospitalization Trends: Regional COVID+ Census
                                                                  The hospital census of COVID+ patients has
      Hospitalization Trends 3/1/2021 – 10/11/2021
                                                                  increased in all regions. The fastest growth
               Confirmed Positive by Region
                                                                  was seen in Regions 1, 5 and 6.
                                                     Region 1
                                                     Region 2N    Regions 1, 3, 6 and 8 have greater than
                                                     Region 2S
                                                     Region 3
                                                                  200/M population hospitalized.
                                                     Region 5
                                                     Region 6
                                                     Region 7        Region   COVID+ Hospitalizations       COVID+
                                                     Region 8                  (% Δ from last week)     Hospitalizations /
                                                                                                              MM

                                                                 Region 1            221 (24%)                204/M

                                                                 Region 2N           401 (12%)                181/M

                                                                 Region 2S           426 (15%)                191/M

                                                                 Region 3            288 (17%)                254/M

                                                                 Region 5            164 (40%)                172/M

                                                                 Region 6            355 (23%)                242/M

                                                                 Region 7             94 (11%)                188/M

                                                                 Region 8             63 (11%)                202/M

                                                                                                                      33
Statewide Hospitalization Trends: ICU COVID+ Census
                                                    The census of COVID+ patients in ICUs has
     Hospitalization Trends 3/1/2021 – 10/11/2021   increased by 15% from last week
               Confirmed Positive in ICUs
                                                    Regions 1, 6, 7 and 8 have greater than 30% of
                                                    adult ICU beds filled with COVID+ patients and
                                                    Region 6 is approaching ~40% of adult ICU beds
                                                    occupied with COVID+ patients.

                                                       Region   Adult COVID+ in   Adult ICU   % of Adult ICU
                                                                 ICU (% Δ from    Occupancy   beds COVID+
                                                                   last week)
                                                    Region 1        56 (8%)          90%           32%

                                                    Region 2N       95 (0%)          74%           17%

                                                    Region 2S      116 (30%)         85%           17%

                                                    Region 3        79 (25%)         91%           23%
              Confirmed
                                                    Region 5        33 (-3%)         75%           18%
              Positive in ICU
                                                    Region 6        90 (11%)         83%           39%

                                                    Region 7        45 (29%)         81%           31%

                                                    Region 8        20 (33%)         69%           32%

                                                                                                         34
Average and total new deaths, by age group
     Daily COVID-19 deaths in confirmed and probable                                                                        Total COVID -19 deaths in confirmed and probable
     cases per million by age group (7 day rolling average)                                                                 cases by age group (past 30 days, ending 10/4/2021)

                         0-19                40-49               70-79                                                  •       22% of deaths below age sixty                   260       262
         30              20-29               50-59               80+
                         30-39               60-69               Total

                                                                                                                                                                          170
         20

                                                                                                                                                               109

         10
                                                                                                                                                      49

                                                                                                                                             23
                                                                                                                            6         8
          0
              7/22          8/5             8/19               9/2             9/16             9/30                    0-19        20-29   30-39    40-49    50-59    60-69    70-79     80+
     •        Through 10/4, the 7-day avg. death rate is more than 12 daily deaths per million people for those over the age of 70
     •        In the past 30 days, there have been 6 deaths among confirmed and probable COVID-19 cases under the age of 20
     •        30-day proportion of deaths among those under 60 years of age is steady from the prior week
    Note: Death information sourced from MDHHS and reflects date of death of confirmed and probable cases.
    Source: MDHHS – Michigan Disease Surveillance System (MDSS)

                                      National                                                                                       Public Health             Other                  Science
Special Populations                                                          Spread                          Severity                                                                           35
                                     Comparison                                                                                        Response              Indicators            Roundup
30-day rolling average daily deaths per million people by race and
     ethnicity
             Average daily deaths per million people by race                                                             Average daily deaths per million people by
                                                                                                                         ethnicity
                6            American Indian/Alaska Native                     Black/African American                               Hispanic or Latino    Not Hispanic or Latino
                                                                                                                         6
                             Asian/Pacific Islander                            White

                4
                                                                                                                         4

                2                                                                                                        2

                0                                                                                                        0
                    7/22           8/5             8/19              9/2             9/16            9/30                    7/22       8/5        8/19       9/2         9/16     9/30

     •     Overall trends for daily average deaths are increasing for Whites, Non-Hispanics, and Hispanics
     •     Currently, American Indian/Alaskan Natives and Whites have the highest death rate (2.9 deaths/million)
     •     In the past week, Hispanics have seen the largest increase in death rates (+16%)

     Note: Death information sourced from MDHHS and reflects date of death of confirmed and probable cases.
     Source: MDHHS – Michigan Disease Surveillance System

                                      National                                                                                      Public Health               Other                Science
Special Populations                                                          Spread                           Severity                                                                         36
                                     Comparison                                                                                      Response                Indicators            Roundup
•   `

     Key Messages: Public Health Response

         COVID-19 Vaccination
         •    4,386 first doses administered each day (7-day rolling average*); total administrations increasing
         •    Most administered frequently by pharmacies, local health departments, and hospitals
         •    More than 893K third doses administered since August 13th, may include additional dose or booster dose
         •    5.26 million people (52.7%) in the state are fully vaccinated

         Breakthrough
         •    Less than 1% of people who were fully vaccinated experienced vaccine breakthrough
         •    Trends over time show that both case and death rates among the Fully Vaccinated are lower than the Not Fully
              vaccinated rates in Michigan

      *Source: https://covid.cdc.gov/covid-data-tracker/#vaccination-trends_vacctrends-onedose-daily

                               National                                                                  Public Health     Other      Science
Special Populations                                           Spread                          Severity
                              Comparison                                                                  Response       Indicators   Roundup
•    `

      Average daily doses administered declining (data through 10/12/2021)

  13,869,960 doses delivered to providers and
  10,972,618 doses administered*

  MI 7-day rolling average ending October 6th
  • 22,833 total doses/day on average† (19,826 on 9/29)
  • 4,012 first doses/day on average † (4,386 on 9/29)

  Total primary series doses in month of September were
  most frequently administered¶ by:
  Pharmacies (208,480)
  LHD (17,213) and hospitals (15,366)
  Family practice (10,727) and FQHCs (8,865)

  Third Doses
  • 309,943 third doses administered as of 10/11

     Source: *CDC COVID Data Tracker > Vaccinations in the US, † CDC COVID Data Tracker > Vaccination Trends; ¶ MCIR COVID-19 Vaccine Dashboard

                                    National                                                                                           Public Health     Other      Science
Special Populations                                                      Spread                              Severity
                                   Comparison                                                                                             Response     Indicators   Roundup
5.26 Million Michiganders fully vaccinated and 52.7% of total population fully
    vaccinated
                                                                                                       Vaccination Coverage in Michigan as of 10/12/21

            5.26 million people in the state are fully                                                Age Group         % At Least     % Fully        Number Fully
            vaccinated*
                                                                                                                        One Dose      Vaccinated       Vaccinated
            84.0% of people aged 65 and older have
            completed the series (↔%)*                                                             Total Population       57.3%         52.7%          5,264,411
            57.3% of total population initiated (↓0.1%)*                                           ≥ 12 years             66.5%         61.2%          5,264,291
            Race/Ethnicity¶               for those 12 years and
            older:                                                                                 ≥ 18 years             68.7%         63.3%          4,967,788
            •      Initiation coverage highest among those                                         ≥ 65 years             89.1%         84.0%          1,483,463
                   of Non-Hispanic (NH) Asian, Native
                   Hawaiian or Pacific Islander Race
                   (56.5%), then NH American Indian
                   (54.9%), NH White (49.8%), NH Black or
                   African American Races (39.9%).
            •      Initiation is at 53.4% for those of Hispanic
                   ethnicity
            •      Completion follows the same pattern

            •     16.6% data missing or unknown

     Source: *CDC COVID Data Tracker > Vaccinations in the US, ¶ MCIR COVID-19 Vaccine Dashboard

                                    National                                                                          Public Health        Other             Science
Special Populations                                                     Spread                       Severity
                                   Comparison                                                                          Response          Indicators         Roundup
Update on breakthrough
      cases

                       National                        Public Health     Other      Science
Special Populations                Spread   Severity
                      Comparison                        Response       Indicators   Roundup
`

     Potential COVID-19 Vaccination Breakthrough Cases
     Michigan part of CDC’s nationwide investigation (COVID-19 Breakthrough Case Investigations and Reporting | CDC)

     Michigan Data (1/1/21 through 10/5/21):
     •   38,571 cases met criteria based on a positive test 14 or more days after being fully vaccinated
     •    Less than 1% of people who were fully vaccinated met this case definition
         • Includes 574 deaths (504 in persons ages 65 years or older)
         • 1,412 cases were hospitalized

     •   Vaccine breakthrough cases are expected. COVID-19 vaccines are effective and are a critical tool to bring the pandemic under control;
         however, no vaccine is 100% effective at preventing illness. Some fully vaccinated people will get sick, and some will even be
         hospitalized or die from COVID-19. However, there is evidence that vaccination may make illness less severe for those who are
         vaccinated and still get sick. The risk of infection, hospitalization, and death are all much lower in vaccinated people compared to
         unvaccinated.
     •   More than 185 million people in the United States have been fully vaccinated as of October 4, 2021. CDC is monitoring these cases
         among vaccinated persons and evaluating trends in order to better understand who is at risk for severe COVID-19 following vaccine
         breakthrough infection. Vaccinated people have also experienced asymptomatic infections.
     •   Current data suggest that COVID-19 vaccines authorized for use in the United States offer protection against most SARS-CoV-2 variants
         circulating in the United States.

                         National                                                       Public Health            Other                Science
Special Populations                             Spread               Severity
                        Comparison                                                        Response             Indicators            Roundup
Cumulative COVID-19 Cases by Vaccination Status, Michigan, Jan 15 – Oct 5
                                                                                 Fully Vaccinated People (4,948,851)
                                         Cases                                                      Hospitalization                                                           Deaths
                   Percent of Cases In People Not                                 Percent of Hospitalizations In People                                  Percent of Deaths In People Not
                          Fully Vaccinated                                                Not Fully Vaccinated                                                  Fully Vaccinated
                                  (505,838 / 544,409)                                                  (13,512 / 14,924)                                                    (5,662 / 6,236)
                                         92.9%                                                              90.5%                                                              90.8%
                                       505,838                                                              13,512                                                              5,662
                         Total Cases Not Fully Vaccinated                                Total Hospitalized Not Fully Vaccinated                               Total Deaths Not Fully Vaccinated

                        Total Breakthrough Cases                                    Total Breakthrough Hospitalizations                                       Total Breakthrough Deaths
                                 38,571                                                            1,412                                                                 574
                                        0.779%                                                             0.029%                                                             0.012%
                    Percent of Fully Vaccinated People who                          Percent of Fully Vaccinated People Who Were                       Percent of Fully Vaccinated People Who Died of
                   Developed COVID-19 (38,571 / 4,948,851)                          Hospitalized for COVID-19 (1,412 / 4,948,851)                               COVID-19 (574 / 4,948,851)

                                          7.1%                                                               9.5%                                                                9.2%
                 Percent of Cases Who Were Fully Vaccinated                           Percent of Hospitalizations Who Were Fully                       Percent of Deaths Who Were Fully Vaccinated
                              (38,571 / 544,409)                                             Vaccinated (1,412 / 14,924)                                               (574 / 6,236)

                            Total Cases: 544,409                                        Total Hospitalizations: 14,924                                              Total Deaths: 6,236
Michigan Disease Surveillance System may underestimate the frequency of COVID-19 hospitalizations:
- Case investigation and follow-up is more difficult for individuals who get vaccinated (e.g., they are too ill to speak to investigators, don’t answer their phone, or otherwise).
- These hospitalizations include individuals who are hospitalized for issues other than COVID19 (the same as breakthrough COVID-19).
- Individuals who get hospitalization will lag after infection and may occur after case investigation.

                                      National                                                                                       Public Health                          Other                  Science
Special Populations                                                      Spread                          Severity
                                     Comparison                                                                                         Response                         Indicators            Roundup
Trends in Breakthrough Cases, Hospitalizations, and Deaths
                                                                               100%
       •    52.7% of the population is fully                                     90%
            vaccinated yet only account for ~20-
                                                                                 80%
            25% of cases, hospitalizations, and
            deaths                                                               70%

       •    As the fully vaccinated population                                   60%
            has increased, so have the percent
                                                                                 50%
            of breakthrough incidents; but
            breakthrough burden remains lower                                    40%
                                                                                                                                                                                    29%
                                                                                 30%                                                                                              25%     25%
                                                                                                                                                                                                           27%        28%
                                                                                                                                                                    24%                      23%22%     23%        24%
                                                                                                                                                                               22%
                                                                                                                                                                       20%
       In the last 30 days (Sep 6 – Oct 5),                                      20%                                                                                                                  17%
                                                                                                                                                                                                                 16%
                                                                                                                                                       13%
       13,124 (16%) of 83,966 cases, 282                                                                                                            11%        12%

                                                                                 10%                                                     5% 6%
       (24%) of 1,186 hospitalizations, and
                                                                                                                                                  5%
                                                                                                                      1% 2% 2%      2%
                                                                                            0% 0% 0%     0% 0% 0%

       104 (28%) of 378 deaths were among                                         0%
       fully vaccinated individuals

                                                                                                                                     Cases       Hospitalizations     Deaths

Michigan Disease Surveillance System may underestimate the frequency of COVID-19 hospitalizations:
- Case investigation and follow-up is more difficult for individuals who get vaccinated (e.g., they are too ill to speak to investigators, don’t answer their phone, or otherwise).
- These hospitalizations include individuals who are hospitalized for issues other than COVID19 (the same as breakthrough COVID-19).
- Individuals who get hospitalization will lag after infection and may occur after case investigation.

                                      National                                                                                       Public Health                              Other                       Science
Special Populations                                                      Spread                          Severity
                                     Comparison                                                                                           Response                           Indicators                     Roundup
`

      COVID-19 Vaccination Breakthrough Cases and Deaths
        1200   Breakthrough Case Rate vs. Not Fully Vaccinated                                  Breakthrough Death Rate vs. Not Fully Vaccinated
                                Case Rate                                                                        Death Rate
        1000                                    Case Rate among Fully Vaccinated
                                                                                       12
                                                Case Rate among Not Fully Vaccinated
         800                                                                           10

                                                                                        8
         600
                                                                                        6
         400
                                                                                        4
         200
                                                                                        2

           0                                                                            0
            1/25   2/25    3/25   4/25   5/25     6/25    7/25     8/25       9/25       1/25   2/25     3/25     4/25   5/25     6/25   7/25   8/25   9/25

  •   Trends over time show that both case and death rates among the Fully Vaccinated are lower than the Not Fully vaccinated rates in Michigan
  •    The proportion of breakthrough cases and deaths among all cases and deaths has shown some increases as more people become fully
       vaccinated
      • However, the risk of infection and death remains significantly lower among the fully vaccinated

                           National                                                               Public Health                 Other             Science
Special Populations                                 Spread                      Severity
                          Comparison                                                                   Response            Indicators            Roundup
Appendix
Michigan Lag adjusted new COVID cases by onset date
 New confirmed cases by onset actual and adjusted as of October 11, 2021 (-2 days)                       • The gray line is cases reported
                                                                                                           as of 10/11 by onset date.
    8K
                                                                                                         • The blue line is the expected
                                                                                                           adjustment for cases by onset
    7K
                     ADJUSTED                                                                              date as data is backfilled
                                                                                                         • The increasing delay between
                     NEW_CASES

    6K
                                                                                                           onset of symptoms and date
    5K
                                                                                                           of testing means that recent
                                                                                                           case numbers underestimate
    4K                                                                                                     the true number of cases

    3K

    2K

    1K

    0K
         Feb 1, 20   Apr 1, 20   Jun 1, 20   Aug 1, 20   Oct 1, 20   Dec 1, 20   Feb 1, 21   Apr 1, 21   Jun 1, 21   Aug 1, 21   Oct 1, 21

                                                                                                                                             46
Identified COVID-19 Cases Caused by All Variants of Concern (VOC)
   in US and Michigan
     Variants Circulating in United States, Oct 3 –                               Variants of Concern in Michigan, Oct 11
     Oct 9 (NOWCAST)

                                                                                                                                            Given the reclassification
                                                                                                                                            of several variants to
                                                                                                                                            Variants Being Monitored,
                                                                                                                                            we will retire the reporting
                                                                                                                                            of Alpha, Beta, and Gamma
                                                                                                                                            on future presentations
                                                                                                                               820 cases in Wayne attributed to Detroit

                                                                                 Variant                            MI Reported Cases¶         # of Counties       % Specimens in last 4 wks
                                                                                 B.1.1.7 (alpha) now VBM                   13,667*                   81                       0%
                                                                                 B.1.351 (beta) now VBM                      88                      24                       0%
                                                                                 P.1 (gamma) now VBM                        336                      35                       0%
Data last updated Oct 12, 2021                                                   B.1.617.2 (delta)                      4,617 (↑668)              82 (↔)                     100%
Source: https://covid.cdc.gov/covid-data-tracker/#variant-proportions and MDSS
                                                                                      * 534 cases within MDOC; ¶ 41 cases with county not yet determined; now only Delta remains a VOC
                                  National                                                                 Public Health                   Other                          Science
Special Populations                                               Spread          Severity
                                 Comparison                                                                 Response                   Indicators                         Roundup
You can also read