Investor Presentation Q3 CY17 Results - Mahindra CIE Automotive Limited 24th Oct 2017 Mumbai
←
→
Page content transcription
If your browser does not render page correctly, please read the page content below

Investor Presentation
Q3 CY17 Results
Mahindra CIE Automotive Limited
24th Oct 2017 │ Mumbai

                                  1
2
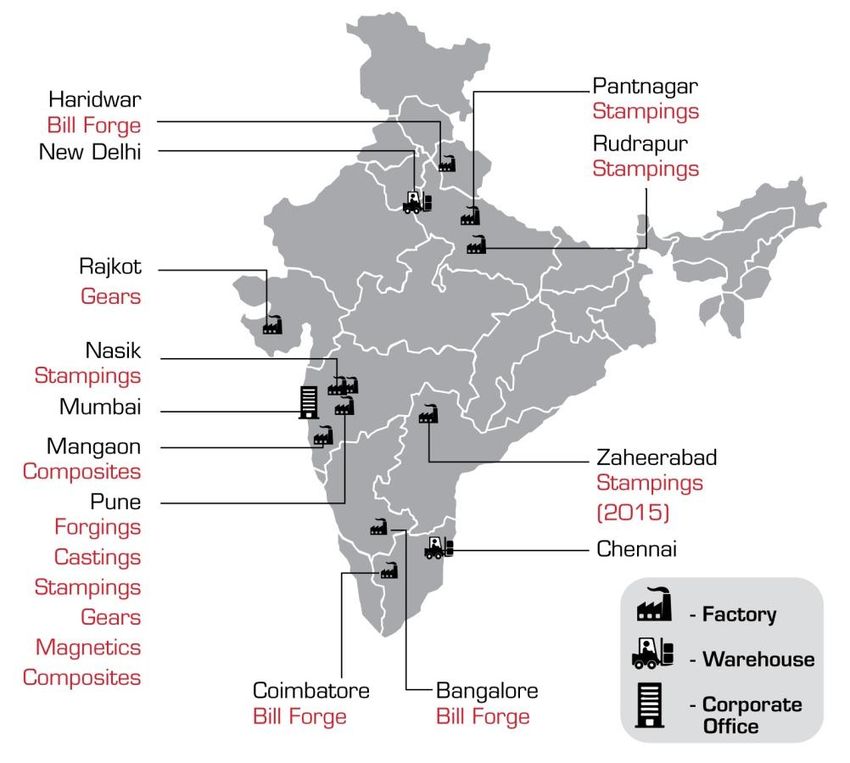
MCIE Global
Plant Locations and Key Products

  India                                Europe

                                           Truck Forgings : 4 Location in Germany & UK; Focus: Trucks

                                           PCar Forgings : 3 Locations in Spain & Lithuania; Focus:
                                           Cars

                                           Gears : 1 Location In Italy; Focus: Off Road

                                   3
MCIE Global
Key Products
India Europe
Forgings Castings Forgings (Germany + UK)
Ductile iron castings like housings,
Crankshafts & Stub axles Forged manifolds, turbochargers &
& Machined crankshafts – cast & machined
Basket of forged & machined parts for the European truck market in Europe
Bill Forge Strong presence in Front Axle Beams & Steel Pistons
Forgings (Spain + Lithuania)
Races, retainers, CV Inners, CV Outers
Stampings Gears
Strong presence in Crankshafts, Common Rails & CV Joints in Europe
Stampings & Stamped
Gears & Shafts
Assemblies
Gears (Italy)
Magnetic Products Composites
Pioneers in ferrite
manufacturing in India High precision Gears & Shafts for engines, transmissions, clutch & pumps
Thermoset Composite
Global supplier of automotive
Materials & Products
magnets
4MCIE India
Q3 CY2017 Results
Financial Update Market Update
(Production)
(INR Mio) Jul-Sep Change Jul-Sep Apr-Jun Jul-Sep 2017 Jul-Sep 2017
2017 2016 2017 v/s v/s
Jul-Sep 2016 Apr-Jun 2017
Sales 6,821 +64% 1 4,148 6,356
(without Excise) PV -1.2% 11.1%
EBITDA (*) 984 +87% 524 875
UV 11.9% 11.6%
EBITDA% 14.4% 12.6% 13.8% LCV 12.0% 14.8%
EBIT (*) 683 +155% 268 572 MHCV 11.6% 65.2%
EBIT % 10.0% 6.4% 9.0%
Two Wheelers 12.6% 11.2%
EBT 675 +178% 243 565 Tractors 19.8% 3.9%
EBT% 9.9% 5.8% 8.9%
(*) EBITDA: EBIT + Depreciation , EBIT: EBT + financial results. Key 10.5% 11.7%
Sales is only product sales and does not include any other operating or non operating Customers(#)
income while EBITDA includes all income
# M&M, Maruti and Tata Motors combined constitute more than 50% of MCIE India
(1) The growth without Bill Forge in India for Q3 C17 has been 21%. Increase, mainly business – The growth of MCIE’s customers weighted as per their share of business in
in Gears, Stampings and Forgings MCIE India for the Jul-Sep 2017 growth is 12.9% and sequential growth is 10.7%
As per International classification the segment defined asMCIE India
9M CY2017 Results
Financial Update Market Update
(Production)
(INR Mio) Jan-Sep 2017 Change Jan-Sep 2016 Jan-Sep 2017
v/s
Jan-Sep 2016
Sales 19,411 +56%1 12,454
(without Excise) PV 5.1%
EBITDA (*) 2,649 +95% 1,361
UV 13.1%
EBITDA% 13.6% 10.9% LCV 3.7%
EBIT (*) 1,766 +131% 765 MHCV -13.4%
EBIT % 9.1% 6.1%
Two Wheelers 7.1%
EBT 1,755 +131% 759 Tractors 23.3%
EBT% 9.0% 6.1%
(*) EBITDA: EBIT + Depreciation , EBIT: EBT + financial results. Key Customers(#) 12.7%
Sales is only product sales and does not include any other operating or non
operating income while EBITDA includes all income
# M&M, Maruti and Tata Motors combined constitute more than 50% of MCIE India
(1) Growth without Bill Forge in MCIE India for 9m CY 2017has been about 15% business – The growth of MCIE’s customers weighted as per their share of business in
MCIE India for the period Jan-Sep 2017 growth is 10.5%
As per International classification the segment defined asMCIE Europe
Q3 CY2017 Results
Financial Update Market Update
(Production)
(INR Mio) Jul-Sep Change Jul-Sep Apr-Jun
2017 2016 2017
Sales 9,154 +16% 1 7,864 8,943 Jul-Sep 2017 Jul-Sep 2017
(without Excise) v/s v/s
Jul-Sep 2016 Apr-Jun 2017
EBITDA (*) 1,127 +31% 861 1,183
Passenger 4.9% -12.7%
EBITDA% 12.3% 10.9% 13.2% Vehicles
EBIT (*) 768 +39% 552 793
EBIT % 8.4% 7.0% 8.9%
Commercial Vehicle production data is as of now available for
EBT 663 +55% 429 696 H1 CY17 and it has shown a growth of -4.5% as compared with
the same period of the previous year.
EBT% 7.2% 5.4% 7.8%
(*) EBITDA: EBIT + Depreciation , EBIT: EBT + financial results.
Sales is only product sales and does not include any other operating or non operating income while EBITDA includes all income
(1) Growth in Euro terms for Q3 CY17 has been 22.6% driven by growth in Metalcastello and Forgings Lithuania
Note
• Exchange Rates considered for Jul-Sep 2017, Jul- Sep 2016 and Apr-Jun 2017 are 72.73, 75.01 and 71.24 INR/Euro respectively
• EBITDA % drop from Q2 2017 due to stock consumption in August. EBITDA % over revenues (Sales + stock variation) is 12.7% in both periods.
7MCIE Europe
9M CY2017 Results
Financial Update Market Update
(Production)
(INR Mio) Jan-Sep 2017 Change Jan-Sep 2016
Sales 27,138 +6% 1 25,717 Jan-Sep 2017
(without Excise) v/s
Jan-Sep 2016
EBITDA (*) 3,495 +17% 2,989
Passenger Vehicles 2.1%
EBITDA% 12.9% 11.6%
EBIT (*) 2,366 +24% 1,902
EBIT % 8.7% 7.4%
Commercial Vehicle production data is as of now available for
EBT 2,038 +38% 1,476 H1 CY17 and it has shown a growth of -4.5% as compared with
the same period of the previous year.
EBT% 7.5% 5.7%
(*) EBITDA: EBIT + Depreciation , EBIT: EBT + financial results.
Sales is only product sales and does not include any other operating or non operating income while EBITDA includes all income
(1) Growth in Euro terms for 9m CY17has been 11.1% driven by growth in Metalcastello and Forgings Lithuania
Note
1. Exchange Rates considered for Jul-Sep 2017, Jul- Sep 2016 and Apr-Jun 2017 are 72.73, 75.01 and 71.24 INR/Euro respectively
8MCIE Consolidated
Q3 CY2017 Results
Jul-Sep 2017 Change Jul-Sep 2016 Apr-Jun 2017
Sales 15,903 +34% 11,906 15,248
(without Excise)
EBITDA (*) 2,101 +52% 1,385 2,058
EBITDA% 13.2% 11.6% 13.5%
EBIT (*) 1,436 +75% 819 1,353
EBIT % 9.0% 6.9% 8.9%
EBT 1,334 +99% 672 1,233
EBT% 8.4% 5.6% 8.1%
(*) EBITDA: EBIT + Depreciation , EBIT: EBT + financial results.
Sales is only product sales and does not include any other operating or non operating income while EBITDA includes all income
Note
1. Exchange Rates considered for Jul-Sep 2017, Jul- Sep 2016 and Apr-Jun 2017 are 72.73, 75.01 and 71.24 INR/Euro respectively
2. Sales growth due to Billforge integration and Stampings, Gears and Forging’s organic growth
3. Positive Exchange rate impact in Billforge Mexico and finance cost reduction due to lower debt
9MCIE Consolidated
9M CY2017 Results
(INR Mio) Jan-Sep 2017 Change Jan-Sep 2016
Sales 46,362 +22% 37,914
(without Excise)
EBITDA (*) 6,103 +40% 4,349
EBITDA% 13.2% 11.5%
EBIT (*) 4,077 +53% 2,665
EBIT % 8.8% 7.0%
EBT 3,737 +67% 2,235
EBT% 8.1% 5.9%
(*) EBITDA: EBIT + Depreciation , EBIT: EBT + financial results.
Sales is only product sales and does not include any other operating or non operating income while EBITDA includes all income
Note
1.Exchange Rates considered for Jul-Sep 2017, Jul- Sep 2016 and Apr-Jun 2017 are 72.73, 75.01 and 71.24 INR/Euro respectively
2.As on 30 Sep 2017, the Capex done is INR 2,371 Million
10Other Details
Q3 CY 2017 Results
(INR Mio)
India Europe Consolidated
Q3 CY 17 Q2 CY 17 Q3 CY 16 Q3 CY 17 Q2 CY 17 Q3 CY 16 Q3 CY 17 Q2 CY 17 Q3 CY 16
Excise Duty 0 754 456 0 754 456
Other Operating
Revenue 374 332 255 285 274 337 652 601 591
Other Income 24 34 41 50 31 38 49 63 62
11Annexure 1:
- Results Declared to SEBI
123 Q - 2 0 1 7 M C I E STA N DA LO N E ₹ in Lakhs
STANDALONE
Part-I Quarter Ended Nine Months Ended Year Ended
Particulars Sep,30 2017 Jun,30 2017 Sep,30 2016 Sep,30 2017 Sep,30 2016 Dec 31, 2016
Un Audited Un Audited Un Audited Un Audited Un Audited Audited
I Revenue from operations 48,424.58 50,374.91 44,349.56 150,047.46 133,955.44 178,689.46
II Other Income 310.21 425.80 599.81 1,027.32 1,553.40 2,166.06
III Total Revenue (I+II) 48,734.79 50,800.71 44,949.37 151,074.78 135,508.84 180,855.52
IV Expenses
a) Cost of materials consumed 25,097.28 23,898.47 20,252.58 74,206.29 61,179.28 81,528.45
b) Changes in stock of finished goods, work-in process 796.14 (937.45) 498.30 (95.26) 20.97 465.64
c) Employee benefit expense 5,712.23 5,394.00 5,639.66 16,691.62 16,649.14 22,272.99
d) Finance costs 124.24 184.16 196.76 563.51 408.24 710.45
e) Depreciation and amortisation expenses 1,775.80 1,822.94 1,771.59 5,310.26 5,323.56 7,102.90
f) Excise Duty on Sales (Refer Note 6) - 5,423.48 4,280.51 10,266.35 13,046.63 17,671.55
g) Other expenses 11,983.41 12,325.35 10,188.83 35,560.08 31,784.01 42,313.91
Total Expenses (IV) 45,489.10 48,110.95 42,828.23 142,502.85 128,411.83 172,065.89
V Profit before exceptional items and tax (III-IV) 3,245.69 2,689.76 2,121.14 8,571.93 7,097.01 8,789.63
133 Q - 2 0 1 7 M C I E STA N DA LO N E - C o nt i n u e d ₹ in Lakhs
Rs.in Lakhs
STANDALONE
Part-I Quarter Ended Nine Months Ended Year Ended
Particulars Sep,30 2017 Jun,30 2017 Sep,30 2016 Sep,30 2017 Sep,30 2016 Dec 31, 2016
Un Audited Un Audited Un Audited Un Audited Un Audited Audited
VI Exceptional item (Refer Note 5) - - - - 901.75 901.75
VII Profit before tax (V-VI) 3,245.69 2,689.76 2,121.14 8,571.93 6,195.26 7,887.88
VIII Tax expenses
1) Current tax 1,338.19 729.79 938.57 3,328.26 2,170.14 2,734.96
2) Deferred tax (128.68) 195.32 (222.05) (221.08) (26.46) 7.84
Total tax expense (VIII) 1,209.51 925.11 716.52 3,107.18 2,143.68 2,742.80
IX Profit after tax from continuing operations(VII-VIII) 2,036.18 1,764.65 1,404.62 5,464.75 4,051.58 5,145.08
143 Q - 2 0 1 7 M C I E STA N DA LO N E - C o nt i n u e d ₹ in Lakhs
STANDALONE
Part-I Quarter Ended Nine Months Ended Year Ended
Particulars Sep,30 2017 Jun,30 2017 Sep,30 2016 Sep,30 2017 Sep,30 2016 Dec 31, 2016
Un Audited Un Audited Un Audited Un Audited Un Audited Audited
IX Profit for the period (VII- VIII) 2,036.18 1,764.65 1,404.62 5,464.75 4,051.58 5,145.08
X Other Comprehensive income
A i) Items that will not be reclassified to profit or loss - - - - - (289.85)
ii) Income tax relating to items that will not be reclassified
- - - - 100.31
to profit or loss -
B i) Items that will be reclassified to profit or loss - - - - - -
Income tax relating to items that will be reclassified to
- -
ii) profit or loss - - - -
Total Other Comprehensive Income - - - - - (189.54)
XI Total comprehensive income for the period (IX+X) 2,036.18 1,764.65 1,404.62 5,464.75 4,051.58 4,955.54
Earnings per equity share face value ₹ 10 each
1) Basic 0.54 0.47 0.43 1.44 1.25 1.53
2) Diluted 0.54 0.47 0.42 1.44 1.23 1.52
153 Q - 2 0 1 7 M C I E S E B I R E S U LT N O T E S – P a r t 1
STATEMENT OF STANDALONE UNAUDITED RESULTS FOR THE QUARTER AND NINE MONTHS ENDED SEPTEMBER 30, 2017.
Notes:
1 The statement has been prepared in accordance with the Companies (Indian Accounting Standards) Rules, 2015 (IndAS) prescribed under Section 133 of
the Companies Act, 2013 and other recognized accounting practices and policies to the extent applicable.
2 The Company has invested Rs. 75,511 lakhs in Mahindra Forgings Europe AG (MFE AG), Germany through its wholly owned subsidiaries in Mauritius namely
Mahindra Forgings International Limited (MFIL) and Mahindra Forgings Global Limited (MFGL). Due to a significant decline in demand on account of
economic downturn in Europe and certain one-time costs, which affected the results of last 2 years of MFE AG, the Management has performed an
impairment assessment and concluded that there is no dimunition in the value of these investments. The Company expects gradual recovery in market
demand and the actions initiated by the management team of MFE AG (such as operational efficiencies, close monitoring, improving price realisation
and reduction of people) under active guidance and supervision of CIE's European Techinical team are expected to yield results from 2018.
The auditors while taking note of the actions initiated by the management, have mentioned this as a “Matter of Emphasis” in their report.
3 During the quarter ended March 31, 2017, the Company concluded negotiations for a price increase with vendors with a corresponding increase in
sales price to two of its customers w.e.f April 1, 2016. This has resulted in increase in revenue by Rs. 3,743 lacs with corresponding similar increase in
cost of material consumed for the nine months ended September 30, 2017.
163 Q - 2 0 1 7 M C I E S E B I R E S U LT N O T E S – C o n t i n u e d
STATEMENT OF STANDALONE UNAUDITED RESULTS FOR THE QUARTER AND NINE MONTHS ENDED SEPTEMBER 30, 2017.
Notes:
4 The Company manufactures automotive components and is of the view that it constitutes a single business segment in accordance with IndAS 108
“Operating Segments” notified pursuant to Companies (Accounting Standard) Rules, 2015.
5 The exceptional item included in the results for the nine months ended September 30, 2016 and year ended December 31, 2016 pertains to Voluntary
Retirement Scheme in the Magnetic Plant of the Company.
6 In accordence with the requirements of Ind AS,revenue for the quarter ended September 2017 is net of Goods and Services Tax ('GST').
However, revenue for the quarter ended June 2017, and quarter and nine months ended September 2016 and year ended December 2016 is inclusive of
excise duty.
7 The above results have been subjected to Limited Review by the auditors of the Company in terms of Regulation 33 of the Securities and Exchange
Board of India (Listing Obligations and Disclosure Requirements) Regulations, 2015 (LODR) reviewed by the Audit Committee and approved by the Board
of Directors of the Company at their respective meetings held on October 24, 2017.
8 Previous period’s / year’s figures have been regrouped / reclassified, wherever necessary to conform to the current period’s classification.
For and on behalf of the Board of Directors,
Place : Mumbai Executive Director
17Annexure 2: Market Overview and Outlook
18India Market: Key Segments Update - Quarterly
Demand Improving
Market - Production Numbers
Jan - Mar Apr - Jun Jul - Sep Jan - Sep
Period Units Δ% Units Δ% Units Δ% Units Δ
PV 728,142 9.5% 643,339 8.0% 714,642 -1.2% 2,086,123 5.1%
UV 233,793 12.7% 242,641 15.0% 270,703 11.9% 747,137 13.1%
LCV 127,565 1.2% 112,135 -1.9% 128,745 12.0% 368,455 3.7%
MHCV 100,036 -3.0% 49,942 -45.3% 82,515 11.6% 232,493 -13.4%
2 Wheelers 4,671,778 -1.2% 5,637,231 9.0% 6,267,056 12.6% 16,567,065 7.1%
Tractors 167,659 40.5% 195,737 14.7% 230,400 19.8% 566,796 23.3%
Source: SIAM, TMA
* Δ % - means comparison of Quarter volumes of this financial year with that of the same quarter of the previous financial year. E.g. Q2 C17 Volume is compared to Q2 C16
volume respectively.
19Market Outlook - India
• PVs+ UVs:
“Good monsoon, new launches and stable fuel prices to support growth in 2017-18. Lower effective tax rates post GST to partially
offset raw material price increases in 2017-18.”… CRISIL Research report
• CVs:
“According to CRISIL Research MHCV sales growth is expected to decline marginally in 2017-18, because of dwindling
replacement demand and the high cost of ownership of BS-IV trucks and advanced buying in 2016-17, due to the implementation of
the BS-IV norm.” … CRISIL Research report
• Tractors:
“CRISIL Research expects Tractor sales to rise in 2017-18 with normal monsoon forecast and announcement of farm loan
waiver.”… CRISIL Research report
• Two Wheelers:
“CRISIL Research estimates that, the overall two wheeler industry (including exports) grew by 10.3% y-o-y as a result of positive
domestic demand and an growing demand from exports which is boosting the sales volumes. ” … CRISIL Research report
.
20Europe Market Update - Quarterly
Market picking up
Market - Production Numbers
Passenger Vehicles (Mn Units)
Period C16 Δ%
9M CY 2017 16.44 2.1%
Q3 CY 2017 4.95 4.9%
Q2 CY 2017 5.67 -3.5%
Q1 CY 2017 5.82 5.6%
Commercial Vehicle production data is as of now available for H1 CY17 and it has shown a growth of -4.5% as compared with the same period
Source: IHS Global
of the previous year.
*Δ% Change means comparison of Quarter volumes of this financial year with that of the same quarter of the previous financial year. E.g.
Q2 C17 Volume is compared to Q2 C16 volume respectively.
21Market Outlook - Europe
Growth returning, but gradually
• EU – Cars:
‒ IHS Global has forecasted that the Passenger Vehicle production will grow at a slow but
steady pace of 0.7% CAGR.
• EU - CVs:
‒ IHS Global has forecasted that the Medium and Heavy Commercial Vehicle production will
grow at a steady pace of 2.1% CAGR
22 22Annexure 3: Frequently Asked Questions
23Mahindra CIE : Business Overview
CY2016 Result
India Europe
Germany + UK Italy Spain + Lithuania
Others, Others,
MHCVs, Other, 14% Truck
7% 8% Cars,
Key Segments
15% 17%
28% Truck,
4%
Tractors
, 10% Cars, 4%
2Wheel
ers, 11%
Uvs, Earth
LCVs, Moving, Agri Cars,
12% 24% Truck 25% M/c, 83%
85% 53%
Top 3 = 51% Top 5 = 52% Top 3 = 51% Top 3 = 71%
OEM Dependence
Top Customers: Top Customers: Top Customers: Top Customers:
M&M, Maruti, TML Daimler, Renault, VW Group, CAT, Fiat, ZF, Ford Renault, VW, Daimler,
DAF, MAN, Caterpillar, Volvo, GKN, JLR, GM
Kolbenschmidt, GKN, JLR
24Mahindra CIE : Business Impact
Electric Vehicle
INDIA
Technology Product Speciality Focus Areas Key Customers Based on CY 2016 Revenue Revenue in Rationale
possible Affected
INR Million EUR Million parts
Forgings 11,306 152
India Crankshafts - As forged and Machined, Stub Axles -As forged Passenger & Utility Vehicles and M&M, Maruti Suzuki India Limited, Tata 4,298 58 Roughly 75% is exposure to crankshafts out of which about 2/3rd
and Machined Tractors Motors 27 is from Pass cars.
Bill Forge India * 2 Wheelers: Steering races and engine valve retainers Passenger Vehicles and Two Wheelers Hero, Bajaj, HMSI and TVS, Ford, GKN, NTN, 7,008 94 NIL Major exposure to Driveline and Steering and Suspension parts so
Pass Vehicles: constant velocity joints, tulips, steering shafts, Nexteer, RaneNSK not likely to be affected
steering yokes and wheel hubs
Stampings 7,047 95
India Sheet Metal Stampings, Components and Assemblies Passenger & Utility Vehicles M&M, Tata Motors 7,047 95 NIL Stamped panels unlikely to be affected
Castings 4,058 54
India Turbocharger Housings, Axle & Transmission Parts Passenger & Utility Vehicles, M&M, Honeywell, Cummins , Hyundai, JCB, 4,058 54 NIL Housings are exposure to the MHCV and Construction Equipment
Construction Equipment & Earthmoving Automotive Axle, New Holland, Dana India CV, segment
, Tractors and Tier 1 John Deere
Magnetic 1,487 20
Products
India Soft and Hard Magnets, Magnetic Induction Lighting Tier 1 of Passenger Vehicles, Utility Denso, Sumida, Varroc, Intica, Mitsuba 1,487 20 NIL Supplier to automotive electronics sub system manufacturer
Vehicles, Two Wheelers hence unlikely to be affected
Composites 978 13
India Compounds, Components, and Products Electrical Switchgear, Auto Components L&T Switchgear, Phoenix Mecano, TVS, M&M, 978 13 NIL Non moving parts hence unlikely to be affected
Volvo Eicher
Gears 1,593 21
India Engine Gears, Timing Gears, Transmission Gears, Passenger & Utility Vehicles, M&M, Eaton, Caterpillar, NHFI, Turk Tractor 1,593 21 About 1/3rd exposure to pass car transmission gears which are
Transmission Dirve Shafts Construction & Earthmoving Equipment (CNH), BEML, New Holland 7 likely to be affected
INDIA TOTAL 26,469 355 34 9.4%
EUROPE
Technology Product Speciality Focus Areas Key Customers CY 2016 Revenue Revenue in Rationale
INR Million EUR Million possible Affected
parts
Forgings 30,698 412
Germany Forged and Machined parts, Front Axle Beams and Steel Heavy Commercial Vehicles Daimler AG, Man, DAF, Volvo Group, KS, Linde, 14,861 200 NIL No exposure to PV segment
Pistons AGCO, ZF, Scania, Ford, SAF Holland, Robert
UK Flashless Near Nett Forgings Passenger Vehicles Bosch 974 13 NIL no exposure to engine parts
Spain + Lithuainia Forged steel parts for Industrial Vehicles and Crankshafts, Passenger Vehicles Reanult,VW Group, Daimler, GKN, JLR, GM, 14,863 200 Galfor exposure to Pass car crankshafts about EUR 120 Million
Common Rail, Stubs, Tulips for passenger cars Fiat, DAF, Bosch, NTN, Faurecia, Dana, ZF, 120
BMW
Gears 3,637 49
Italy Engine Gears, Transmission Drive shafts, Crown Wheel Pinion Tractors, Construction & Earthmoving Caterpillar, CNH, Merritor, 3,637 49 NIL Gears for construction equipment and off road vehicles
Equipment GDLS/Mowag/Cormer, Argo, John Deere
EUROPE TOTAL 34,335 461 120 26.0%
MCIE Consolidated
TOTAL 60,804 817 154 18.8%
25Thank you 26
You can also read