FORWARD-LOOKING STATEMENTS - RAINFOCUS
←
→
Page content transcription
If your browser does not render page correctly, please read the page content below
© 2018 SPLUNK INC.

                                Forward-Looking Statements
During the course of this presentation, we may make forward-looking statements regarding future events or
the expected performance of the company. We caution you that such statements reflect our current
expectations and estimates based on factors currently known to us and that actual events or results could
differ materially. For important factors that may cause actual results to differ from those contained in our
forward-looking statements, please review our filings with the SEC.

The forward-looking statements made in this presentation are being made as of the time and date of its live
presentation. If reviewed after its live presentation, this presentation may not contain current or accurate
information. We do not assume any obligation to update any forward-looking statements we may make. In
addition, any information about our roadmap outlines our general product direction and is subject to change
at any time without notice. It is for informational purposes only and shall not be incorporated into any contract
or other commitment. Splunk undertakes no obligation either to develop the features or functionality
described or to include any such feature or functionality in a future release.
Splunk, Splunk>, Listen to Your Data, The Engine for Machine Data, Splunk Cloud, Splunk Light and SPL are trademarks and registered trademarks of Splunk Inc. in
the United States and other countries. All other brand names, product names, or trademarks belong to their respective owners. © 2018 Splunk Inc. All rights reserved.
© 2018 SPLUNK INC.

Using Splunk as an
Essential Component
of a Continuous
Integration Pipeline
Scott Lu, Patrick Ogdin, Eddie Shafaq

Oct, 2018
© 2018 SPLUNK INC.

                                      Agenda
▶   Introduction (Scott & Patrick)
▶   Internal Customer CI/CD Splunk Scenarios
    • Pipeline Visualization
    • Test Result Triage System (ARTs)
    • Performance Testing Results
    • Developer Portal
▶   Introduction (Eddie)
▶   Infrastructure Engineering CI/CD Splunk Scenarios
    • Splunk/Jenkins
    • Distcc
    • Build Parallelization
    • Test Parallelization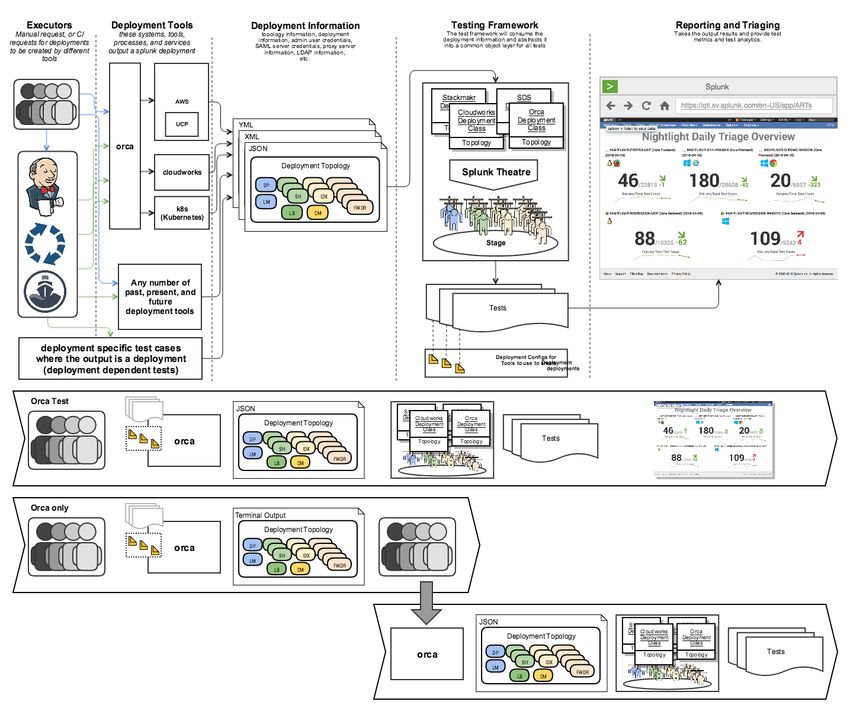
© 2018 SPLUNK INC.

                         Our Speakers

                                        v

  PAT R IC K O G D IN                                          SC O T T L U

Principal Product Manager                             Principal Software Engineer

                 M O D E R AT E D B Y G R E E N T R A C K S U I T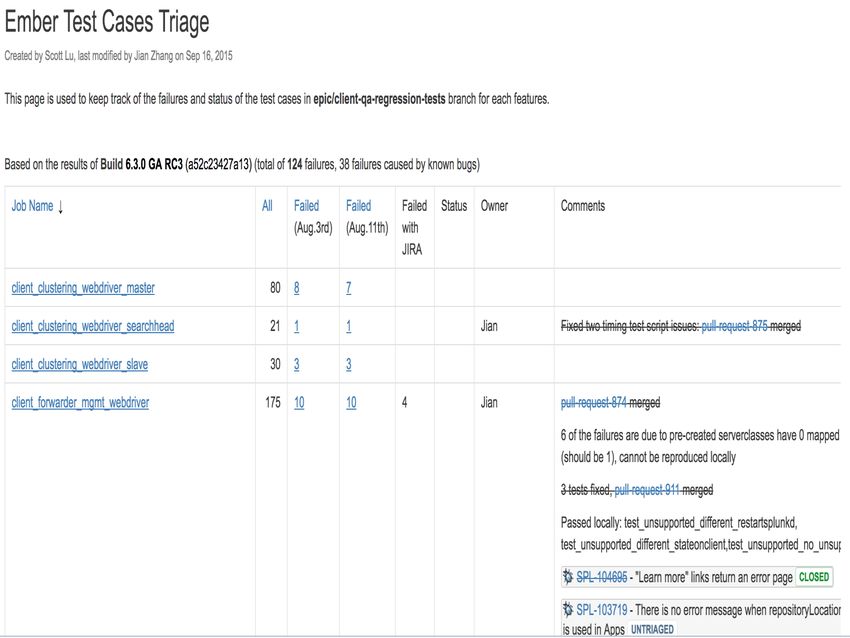
© 2018 SPLUNK INC.

                              Our Speakers

Patrick Ogdin                           Scott Lu
Principal Product Manager               Principal Software Engineer
Splunker since 2008. Working on         Joined Splunk since 2015. Mainly
Splunk Performance Testing and          focusing on improving test framework
internal Reporting for our Continuous   and designing automation test cases
Integration Pipeline. Previously        for UI testing. Also developed an
Product Manager for Splunk              effective test result triage system
Enterprise.                             using Splunk.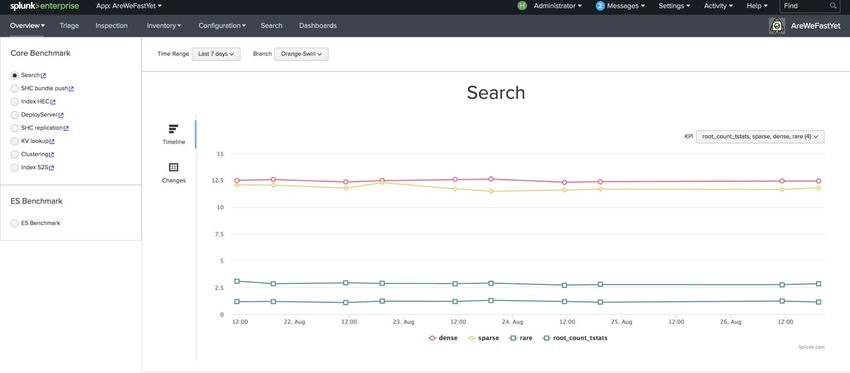
© 2018 SPLUNK INC.

                                  Introduction
                               Why Splunk for CI Use Cases

▶   Multiple critical systems working together
    • Some built and hosted internally
    • Others consumed as Cloud services
    • Diverse data sources
▶   Need Health & Performance Data (standard troubleshooting)
    • CPU/Mem/IO
▶   Need Application/Service Level Visibility
    • Build process
    • Test platform
    • Storage
▶   Engineering Productivity
    • Test results
    • Open stories/tasks/bugs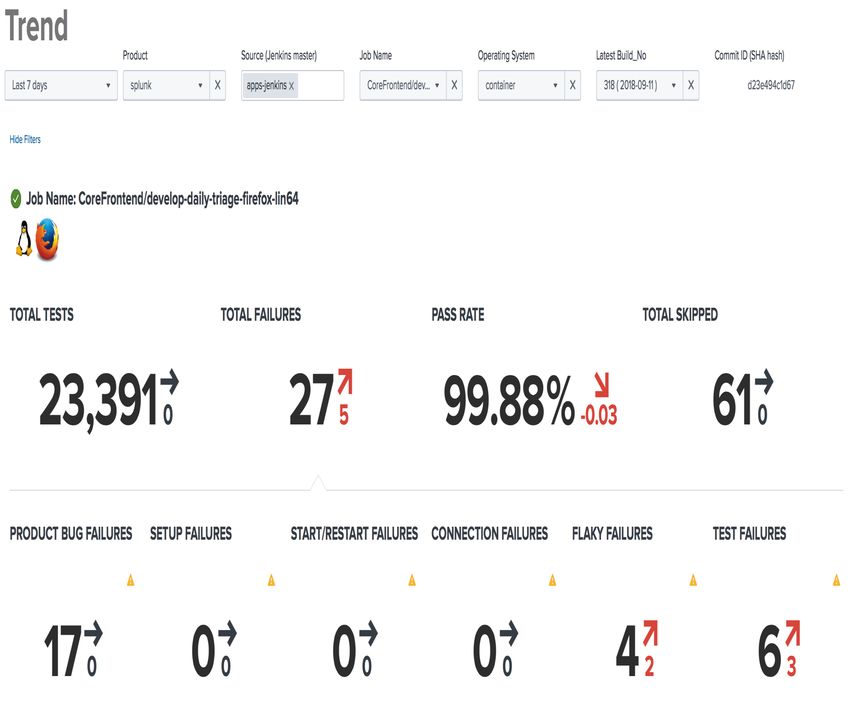
© 2018 SPLUNK INC.

Problem: Building Software is Complicated
© 2018 SPLUNK INC.

Internal Customer
     CI/CD Splunk
         Scenarios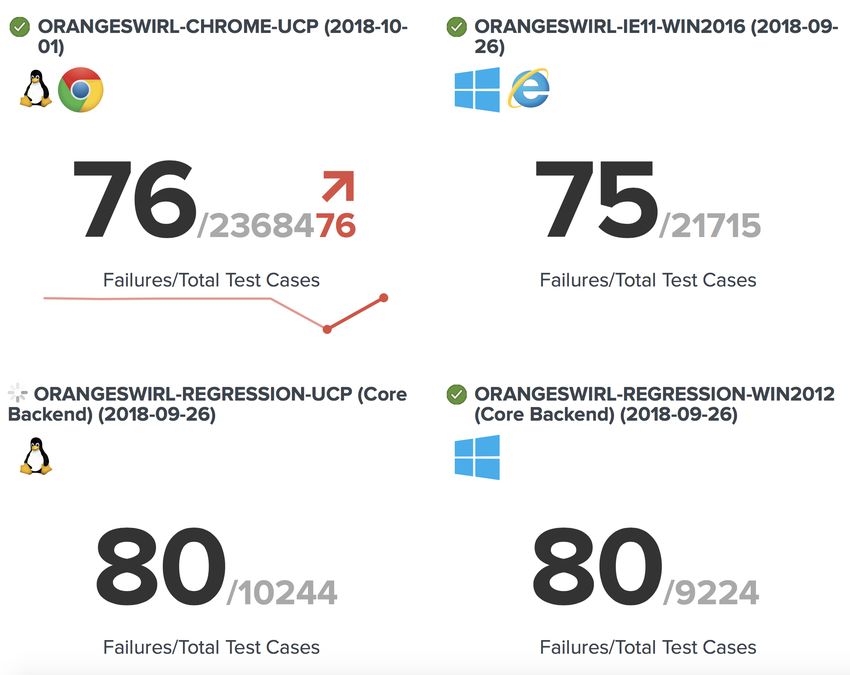
© 2018 SPLUNK INC.
Splunk CI/CD Use Cases
Pipeline Test
Result Triage Performance Developer Portal
Visualization System (ARTs)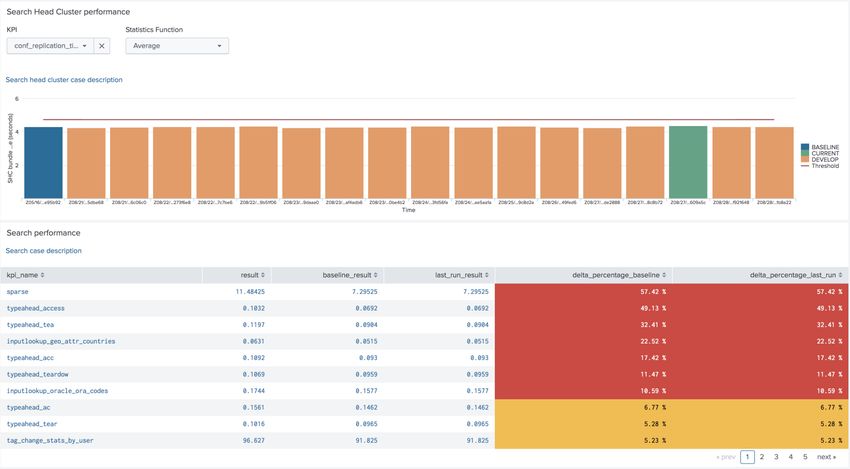
© 2018 SPLUNK INC.

Pipeline Visualization
© 2018 SPLUNK INC.

    Pipeline Visualization
                Problem

▶   Hard to track jobs in Jenkins
▶   Lost in console logs
▶   How to take actions accordingly?
© 2018 SPLUNK INC.
Pipeline Visualization
Solution
▶ Make it flat and easy to access
▶ Make it obvious and intuitive
▶ Make it informative and
comprehensive© 2018 SPLUNK INC.
Pipeline Visualization
Highlights
▶ Mimic the nature of Jenkins
workflow
▶ Easy to pinpoint the issue
▶ Take action accordingly© 2018 SPLUNK INC.
Test Result Triage System
ARTs© 2018 SPLUNK INC.
Test Triage System
Problem
▶ Too many jobs
to look at
▶ Lack of
interaction
▶ Hard to
collaborate
among teams© 2018 SPLUNK INC.
Test Triage System
Old Approach
▶ Heavy manual work
▶ Stale information
▶ Not scalable© 2018 SPLUNK INC.
Test Triage System
Solution
▶ ARTs (Automation Result
Triage system)© 2018 SPLUNK INC.
ARTs Highlights
Overview© 2018 SPLUNK INC.
ARTs Highlights
Trend© 2018 SPLUNK INC.
ARTs Highlights
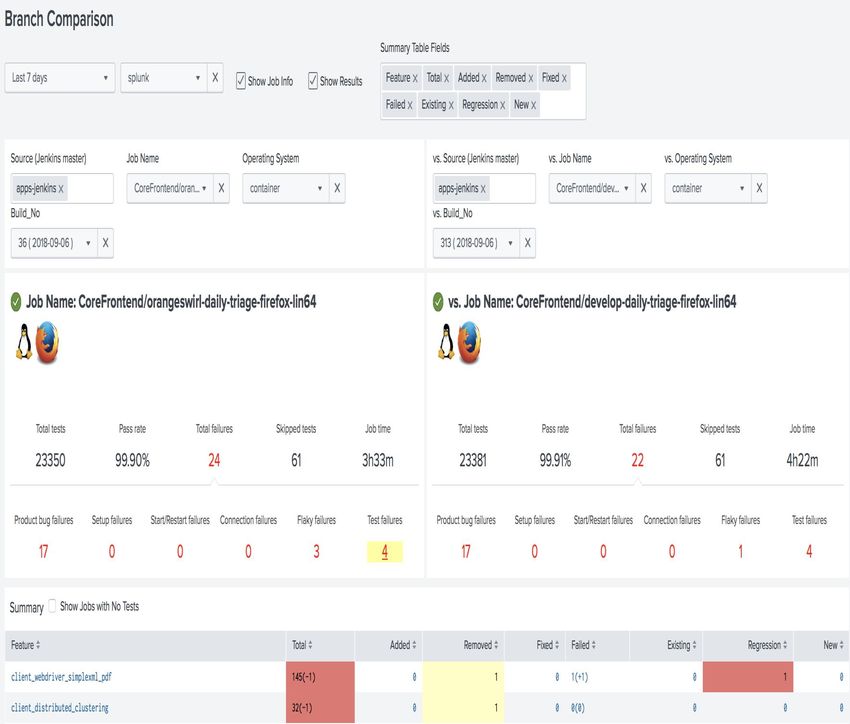
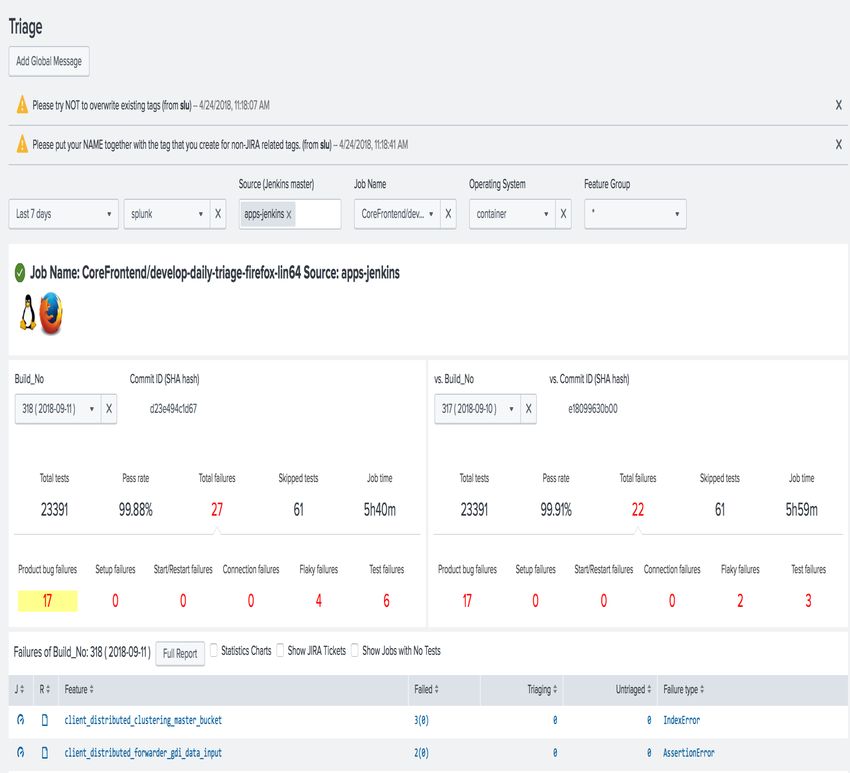
Triage© 2018 SPLUNK INC. ARTs Highlights Branch Compare
© 2018 SPLUNK INC.

Performance
© 2018 SPLUNK INC.

             Use Case - Performance Testing Results
                                           Problem

▶   Performance Testing yields lots of results across several Splunk products
    • Splunk Enterprise feature regression
      • Ex. Is Index Clustering replication getting slower?
    • Enterprise Security
      • System level benchmarks to find performance regressions across versions
    • Splunk Cloud
      • Pushing limits on Splunk features
▶   Proliferation of result formats
▶   Lots of manual work to compare and analyze test results
▶   Visualization and Trendspotting is a nightmare
▶   Variable Testing Schedules
    • Performance tests run on-demand
    • Performance tests run on a fixed schedule
© 2018 SPLUNK INC.
Performance Testing Results
Solution
▶ AreWeFastYet
• One-stop-shop for scheduled and on-demand testing results
• Interface for user defined rules to set KPIs and perform regression checks
• Anomaly detection and alerting
• Automatically generated visualization for test results and trending
• Enable easy triage and profiling (future work)© 2018 SPLUNK INC.
Performance Testing Results
Highlights
▶ Daily Benchmark Results Trending© 2018 SPLUNK INC.
Performance Testing Results
Highlights
▶ Test Results Comparison and Triage© 2018 SPLUNK INC. Developer Portal
© 2018 SPLUNK INC.

                    Use Case - Developer Portal
                                      Problem

▶   Daily development info is distributed across many systems
▶   Difficult to onboard new engineers to CI/CD platform

                                    As a Splunker…
                Morning                                         Afternoon
© 2018 SPLUNK INC.
Developer Portal
Solution
▶ Centralized and consolidated portal
▶ Dashboards and tools for different personas
▶ Easy to work with other systems, such as JIRA, Bitbucket, Jenkins etc.
▶ Search for ad-hoc connections
▶ Easy to use personal dashboard ▶ Follow up action links navigating to other systems
▶ Widgets for specific need ▶ Bookmark items care most© 2018 SPLUNK INC.
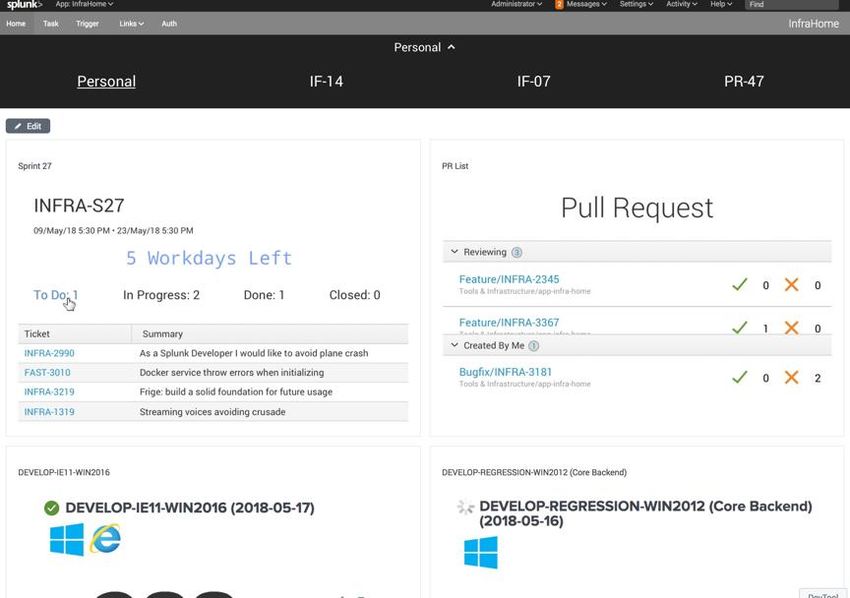
Developer Portal
Highlights
▶ Home Page
• Onboard Wizard
• Team View
• Widgets
▶ Task Page
• Integration with Jira, Bitbucket, Jenkins, etc
• More integration is coming, like GitLab
▶ Notification
• Slack integration, TODO list© 2018 SPLUNK INC.
Infrastructure
Engineering CI/CD
Splunk Scenarios
Using Splunk to measure development productivity and solve for
speed in developer teams by collecting build data. See how Splunk
“builds Splunk with Splunk,” and how Splunk helps developers
collaborate through tools such as Git, JIRA, Jenkins and Slack.© 2018 SPLUNK INC. EDDIE SHAFAQ Splunk Infrastructure
© 2018 SPLUNK INC.

                              Our Speaker

Splunk Infrastructure
First joined Splunk in August 2011 as a Systems Administrator. Aided in
expanding engineering support in "exotic operating system" (AIX, HPUX, S390X
and PowerLinux). Served as a member of release engineering to address
operational and infrastructure support for products team. Currently serving an
infrastructure leadership role around Core Engineering and Release Engineering
services.
© 2018 SPLUNK INC.
The Goal Set by Management
▶ Improve Developer Productivity
• Our contribution: Get CI test results to developers faster© 2018 SPLUNK INC.
System Before Optimization
Bitbucket Jenkins Bitbucket
Developer/Bitbucket Bitbucket Jenkins Bitbucket
The system had 15 dedicated Linux agents to perform continuous
integration testing
Each job ran for approximately 54 minutes, performing a build of
Splunk and running a set of validation tests
That meant it could perform an approximate average of 17 jobs per
hour© 2018 SPLUNK INC.
System Before Optimization
If more than 17 triggers were received in a one hour period the excess
triggers were queued waiting for a Linux agent to run on
Under “normal” circumstances the system operated with minimum
delays, however during peak load periods when the pressure on
developers was the highest…
We experienced significant delays resulting in frustration and phone
calls as the engineers waited for results of the validation test jobs they
were required to run before they could commit thier work© 2018 SPLUNK INC. Our Analysis
© 2018 SPLUNK INC.

Our Analysis
Understanding the Situation
There were four factors that affected the delay developers experienced
while waiting for test results
• Build time – how long it takes to build the Splunk executables
• Test time – how long it takes to perform the required set of tests
• Queue time – how long before the test actually started to run
• Notification – how long before developers know the test results
We need to quantify each of those factors and determine what we
could do to mitigate their effects on the overall time© 2018 SPLUNK INC.
How We Collected The Data
Our jobs are well connected to Splunk
Build Agent
Build
Splunk Indexer
HTTP Event Collector
Jenkins
App
Plugin
Jenkins Master© 2018 SPLUNK INC.
The Splunk HTTP Event Collector
Simple to send custom data to your Splunk instance
In Bash
Format your data as a JSON string:
jsonData="{\"time\": 12345, \"index\": \"YourIndex\", \"sourcetype\": \"YourSourceType\", \"source\":
\"YourSource\", \"event\": \{\"YourFieldName\": \"SomeData\", more json formatted data goes here}}”
Include as much json formatted information as you need in the event section
Then execute a curl call:
curl \
--tlsv1.2 --header "Authorization: " \
--header "Content-Type: application/json" \
--request 'POST' \
--data $jsondata \
https://YourSplunkInstance/services/collector/event
Its that simple…© 2018 SPLUNK INC.
Insert your own screenshot here.
For best results, use an image sized at 1450 x 850© 2018 SPLUNK INC.
Queue Times Before Optimization
Peak load period had significant delays
150 minutes!© 2018 SPLUNK INC.
The Search We Use to Analyze Jobs
Of course this won’t work for you, but…
index="jenkins_console" host=”aJenkins.ourco.com" source="*Linux_ut_pr*" ("make -j48 || exit 0" OR
"Install the project..." OR "Core build is done" OR "run the tests again" OR "Starting backend unit
tests" OR "Package and publish Splunk" OR "starting Linux 64 test" OR "fetch the jenkins scripts
directory" OR ("nodes run >>>> STARTING ACTION" AND "Write splunk-version.txt") OR
("STARTING COMMAND" AND "Running the contrib command") OR "Done all requested steps") | rex
field=source "job/Pull_Request_Tests/job/Linux_ut_pr/(?.*)/console" | eval
buildStep=case(searchmatch("fetch the jenkins scripts directory"),"start", searchmatch("starting Linux
64 test"),"clone", searchmatch("Running the contrib command"),"chroot", searchmatch("Write splunk-
version.txt"),"contrib", searchmatch("make -j48 || exit 0"),"setup", searchmatch("Core build is
done"),"build_1", searchmatch("Install the project..."), "build_2", searchmatch("Starting backend unit
tests"), "package", searchmatch("run the tests again"), "tests_1", searchmatch("Package and publish
Splunk"), "tests_2", searchmatch("Done all requested steps"), "publish") | chart values(_time) by
build_number, buildStep | eval gc = round(('clone' - 'start')/60) |eval cs = round((chroot -
'clone')/60) | eval "cb" = round((contrib - chroot)/60) | eval "bs" = round((setup - contrib)/60) |
eval "cub" = round((build_1 - setup)/60) | eval "cbc" = round((build_2 - build_1)/60) | eval "ts" =
round((package - build_2)/60) | eval "pst" = round((tests_1 - package)/60) | eval "sst" =
round(('tests_2' - 'tests_1')/60) | eval "pub" = round(('publish' - 'tests_2')/60) | search cb < 5
| search sst > 0 | search pst < 25 |chart values(pub) as Publishing, values(sst) as "Sequential
Smoke Tests", values(pst) as "Parallel Smoke Tests", values(ts) as "Test Setup", values(cbc) as "Core
Build Continues", values(cub) as "Core and UI build", values(bs) as "Build Setup", values(cb) as
"Contrib Build", values(cs) as "Chroot Setup", values(gc) as "Git Clone" by build_number© 2018 SPLUNK INC.
The Search We Use to Analyze Jobs
Collect the specific log file lines we will use in our analysis
index="jenkins_console" host=" aJenkins.ourco.com
" source="*Linux_ut_pr*" ("make -j48 || exit 0" OR
"Install the project..." OR "Core build is done" OR
"run the tests again" OR "Starting backend unit
tests" OR "Package and publish Splunk" OR "starting
Linux 64 test" OR "fetch the jenkins scripts
directory" OR ("nodes run >>>> STARTING ACTION" AND
"Write splunk-version.txt") OR ("STARTING COMMAND"
AND "Running the contrib command") OR "Done all
requested steps")© 2018 SPLUNK INC.
The Search We Use to Analyze Jobs
Extract the job number
| rex field=source
"job/Pull_Request_Tests/job/Linux_ut_pr/(?.*)/console© 2018 SPLUNK INC.
The Search We Use to Analyze Jobs
Build a table of time stamps by job number and job step
| eval buildStep=case(searchmatch("fetch the jenkins scripts
directory"),"start", searchmatch("starting Linux 64
test"),"clone", searchmatch("Running the contrib
command"),"chroot", searchmatch("Write splunk-
version.txt"),"contrib", searchmatch("make -j48 || exit
0"),"setup", searchmatch("Core build is done"),"build_1",
searchmatch("Install the project..."), "build_2",
searchmatch("Starting backend unit tests"), "package",
searchmatch("run the tests again"), "tests_1",
searchmatch("Package and publish Splunk"), "tests_2",
searchmatch("Done all requested steps"), "publish")
| chart values(_time) by build_number, buildStep limit=50© 2018 SPLUNK INC.
The Search We Use to Analyze Jobs
Calculate the deltas between job steps
| eval gc = round(('clone' - 'start')/60) |eval cs
= round((chroot - 'clone')/60) | eval "cb" =
round((contrib - chroot)/60) | eval "bs" =
round((setup - contrib)/60) | eval "cub" =
round((build_1 - setup)/60) | eval "cbc" =
round((build_2 - build_1)/60) | eval "ts" =
round((package - build_2)/60) | eval "pst" =
round((tests_1 - package)/60) | eval "sst" =
round(('tests_2' - 'tests_1')/60) | eval "pub" =
round(('publish' - 'tests_2')/60) | search cb <
5 | search sst > 0 | search pst < 25© 2018 SPLUNK INC.
The Search We Use to Analyze Jobs
Build the final table with user friendly names for display
|chart values(pub) as Publishing, values(sst) as
"Sequential Smoke Tests", values(pst) as "Parallel
Smoke Tests", values(ts) as "Test Setup",
values(cbc) as "Core Build Continues", values(cub)
as "Core and UI build", values(bs) as "Build
Setup", values(cb) as "Contrib Build", values(cs)
as "Chroot Setup", values(gc) as "Git Clone" by
build_number limit=50© 2018 SPLUNK INC.
Our Analysis
How long does each step of a job take?
• We used the previous search to chart the time each step took
Replace this with data from before improvement© 2018 SPLUNK INC.
Our Analysis
How long does each step of a job take?
• We Identified the two portions of the job that took the longest
• The Splunk build (in orange) and the validation tests (in red)© 2018 SPLUNK INC. Speeding up the Splunk Build
© 2018 SPLUNK INC.

                         Distcc Architecture
Physical Machines and                                         12 x 20 Core VMs
VMs:
                 • All DistCC Build Clients and servers use
                   the same build toolchain and chroot

                 • 15 Build agents

                 • 12 compile nodes

                 • DistCC server is used ONLY for compile

                 • make -j48
© 2018 SPLUNK INC.
DistCC VS Normal Build
Building Splunk with DistCC
▶ 24 Min Build ▶ 19 Min Build ▶ 8 Min Build
• make –j 24 • make –j 48 • make –j 48
• Web UI –j 1 • Web UI –j 1 • Web UI –j 6
• Optimal 24 core VM agent • Optimal 24 core VM agent • Optimal 24 core VM agent
• 12 DistCC hosts • 12 DistCC hosts
24m 19m 8m© 2018 SPLUNK INC.
Build Time Improvement - Results
Dramatic reduction in the overall build time
DistCC on UI build fix
24m 19m 8m© 2018 SPLUNK INC. Build Time Improvement - Results Dramatic reduction in the core compile time
© 2018 SPLUNK INC.

Speeding up Testing
© 2018 SPLUNK INC.

             Increasing Test Parallelization
Improvement in the overall test time as parallel instances were increased
                                  8->12     12->16

~23m                                 ~19m              ~17m
© 2018 SPLUNK INC.
The Final Overall Result
Overall job time reduced to ~35 minutes
• Build time reduced to under 8 minutes
• Test time reduced to under 22 minutes© 2018 SPLUNK INC. Managing the Agents
© 2018 SPLUNK INC.

                          Our Analysis
                       Breaking Down The Timing
Reducing the Pull Request Queue time
Analysis:
  • Developers are only waiting for results from pull request tests
  • Triggers on commits to some branches and all pull requests
Mitigation:
    • Use more agents for the pull request tests
    • Manage the allocation of agents to tasks -> shift resources to
      pull requests when the queue starts to climb
    • Add 5 “standby agents” with reduced capabilities that are
      powered up on demand -> smaller footprint on VM hosts
© 2018 SPLUNK INC. Before Optimization Peak load period –> significant delays
© 2018 SPLUNK INC.

  After Optimization
Recent similar trigger conditions

    12 minutes!
© 2018 SPLUNK INC.
The Search We Used to Analyze Builds
Here is what the full output of the search we presented earlier looks like© 2018 SPLUNK INC.
Thank You
Don't forget to rate this session
in the .conf18 mobile app© 2018 SPLUNK INC. Q&A
You can also read