EARNINGS RELEASE - First Quarter 2021 - Page 0 of 13
←
→
Page content transcription
If your browser does not render page correctly, please read the page content below
EARNINGS RELEASE

                   First Quarter 2021

                          Page 0 of 13
1Q21 Results
Investor Relations
FIRST QUARTER 2021 RESULTS ir@gruma.com
Tel: 52 (81) 8399-3349
www.gruma.com
San Pedro Garza García, N.L., Mexico; April 21, 2021
The first quarter reflected continued demand for our retail products in the U.S., while we witnessed a
paced recovery in the global food service industry towards pre-pandemic levels. The trends that favor
value-added tortillas and their derivative products continue and remain strong in the U.S., and the
tortilla as a whole is gaining greater acceptance as a versatile, healthier and convenient product to
include in the diets of Hispanic and non-Hispanic families. Of note, sales, EBIT, EBITDA and net
income, have generated compounded annual growth rates of 9%, 12%, 10%, and 13% respectively,
that along with other positive financial indicators relative to 1Q19, showcase the company´s strong
and consistent growth since before the pandemic. GRUMA strictly scrutinizes costs and is managing
the rising cost of corn, as volatility has continued over the year.
HIGHLIGHTS
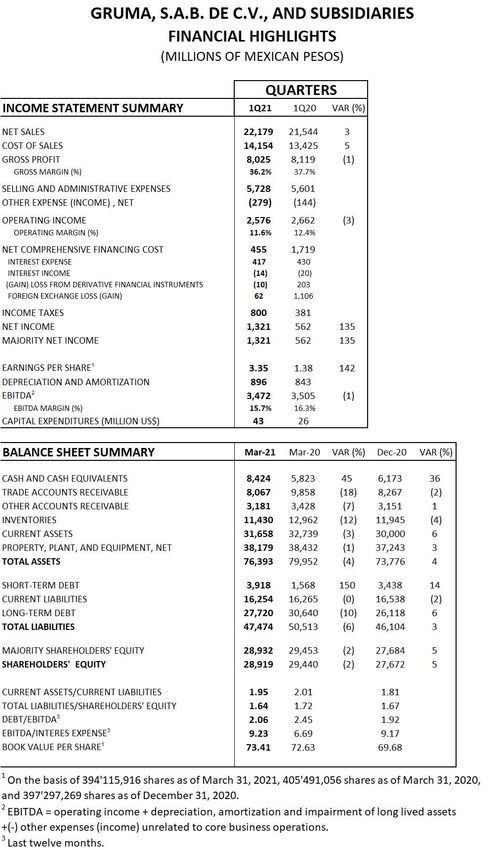
Consolidated Financial Highlights YoY YTD
Income Statement (MXN millions) 1Q21 1Q20 VAR (%) 2021
Volume (thousand tons) 1,014 1,040 (3) 1,014
Net Sales 22,179 21,544 3 22,179
Operating Income 2,576 2,662 (3) 2,576
Operating Margin (%) 11.6% 12.4% (80) bp 11.6%
Ebitda1 3,472 3,505 (1) 3,472
0
Ebitda Margin (%) 15.7% 16.3% (60) bp 15.7%
Majority Net Income 1,321 562 135 1,321
1
EBITDA = operating income + depreciation, amortization and impairment of long lived assets
+(-) other expenses (income) unrelated to core business operations.
Page 1 of 13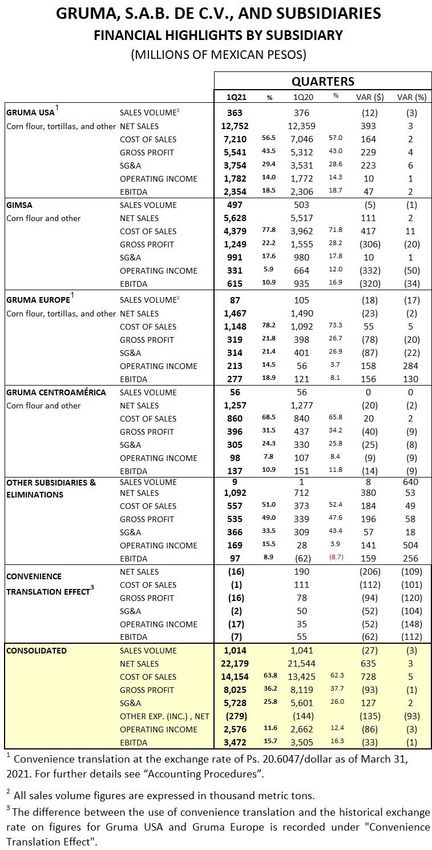
1Q21 Results

Sales volume declined 3% driven by the stockpiling of products that took place in 1H20 due to the
COVID-19 effects. In addition, freezes affected distribution and operations in the U.S., as well as in
Mexico.

Net sales increased 3% reflecting a more profitable product mix in the U.S., in addition to price
increases implemented at GIMSA in Mexico.

EBITDA decreased 1%, and EBITDA margin fell 60 basis points to 15.7% driven mainly by higher costs
of goods sold in Mexico, as a result of a higher cost of corn and higher costs related to the freeze
that took place in the U.S. and Mexico. EBITDA from non-Mexican operations represented 84% of
consolidated figures.

Majority net income rose 135% to Ps.1,321 million due to extraordinary foreign currency losses in
1Q20.

GRUMA’s net debt, measured in dollar terms, increased US$45 million during the quarter to US$1.1
billion, maintaining a net debt/EBITDA ratio of 1.5 times.

CONSOLIDATED RESULTS OF OPERATIONS
1Q21 versus 1Q20

Sales volume declined 3% to 1,014 thousand metric tons.

Net sales rose 3% to Ps.22,179 million reflecting a shift towards retail sales with a more profitable
product mix in the U.S and Europe, which offset the temporary effects from lower volume on the
back of the fundamentals mentioned above. Net sales were also supported by price increases
implemented at GIMSA in Mexico. On the other hand, net sales were impacted from the strength of
the Mexican peso (“MXN” or “peso”) versus the U.S. dollar (“USD” or “dollar”) on figures for foreign
operations when measured in peso terms. Sales from non-Mexican operations represented 75% of
consolidated figures.
Cost of sales increased 5% to Ps.14,154 million due to (1) higher raw materials and ingredients
required for the production of value-added products in the U.S.; (2) higher international corn costs
as a result of the ongoing demand from China, impacting GIMSA in Mexico; and (3) higher utility
costs amid winter freezes in the U.S. and Mexico. As a percentage of net sales, it rose to 63.8% from
62.3% given the cost dynamics mentioned above.

Selling, general and administrative expenses (“SG&A”) rose 2% to Ps.5,728 million due to higher
commissions and freight expenses, primarily in connection with higher priced products in the U.S. As
a percentage of net sales, the 3% growth in revenues absorbed the higher costs, decreasing the ratio
to 25.8% from 26.0%.

                                                                                         Page 2 of 13
1Q21 Results

Other income, net, was Ps.279 million compared to Ps.144 million last year. The Ps.135 million
change resulted from a Ps.203 million insurance claim recovery in Europe.

Operating income fell 3% to Ps.2,576 million. Operating margin declined to 11.6% from 12.4%.

EBITDA declined 1% to Ps.3,472 million, and EBITDA margin decreased to 15.7% from 16.3%.

Net comprehensive financing cost was Ps.455 million, 74% less, primarily in connection with
extraordinary foreign currency losses in 1Q20, as mentioned above.

Income taxes were Ps.800 million, 110% more than last year as pre-tax income was higher. The
effective tax rate declined to 38.0% from 40.0%.

Majority net income rose 135% to Ps.1,321 million driven by the financing cost dynamics mentioned
above.

FINANCIAL POSITION
March 2021 versus December 2020

Balance Sheet Highlights

Total assets grew 4% to Ps.76,393 million, resulting principally from higher cash balances; and to a
lesser extent, higher property, plant and equipment, supported by the peso weakness.

Total liabilities increased 3% to Ps.47,474 million mostly from higher bank loans.

Majority shareholders’ equity rose 5% to Ps.28,932 million.

                                                                                       Page 3 of 13
1Q21 Results

         Debt Profile
         GRUMA’s debt was US$1.5 billion, US$54 million more than in December 2020. Approximately 70%
         of GRUMA’s debt was USD denominated. In peso terms, GRUMA’s debt increased 7% to Ps.31.6
         billion in connection with peso weakness versus December 2020.

                                                         Debt
                                                     (USD millions)

                                               Var vs Mar’20                   Var vs Dec’20
                         Mar’21 Mar’20          ($)     (%)        Dec’20      ($)      (%)
                         1,540  1,374          166       12        1,486        54        4

                                               Debt Maturity Profile (1)
                                                     (USD millions)

                                                           Rate        2021    2022 2023 2024 2025 2026 TOTAL
Senior Notes 2024                                       Fixed 4.875%                             400.0                  400.0
Scotiabank Term Loan 2019                               Fixed 2.79%                                      250.0          250.0
Scotiabank Term Loan 2021                             LIBOR + 1.00%                                              200.0 200.0
Cebures Gruma18 (MXN $3,000)                            Fixed 8.52%                      145.6                          145.6
Club Loan (MXN $2,000)                                 TIIE + 0.55%     97.1                                            97.1
Other:
         MXN                                           TIIE + 0.40%     54.4                                            54.4
         EUR                                              1.08%         2.5    12.7      12.5    12.5    10.6    10.6   61.4
TOTAL                                                  4.07% (avg.)    153.9 12.7 158.1 412.5 260.6 210.6 1,208.4
  (1) The US$331 million related to leases are not included on the above debt figures.

                                                                                                         Page 4 of 13
1Q21 Results

CAPITAL EXPENDITURE PROGRAM
GRUMA’s capital expenditures totaled US$43 million in 1Q21. During the quarter, investments were
mostly allocated to the following projects: (1) capacity expansions at the tortilla plant in Malaysia;
(2) renovations and maintenance to prepare for the re-opening of the tortilla plant in Omaha,
Nebraska; (3) advances in construction of the new tortilla plant in Indiana; (4) transportation and
distribution equipment in Mexico; and (5) maintenance and general technology upgrades across the
company.

SUBSIDIARY RESULTS OF OPERATIONS
1Q21 versus 1Q20

Gruma USA

     Consolidated Financial Highlights                                                    YoY
                                                                                         QoQ                       YTD
Selected Income
     Income      Statement
             Statement (MXNItems  (MXN millions)
                              millions)                        1Q21        %1Q21 1Q20 1Q20%              ($)
                                                                                                     VAR (%)     VAR (%)
                                                                                                                  2021
               1                              2
GRUMA    USA (thousand tons) Sales Volume
     Volume                                                     363           1,014 376 1,040         (12)
                                                                                                       (3)         (3)
                                                                                                                  1,014
Corn Net Sales
     flour, tortillas, and other Net Sales                    12,752        22,17912,35921,544          3
                                                                                                      393         22,179
                                                                                                                    3
     Operating Income            Operating Income              1,782      14.02,5761,772 2,662
                                                                                            14.3       (3)
                                                                                                       10         2,576
                                                                                                                    1
        Operating Margin (%) Ebitda                            2,354         11.6%2,306 12.4%
                                                                          18.5              18.7     (80)
                                                                                                       47bp       11.6%
                                                                                                                    2
           1
      Ebitda                                                                  3,472       3,505
                                                                                              For further(1)      3,472
1
  Convenience    translation at the exchange rate of Ps. 20.6047/dollar as of March 31, 2021.             details see0
2         Ebitda Margin  (%)
  All sales volume figures are expressed in thousand metric tons.             15.7%       16.3%       (60) bp       15.7%
3
  TheMajority   Net
       difference   Income the use of convenience translation and the historical
                   between                                                    1,321
                                                                                  exchange562           135 for Gruma
                                                                                            rate on figures         1,321
                                                                                                                        USA
and Gruma Europe is recorded under "Convenience Translation Effect".
    1
      EBITDA = operatingSales
                           incomevolume    fell 3%
                                  + depreciation,     to 363 and
                                                  amortization thousand    metric
                                                                   impairment of longtons.   Tortilla sales volume
                                                                                      lived assets
     +(-) other expenses (income) unrelated to core business operations.
                          remained flat at 216 thousand metric tons due to a slow recovery at the food
                        service business line, which has not reached pre-pandemic levels. Retail
                        volume growth mostly offset the decline in the food service business, reflecting
                        the trend toward eating more meals at home and as familiarity with the
tortilla’s versatile use have remained rooted in Hispanic as well as non-Hispanic populations in the
U.S. Volume growth in the retail tortilla business was significantly driven by super soft wheat flour
and carb-balance tortillas. Corn flour sales volume decreased 7% to 147 thousand metric tons due
to clients’ stockpiling during 1Q20, as a result of the Covid-19 effect. In addition, volumes in both,
tortilla and corn flour, were impacted by the aftermath of severe weather conditions during February
2021.

                                                                                                            Page 5 of 13
1Q21 Results

Net sales increased 3% to Ps.12,752 million driven by a more profitable sales mix given the positive
performance of value-added products, while volume decreased for lower cost products.

Cost of sales grew 2% to Ps.7,210 million due mainly to (1) higher material costs in the tortilla
business, reflecting the increased sales of value-added products as this segment requires higher
ingredient and packaging costs; (2) higher utility and warehousing costs; (3) higher labor costs to
meet increasing demand at the tortilla retail channel; and (4) higher COVID-19 related expenses. This
was partially offset by lower cost of goods sold at the corn milling business, as a result of lower
volume sold during the quarter. Cost of sales as a percentage of net sales improved to 56.5% from
57.0% resulting mostly from a shift to the tortilla business.

SG&A rose 6% to Ps.3,754 million due to (1) higher sales commissions mostly in connection with
higher average selling prices, linked to a more profitable mix at the retail tortilla business; and (2)
the sales mix between channels favoring retail over food service, as sales commissions and other
expenses are higher for retail than food service; and (3) higher freight expenses due to bad weather
conditions during the quarter. As a percentage of net sales, it increased to 29.4% from 28.6% mostly
in connection with higher sales’ prices and expenses, arising from the retail channel composition
relative to food service.

Operating income grew 1% to Ps.1,782 million, and operating margin decreased 30 basis points to
14.0% from 14.3%.

EBITDA increased 2% to Ps.2,354 million, and EBITDA margin declined 20 basis points to 18.5% from
18.7%.

GIMSA
      Consolidated Financial Highlights                                                    YoY
                                                                                         QoQ                         YTD
Selected  Income
       Income    Statement
               Statement   Items
                         (MXN    (MXN millions)
                                millions)                      1Q21        % 1Q211Q20        %
                                                                                           1Q20      VAR
                                                                                                      VAR($)
                                                                                                          (%) VAR2021
                                                                                                                  (%)
GIMSAVolume (thousand tons) Sales Volume                        497            1,014503   1,040        (5)(3)      (1)
                                                                                                                    1,014
Corn flour  and other
       Net Sales                Net Sales                      5,628               5,517 21,544
                                                                              22,179                   1113         2
                                                                                                                   22,179
       Operating Income         Operating Income                331       5.9 2,576664      12.0
                                                                                          2,662       (332)
                                                                                                         (3)      (50)
                                                                                                                    2,576
           Operating Margin (%) Ebitda                          615       10.9 11.6%935     16.9
                                                                                         12.4%        (320)
                                                                                                       (80) bp    (34)
                                                                                                                    11.6%
1            1
        Ebitda translation at the exchange rate of Ps. 20.6047/dollar as of March
  Convenience                                                                  3,47231, 2021.
                                                                                           3,505          (1)
                                                                                              For further details see 3,472
                                                                                                                        0
2
  All sales Ebitda
            volumeMargin
                    figures(%)
                            are expressed in thousand metric tons.            15.7%        16.3%        (60) bp      15.7%
3
  The difference   between
        Majority Net  Incomethe use of convenience translation and the historical exchange rate
                                                                               1,321        562 on figures  for Gruma
                                                                                                          135           USA
                                                                                                                      1,321
and Gruma Europe is recorded under "Convenience Translation Effect".
Sales 1volume     decreased 1% to 497 thousand metric tons mostly from (1) stockpilling
        EBITDA = operating income + depreciation, amortization and impairment of long lived assets
effects+(-)
         that  took
            other    place(income)
                  expenses last year, increasing
                                   unrelated       volumes
                                             to core business sold during 1H20 due to COVID-19;
                                                              operations.
and (2) lower in-store tortilla purchases relative to 1Q20 when in-store traffic was
higher.

                                                                                                            Page 6 of 13
1Q21 Results
Net sales increased 2% to Ps.5,628 million due to price increases implemented during 1Q21. These
increases took place in the middle of 1Q21, generating a revenue dephasing effect relative to costs.
Cost of sales rose 11% to Ps.4,379 million due to (1) the higher cost of corn given strong demand
from China, relative to supply during the period; and (2) extraordinary expenses due to severe
weather conditions in Mexico during the quarter. As a percentage of net sales, it increased 600 basis
points to 77.8% from 71.8% in connection with the above mentioned dynamics.
SG&A rose 1% to Ps.991 million resulting from higher freight expenses driven by higher tariffs and
increased intercompany shipments due to the severe weather conditions mentioned above. As a
percentage of net sales, SG&A declined 20 basis points to 17.6% from 17.8% due mainly to a positive
absorption from revenues given the 2% growth mentioned above and lower corporate expenses.
Other income, net, was Ps.73 million, Ps.16 million less, resulting mostly from losses on FX hedging
related to corn procurement.
Operating income declined 50% to Ps.331 million, and operating margin was 610 basis points lower
reaching 5.9%.
EBITDA was 34% lower at Ps.615 million. EBITDA margin declined 600 basis points to 10.9% from
16.9%.
Gruma Europe
Consolidated Financial Highlights YoY
QoQ YTD
Selected Income
Income Statement
Statement Items
(MXN (MXN millions)
millions) 1Q21 %
% 1Q211Q20 1Q20 VAR
VAR($)
(%) VAR (%)
2021
1 2
GRUMA EUROPE
Volume (thousand tons) Sales Volume 87 1,014 105 1,040 (18)
(3) (17)
1,014
Net Sales
Corn flour, tortillas, and other Net Sales 1,467 22,179
1,490 21,544 3
(23) 22,179
(2)
Operating Income Operating Income 213 14.52,576 56 2,662
3.7 (3)
158 2,576
284
Operating Margin (%) Ebitda 277 18.911.6%121 12.4%
8.1 (80)
156bp 11.6%
130
1 Ebitda1 3,472 3,505 (1) 3,472
Convenience translation at the exchange rate of Ps. 20.6047/dollar as of March 31, 2021. For further details see 0
2
All salesEbitda
volumeMargin (%)
figures are expressed in thousand metric tons. 15.7% 16.3% (60) bp 15.7%
3 Majority Net Incomethe use of convenience translation and the historical
1,321
The difference between exchange 562 135for Gruma
rate on figures 1,321
USA
and Gruma Europe is recorded under "Convenience Translation Effect".
1
EBITDA = operatingSales volume
income declined
+ depreciation, 17% to 87
amortization andthousand
impairmentmetric tons.assets
of long lived The tortilla business
+(-) other expenses saw sales
(income) volumetofall
unrelated core9% as the
business food service channel continues to be affected
operations.
by the COVID-19 pandemic. Improved performance at the retail channel, as
reflected in higher sales, was not sufficient to offset the decline in volume. The
corn milling business fell 22% due to (1) extraordinary corn sales during 1Q20;
(2) lower sales stemming from the COVID-19 effect; (3) higher cost of corn in
regions with high cost sensitivity; and lastly (4) lower sales of byproduct, which
is mostly used for animal feed.
Page 7 of 131Q21 Results
Net sales decreased 2% to Ps.1,467 million resulting from lower sales volume in lower-cost
products such as grits and corn flour, on the back of the COVID-19 effects in the region.
Cost of sales increased 5% to Ps.1,148 million resulting from (1) a higher cost product mix in the
portfolio shifting toward the tortilla business; (2) higher costs of corn; and (3) lower overhead cost
absorption due to lower sales volume. As a percentage of net sales, it rose to 78.2% from 73.3%
primarily driven by the aforementioned cost dynamics.
SG&A decreased 22% to Ps.314 million due to lower distribution costs in line with the decrease in
volume sold mentioned above as well as fewer corporate expenses. As a percentage of net sales, it
declined to 21.4% from 26.9%.
Other income, net, was Ps.208 million, a Ps.149 million improvement in connection with an
insurance claim recovery of Ps.203 million.
Operating income surged 284% to Ps.213 million from Ps.56 million, and operating margin improved
1,080 basis points to 14.5%.
EBITDA rose 130% to Ps.277 million from Ps.121 million, and EBITDA margin improved 1,080 basis
points to 18.9% from 8.1%.
Gruma Centroamérica
Consolidated Financial Highlights YoY
QoQ YTD
Selected Income
Income Statement
Statement Items
(MXN (MXN millions)
millions) 1Q21 % 1Q211Q20 %
1Q20 VAR
VAR($)
(%) VAR2021
(%)
2
GRUMA (thousand tons) Sales Volume
CENTROAMÉRICA
Volume 56 1,014 56 1,040 0(3) 0
1,014
Corn flour and other
Net Sales Net Sales 1,257 1,277
22,179 21,544 (20)3 (2)
22,179
Operating Income Operating Income 98 7.8 2,576107 8.4
2,662 (9)
(3) (9)
2,576
Operating Margin (%) Ebitda 137 10.911.6%151 11.8
12.4% (14)
(80) bp (9)
11.6%
1 1
Ebitda translation at the exchange rate of Ps. 20.6047/dollar as of March
Convenience 3,47231, 2021.
3,505
For further (1)
details see 3,472
0
2
All salesEbitda
volume figures are
Margin (%) expressed in thousand metric tons. 15.7% 16.3% (60) bp 15.7%
3
The difference between
Majority Net Incomethe use of convenience translation and the historical exchange rate
1,321 562 on figures
135for Gruma USA
1,321
and Gruma Europe is recorded under "Convenience Translation Effect".
Sales volume remained flat at 56 thousand metric tons as a result of (1)
1
EBITDA = operating incomegreater
+ depreciation,
volume amortization
sold inand impairment in
Honduras; of long lived assets
contrast
lower sales in to
+(-) other expenses (income)Guatemala
unrelated to core business operations.
as a result of the COVID-19 pandemic;
and (2) lower
consumer demand at supermarkets and grocery stores for retail
packages, also amid the COVID-19 effects.
Net sales decreased 2% to Ps.1,257 million driven mainly by the change
in the sales mix relative to 1Q20.
Page 8 of 131Q21 Results
Cost of sales rose 2% to Ps.860 million driven mostly by (1) an overall increase in the cost of corn in
the global markets; and (2) higher costs of utilities and fuel, relative to the domestic currency. As a
percentage of net sales, it rose to 68.5% from 65.8%.
SG&A decreased 8% to Ps.305 million due to better expense efficiencies during 1Q21. As a
percentage of net sales, it improved to 24.3% from 25.8%.
Operating income was 9% lower at Ps.98 million and operating margin declined 60 basis points to
7.8% from 8.4%.
EBITDA decreased 9% to Ps.137 million and EBITDA margin fell 90 basis points to 10.9% from 11.8%.
Other Subsidiaries and Eliminations
Operating income increased Ps.141 million to Ps.169 million, due to a significantly strong
performance of GRUMA Asia and Oceania and fewer corporate expenses.
RELEVANT EVENTS
On March 31, 2021, GRUMA announced the obtainment of a US$200 million credit facility, which
will be used to refinance liabilities denominated in dollars and pesos. The US$200 million credit
facility was granted jointly by The Bank of Nova Scotia and Bank of America México, S.A., Institución
de Banca Múltiple, for a 5-year term, at an interest rate of LIBOR plus a spread of 100 basis points,
payable in a single exhibition at maturity. This refinancing allows GRUMA to reduce the cost of its
debt, as well as to improve its maturity profile.
Page 9 of 131Q21 Results
CONFERENCE CALL
The first quarter conference call will be held on Thursday, April 22, 2021 at 11:30 am Eastern Time
(10:30 am Monterrey Time). To access the call, please dial: domestic US +1 (877) 407 0784,
international +1 (201) 689 8560.
ACCOUNTING PROCEDURES
The consolidated figures have been prepared in accordance with the International Financial Reporting
Standards (IFRS). Results for foreign subsidiaries are translated into Mexican pesos applying the historical
exchange rate. Nevertheless, under the section “Subsidiary Results of Operations” and the table “Financial
Highlights by Subsidiary” of this report, figures for Gruma USA and Gruma Europe were translated into
Mexican pesos using a convenience translation at the exchange rate of Ps.20.6047/dollar as of March 31,
2021. The differences between the use of convenience translation and the historical exchange rate are
recorded under the line "Convenience Translation Effect” of the same table.
Page 10 of 131Q21 Results
ABOUT GRUMA
Since 1949, GRUMA, S.A.B. de C.V., is one of the world's leading tortilla and corn flour producers. With leading
brands in most of its markets, GRUMA has operations in the United States, Mexico, Central America, Europe,
Asia and Oceania. GRUMA is headquartered in San Pedro Garza García, Mexico, and has approximately 22,000
employees and 73 plants. In 2020, GRUMA had net sales of US$4.6 billion, of which 76% came from non-
Mexican operations. For further information, please visit www.gruma.com.
This report may contain certain forward-looking statements and information relating to GRUMA, S.A.B. de C.V., and its
subsidiaries (collectively, “GRUMA”) that are based on the beliefs of its management as well as assumptions made by
and information then available to GRUMA. Such statements reflect the views of GRUMA with respect to future events
and are subject to certain risks, uncertainties, and assumptions. Many factors could cause the actual results, performance,
or achievements of GRUMA to be materially different from historical results or any future results, performance, or
achievements that may be expressed or implied by such forward-looking statements. Such factors include, among others,
changes in economic, political, social, governmental, business, or other factors globally or in Mexico, the United States,
Latin America, or any other countries in which GRUMA does business, and world corn and wheat costs. If one or more of
these risks or uncertainties materializes, or underlying assumptions are proven incorrect, actual results may vary
materially from those described herein as anticipated, believed, estimated, expected, or targeted. GRUMA does not
intend, and undertakes no obligation, to publicly update or revise any forward-looking statements, whether as a result of
new information, future events, or otherwise.
This report was translated from Spanish into English and presented only for purpose of complying with the requirements
of GRUMA’s US$400 million 4.875% senior notes due 2024. None of the information contained in this report is prepared
and published with the intention of claiming an exemption under Rule 12g3-2 (b) of the U.S. Securities Exchange Act of
1934. GRUMA does not authorize, endorse, support or encourage the creation of any unsponsored ADR program in
respect of its securities and disclaims any liability whatsoever arising out of an unsponsored ADR program. Under no
circumstances should the contents of this report be construed as a solicitation to purchase any securities of GRUMA.
Page 11 of 131Q21 Results Page 12 of 13
1Q21 Results

Page 13 of 13
You can also read