Good resilience in the face of the COVID-19 crisis - Half-yearly Report 2020 Charles Héaulmé President and CEO Thomas Geust CFO

Page created by Jose Simon
 
CONTINUE READING
Good resilience in the face of the COVID-19 crisis - Half-yearly Report 2020 Charles Héaulmé President and CEO Thomas Geust CFO
Good resilience in the face
of the COVID-19 crisis
Half-yearly Report 2020

Charles Héaulmé
President and CEO
Thomas Geust
CFO
Good resilience in the face of the COVID-19 crisis - Half-yearly Report 2020 Charles Héaulmé President and CEO Thomas Geust CFO
Our operating
environment
Good resilience in the face of the COVID-19 crisis - Half-yearly Report 2020 Charles Héaulmé President and CEO Thomas Geust CFO
Visible and tangible recovery
                                              – Consistent increase in order-in-take since April
                                              – Food on-the-go most impacted by the restrictions,
                                                order-in-take end June still lower than 2019 with
                                                variations across geographies

                                              Consumption shifts will drive innovation and
                                              new models
                                              – Shift to working from home, changing foodservice
                                                store visiting culture​
                                              – Retail as a source of “ready to eat and ready to
                                                cook”. Fresh food as a new category for packaging​
                                              – Increase in food and groceries delivery, requiring
                                                more functional packaging​
                                              – Higher need for hygiene and safety, requiring high-
                                                quality, tamper-proof packaging​ and traceability
                                              – Increased e-commerce and accelerated need of
                                                digital solutions

3   July 23, 2020   Half-yearly Report 2020
Good resilience in the face of the COVID-19 crisis - Half-yearly Report 2020 Charles Héaulmé President and CEO Thomas Geust CFO
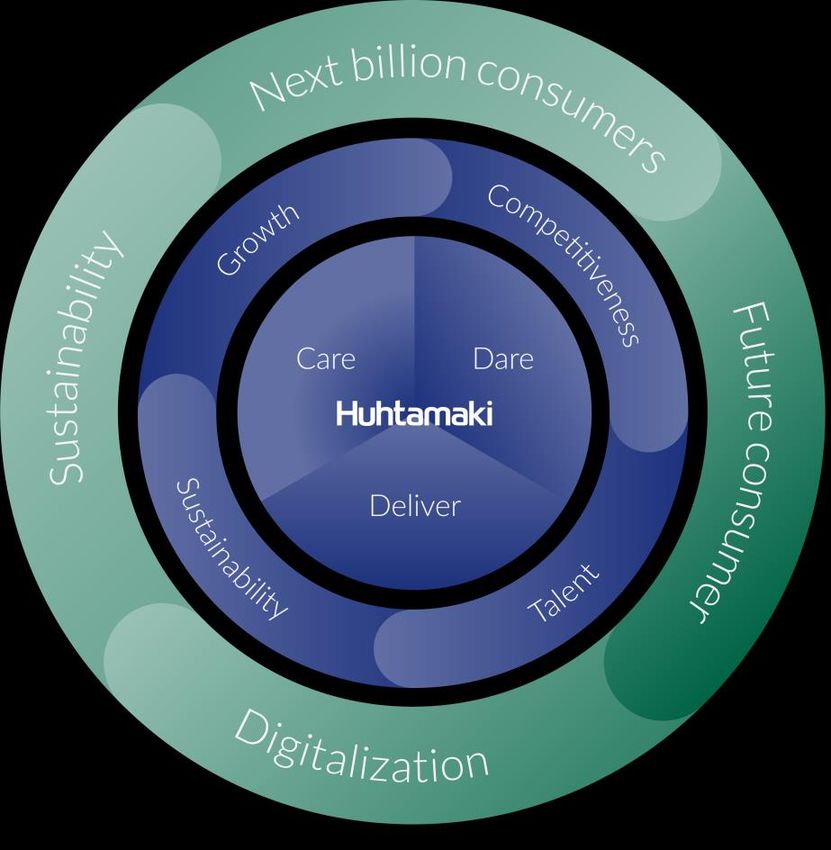
The fundamental trends underlying our strategy remain true
    – the next billion consumers
    – the consumer of the future
    – digitalisation
    – sustainability

    Our Strategy is the right strategy
    – Ambition: first choice in sustainable food packaging
    – Strategic priorities:
      – accelerate Growth
      – improve Competitiveness
      – develop Talent
      – embed Sustainability in everything we do
    – Operating model: empowered Business Segments and World-
      Class Management program to drive transformation across
      businesses
    – Core values: Care Dare Deliver

4   July 23, 2020   Half-yearly Report 2020
Good resilience in the face of the COVID-19 crisis - Half-yearly Report 2020 Charles Héaulmé President and CEO Thomas Geust CFO
Celebrating our 100-year legacy by donating up to 3 MEUR to
    initiatives addressing global sustainability challenges

            Caring immediately                       Acting today            Educating for tomorrow       Innovating for the future
       0.5 MEUR to boost COVID-                0.6 MEUR to set a cleaning      0.9 MEUR to provide           1 MEUR to surface and
       19 emergency relief efforts            system of plastic waste from   education and training on    support early stage solutions
         in Asia and Europe and               Mithi river in Mumbai, India    waste management and         for a circular economy, via
        improving the lives of the                                           circular systems in South        organizing a start-up
         world’s most vulnerable                                             Africa, Vietnam, and India              program

       Recipient: International Red            Recipient: partnership by        Recipient: WasteAid         Recipient: Food System 6
                   Cross                       UNTIL, VTT, RiverRecycle
                                                     and Earth5R

5   July 23, 2020   Half-yearly Report 2020
Good resilience in the face of the COVID-19 crisis - Half-yearly Report 2020 Charles Héaulmé President and CEO Thomas Geust CFO
Business performance
Q2 2020: Sales impacted by the COVID-19 related restrictions

         Development of net sales in Q2 2020                                                                                         Net sales growth -8% in Q2 2020
         (EUR million)
                                                                                                                                     – Comparable net sales growth -8%
                                                                                                                                       (-12% in emerging markets)
                                        -76                   14                    -8
                                                                                                                                     – 2% from acquisitions
                    867                                                                                                              – 1% negative currency impact
                                                                                                         797

               Q2 2019               Organic           Acquisitions           Translation             Q2 2020
                                                                                impact

     Comparable net sales growth is growth excluding foreign currency changes, acquisitions, divestments and ancillary businesses.
     Acquisitions calculated for 12 first months from closing.

7   July 23, 2020         Half-yearly Report 2020
H1 2020: Strong sales in Q1 offset the drop in sales in Q2

         Development of net sales in H1 2020                                                                                         Net sales growth -2% in H1 2020
         (EUR million)
                                                                                                                                     – Comparable net sales growth -3%
                                                                                     2                                                 (-8% in emerging markets)
                                          -54
                                                              25
                                                                                                                                     – 2% from acquisitions
                    1,669                                                                                                            – Insignificant currency impact
                                                                                                        1,642

               H1 2019                 Organic         Acquisitions           Translation             H1 2020
                                                                                impact

     Comparable net sales growth is growth excluding foreign currency changes, acquisitions, divestments and ancillary businesses.
     Acquisitions calculated for 12 first months from closing.

8   July 23, 2020           Half-yearly Report 2020
Food on-the-shelf packaging continued to grow, food on-the-go
    significantly impacted

                    Comparable growth               Q2 19            Q3 19              Q4 19             Q1 20              Q2 20   H1 19   H1 20   Long-term
                                                                                                                                                     ambitions
              Foodservice E-A-O                      3%                 4%                4%                -4%               -28%    4%     -17%      5-7%

                     North America                  13%                14%                6%                 9%                -5%    9%      1%       3-5%

               Flexible Packaging                    1%                 4%                3%                 2%                2%     3%      2%       6-8%

                    Fiber Packaging                  7%                 7%                8%                 9%               10%     5%     10%       3-5%

                                Group                6%                 7%                5%                 3%                -8%    5%     -3%       5+%

         – COVID-19 affected foodservice business globally
         – Strong growth continued in retail tableware in North America
         – Strong demand for food on-the-shelf products disrupted by interruptions in the supply chain
     Comparable net sales growth is growth excluding foreign currency changes, acquisitions, divestments and ancillary businesses.

9   July 23, 2020         Half-yearly Report 2020
Solid adjusted EBIT margin despite COVID-19 crisis

            MEUR                                              Q2 20                     Q2 19                    Change        H1 20     H1 19    Change

          Net sales                                           797.1                      867.3                        -8%     1,641.7   1,669.4     -2%

          Adjusted EBIT1                                        70.1                       78.3                     -10%       143.7     146.1      -2%

                Margin                                         8.8%                       9.0%                                  8.8%      8.8%

          Adjusted EPS, EUR2                                    0.44                       0.51                     -14%        0.90      0.95      -5%

          Capital expenditure                                   40.3                       38.6                         4%      79.7      78.3       2%

            –    Lower earnings due to decrease in net sales
            –    Positive impacts from 2019 price management, lower raw material prices and a favorable sales mix in North America
            –    Adjusted EPS negatively affected by higher tax rate and financing costs
            –    Capex for future growth and efficiency enabled by our healthy balance sheet

      1   Excluding IAC of EUR 0.1 million in Q2 2020 (EUR -0.5 million) and EUR 9.0 million in H1 2020 (EUR -0.6 million).
      2   Excluding IAC of EUR 0.1 million in Q2 2020 (EUR -0.4 million) and EUR 7.0 million in H1 2020 (EUR -0.5 million).

10   July 23, 2020            Half-yearly Report 2020
Business segment review
Foodservice EAO: COVID-19 drives decrease in sales and earnings

          Key figures, MEUR                       Q2 20              Q2 19              Change                Net sales and comparable growth (EUR million & %)
          Net sales                                167.2              241.0               -31%

              Comparable growth                    -28%                  3%                                                           241               242        245
                                                                                                                   228          218
          Adjusted EBIT1                                6.2            22.0               -72%                                                                                     2019
                                                                                                                                                 167
                                                                                                                                                                                   2020
              Margin                                3.7%               9.1%
                                                                                                                    4%          -4%   3%         -28%   4%         4%                  Comp.
          Capital expenditure                       18.5               15.3                21%                                                                                         growth
          Operating cash flow1                          -7.0           15.6
North America: Strong performance during Q2 and H1

          Key figures, MEUR                      Q2 20              Q2 19             Change                Net sales and comparable growth (EUR million & %)
          Net sales                               296.1              306.4                -3%

              Comparable growth                        -5%            13%                                                         306        296   287          304
                                                                                                                            286
                                                                                                                 256
          Adjusted EBIT1                           37.9               32.4                17%                                                                                  2019
                                                                                                                                                                               2020
              Margin                             12.8%              10.6%
                                                                                                                  5%        9%    13%        -5%   14%          6%             Comp.
          Capital expenditure                          9.9             9.4                 5%                                                                                  growth
          Operating cash flow1                     71.9               34.2             >100%                           Q1               Q2               Q3           Q4

          Key figures, MEUR                      H1 20              H1 19             Change                – Strong growth in retail tableware and in-home ice cream consumption
          Net sales                               582.3              562.1                 4%
                                                                                                            – COVID-19 impacted foodservice packaging sales negatively, primarily in
              Comparable growth                        1%               9%                                    drink cups and trays
          Adjusted EBIT1                           68.4               53.0                29%
                                                                                                            – Earnings improved as a result of the continuation of the margins
              Margin                             11.7%               9.4%                                     established in 2019, favorable sales mix and lower energy, fuel and
          Adjusted RONA1                         14.9%              10.3%                                     plastic resin costs
          Capital expenditure                      21.8               24.1                -9%
          Operating cash flow1                     79.2               37.1             >100%
      1   Excluding IAC of EUR -0.0 million in Q2 2020 (no IAC in Q2 2019) and EUR -3.4 million in H1 2020 (no IAC in H1 2019).

13   July 23, 2020           Half-yearly Report 2020
Flexible Packaging: Performance impacted by disruptions in the
     supply chain
          Key figures, MEUR                       Q2 20             Q2 19             Change                Net sales and comparable growth (EUR million & %)
          Net sales                                263.1             248.7                 6%
                                                                                                                            271              263   261          255
              Comparable growth                         2%              1%                                       252              249

          Adjusted EBIT1                            19.1              20.1                -5%                                                                                    2019
                                                                                                                                                                                 2020
              Margin                                7.3%             8.1%
                                                                                                                  5%        2%    1%         2%    4%           3%                 Comp.
          Capital expenditure                           7.5           10.6               -29%                                                                                      growth
          Operating cash flow1                          7.4           16.5               -55%                          Q1               Q2               Q3           Q4

          Key figures, MEUR                       H1 20             H1 19             Change                – Good demand for flexible packaging across most markets, with higher
          Net sales                                534.0             500.5                 7%                 than normal demand in Europe
              Comparable growth                         2%              3%                                  – The lower performance was driven mainly by UAE and India
          Adjusted    EBIT1                         40.1              43.2                -7%                   – India business was severely impacted during Q2 by the strict
              Margin                                7.5%             8.6%                                           restrictions across the country limiting demand and supply
                                                                                                                – UAE suffered factory lockdowns
          Adjusted RONA1                          10.1%             10.5%
          Capital expenditure                       15.5              19.3               -20%               – Integration of recent acquisitions continues according to plan and
                                                                                                              supported growth and earnings
          Operating cash flow1                          9.1           15.8               -42%
      1   Excluding IAC of EUR -0.3 million in Q2 2020 (no IAC in Q2 2019) and EUR -4.9 million in H1 2020 (no IAC in H1 2019).

14   July 23, 2020            Half-yearly Report 2020
Fiber Packaging: Significant growth in sales and solid profitability

          Key figures, MEUR                       Q2 20             Q2 19             Change                Net sales and comparable growth (EUR million & %)
          Net sales                                 75.7              77.5                -2%

              Comparable growth                     10%                 7%                                                        78
                                                                                                                  72        75              76                  76
                                                                                                                                                  68                           2019
          Adjusted    EBIT1                             8.5            7.6                12%
                                                                                                                                                                               2020
              Margin                              11.2%              9.8%
                                                                                                                  4%        9%    7%        10%   7%            8%             Comp.
          Capital expenditure                           4.3            3.2                34%                                                                                  growth
          Operating cash flow1                          7.5            8.9               -16%                          Q1              Q2              Q3            Q4

          Key figures, MEUR                       H1 20             H1 19             Change                – Strong demand across markets – especially in egg packaging and
          Net sales                                150.2             149.1                 1%                 continued plastic substitution
              Comparable growth                     10%                 5%
                                                                                                            – Net sales increased especially in Europe
          Adjusted    EBIT1                         16.7              14.4                16%
                                                                                                            – Earnings improvement driven by volume growth, pricing actions
              Margin                              11.1%              9.7%
                                                                                                              implemented earlier and lower raw material prices
          Adjusted RONA1                          13.4%             13.5%
          Capital expenditure                           7.7            5.8                33%
          Operating cash flow1                          7.4           13.5               -46%
      1   Excluding IAC of EUR -0.8 million in Q2 2020 (no IAC in Q2 2019) and EUR -1.5 million in H1 2020 (no IAC in H1 2019).

15   July 23, 2020            Half-yearly Report 2020
Financial review
Solid EBIT margin whilst EPS affected by financial items and tax rate
          MEUR                                         Q2 20              Q2 19             Change                       H1 20                H1 19             Change                   – Net financial items increased
           Net sales                                   797.1               867.3                  -8%                   1,641.7            1,669.4                   -2%                   following internal funding
                                                                                                                                                                                           arrangements and
           Adjusted EBITDA1                            112.1               118.6                  -5%                     229.1               225.5                    2%
                                                                                                                                                                                               precautionary measures
               Margin1                                 14.1%              13.7%                                          14.0%               13.5%                                             for COVID-19
           Adjusted EBIT2                               70.1                 78.3               -10%                      143.7               146.1                  -2%
                                                                                                                                                                                         – Higher reported tax in H2
               Margin2                                  8.8%                9.0%                                           8.8%                8.8%                                        2020 with adjusted tax rate
           EBIT                                         70.2                 77.8               -10%                      152.7               145.5                    5%                  23% (22% in H1 2019)
           Net financial items                           -8.4                -7.8                 -8%                     -17.6                -15.7               -12%
           Adjusted profit
                                                        61.7                 70.5               -12%                      126.1               130.4                  -3%
           before taxes
           Adjusted income tax
                                                       -13.9               -15.6                 11%                      -28.4                -28.0                 -1%
           expense3
           Adjusted profit for
                                                        47.8                 54.9               -13%                        97.7              102.3                  -4%
           the period4
           Adjusted EPS, EUR4                           0.44                 0.51               -14%                        0.90                0.95                 -5%
      1 Excluding IAC of EUR 0.9 million in Q2 20 (EUR -0.5 million) and EUR 14.0 million in H1 20 (EUR -0.6 million). 3 Excluding IAC of EUR 0.0 million in Q2 20 (EUR 0.1 million) and EUR -2.0 million in H1 20 (EUR 0.1 million).
      2 Excluding IAC of EUR 0.1 million in Q2 20 (EUR -0.5 million) and EUR 9.0 million in H1 20 (EUR -0.6 million).   4 Excluding IAC of EUR 0.1 million in Q2 20 (EUR -0.4 million) and EUR 7.0 million in H1 20 (EUR -0.5 million).

17   July 23, 2020           Half-yearly Report 2020
No significant impact from currencies
                      Average                                          Closing rates                            Average   Change in
                        rate                                                                                      rate     average
                      H1 2019                Q2 19          Q3 19            Q4 19              Q1 20   Q2 20   H1 2020      rate

          USD              1.13                1.14           1.09             1.12              1.10    1.13      1.10        3%
                                                                                                                                      Foreign currency
          INR            79.13               78.57           77.07           79.81              83.50   85.19     81.63        -3%    translation impact
          GBP              0.87                0.89           0.89             0.85              0.89    0.92      0.87        0%
                                                                                                                                        Q2 2020
                                                                                                                                        (EUR million)
          CNY              7.67                7.82           7.79             7.82              7.83    7.98      7.75        -1%
                                                                                                                                           Net sales    EBIT
          AUD              1.60                1.63           1.62             1.60              1.80    1.64      1.68        -5%

          THB            35.72               35.00           33.51           33.47              36.08   34.85     34.82        3%
                                                                                                                                               -8       0
          RUB            73.79               71.61           70.37           69.28              88.14   78.92     76.61        -4%      H1 2020
                                                                                                                                        (EUR million)
          BRL              4.34                4.39           4.55             4.51              5.65    6.11      5.40      -24%
                                                                                                                                           Net sales    EBIT
          NZD              1.68                1.70           1.74             1.66              1.84    1.75      1.76        -5%
                                                                                                                                              +2        +1
          ZAR            16.05               16.09           16.48           15.74              19.73   19.43     18.30      -14%

      Please note: Income statement is valued on average rate, balance sheet on closing rate.

18   July 23, 2020        Half-yearly Report 2020
Net debt decreased compared to Q2 2019 and Q1 2020

            Net debt, net debt/adj. EBITDA and gearing                                                           – Net debt/Adj. EBITDA at 2.0
                                                                                           Covenant level1 3.5
                                                                                                                 – At the end of Q2 2020:
                                                                                                                    – Cash and cash equivalents
                                                                                                                      EUR 234 million
                  2.4              2.4                                                          Ambition            – Unused committed credit
                                                     2.1                    2.1     2.0
                                                                    2.0                            2–3                facilities available EUR 303
                  980
                                  1,019
                                                                           980
                                                                                                                      million
                                                     944                           908
                                                                   904
                                                                                                Net debt, M€
                                                                                                                 – Net debt EUR 908 million and
                 0.73              0.78
                                                    0.68           0.63    0.68    0.62
                                                                                                                   lease liabilities EUR 154 million
                                                                                                Net debt/Adj.
                                                                                                EBITDA

                                                                                                Gearing

                Q1 19             Q2 19            Q3 19           Q4 19   Q1 20   Q2 20

      1   Covenant level is excluding IFRS 16 lease liabilities.

19   July 23, 2020             Half-yearly Report 2020
Loan maturities

          Debt maturity structure June 30, 2020                                                                      – Average maturity 3.1 years at the
          (EUR million)                                                                                                end of Q2 2020 (3.2 Q2 2019)
           600
                                                                                                                     – Unused committed credit facilities
           500                                                                                                         of EUR 303 million maturing in
                                                                                                                       2022
           400

           300                                                                                                       – EUR 150 million Schuldschein in 3
                                                                                                                       and 5 year maturities signed on
           200
                                                                                                                       June 26, 20201
           100                                                                                                            – Proceeds will be used for general
                                                                                                                            corporate purposes and
              0
                         2020                  2021       2022    2023               2024            Later
                                                                                                                            repayment of existing debt
                                                                                                                            maturing during the next 12
                  Bonds and other loans                          Uncommitted loans from financial institutions              months
                  Commercial paper program                       Drawn committed credit facilities
                  Available unused committed facilities          Lease liabilities
                                                                                                                 1   Funds paid on July 3, 2020

20   July 23, 2020         Half-yearly Report 2020
Higher free cash flow

          Free cash flow bridge                                                                                           Cash flow driven by:
          (EUR million)
                                                                                                                          – Higher EBITDA despite impact
                                                                                                                            from COVID
              243                                                                                                           – Laminor gain of ~20 MEUR is
                     225                                                                                                      recognized as non-cash in
                                                                                                                              ‘Other’
                                                                                                                          – Positive impact from working
                                                                                                                            capital following active
                                                                                                              46   34       receivables collection
                                                                                       1    2

                                                -10 -10      -11 -19                                     -6
                                                                                                   -21

                             -76 -80                                     -80 -78
              Reported       Change in       Net financial    Taxes       Capital     Proceeds      Other     Free cash
               EBITDA         working           items                   expenditure from selling                flow
                              capital                                                  assets
                                                              H1 2020     H1 2019

21   July 23, 2020         Half-yearly Report 2020
Stable financial position

            MEUR                                     Jun 2020   Jun 2019   – Higher total assets following growth

            Total assets                               3,672      3,413    – Net debt decreased and gearing
                                                                             improved
            Operating working capital                    617        662

            Net debt                                     908      1,019
                                                                           – Improvement in adjusted ROI,
                                                                             decrease in adjusted ROE
            Equity & non-controlling interest          1,475      1,305

            Gearing                                      0.62       0.78

            Adjusted ROI1                              11.6%      11.5%

            Adjusted ROE1                              14.2%      14.8%

      1   Excluding IAC.

22   July 23, 2020         Half-yearly Report 2020
Progress towards long-term financial ambitions

                                                                                                                                                                                        H1                       Long-term
                                                             2014                2015                2016                2017               20181                2019
                                                                                                                                                                                       2020                       ambition

            Organic growth                                      6%                  4%                  4%                  3%                  5%                 6%                     -3%                            5+%

            Adjusted EBIT margin                             7.8%                8.7%                9.4%                9.0%                8.1%                8.6%                   8.8%                            10+%

            Net debt/Adj. EBITDA                                1.0                 1.6                 1.8                 1.8                2.3                 2.0                     2.0                             2-3

            Dividend payout ratio                             47%                 40%                 40%                 42%                 50%                47%2                                                40-50%

            – The long-term ambitions were updated at the Strategy Update on March 23, 2020
            – In April, the AGM authorized the Board of Directors to decide on the distribution of the dividend for 2019 in one or several
              instalments of a total maximum of EUR 0.89 per share

      1   FY 2018 figures restated for IFRS 16 impact
      2   The Annual General Meeting has authorized the Board of Directors to decide at a later stage and in its discretion on the distribution of dividend in one or several instalments of a total maximum of EUR 0.89 per share.
          Payout ratio of 47% corresponds to a dividend payout of EUR 0.89.

23   July 23, 2020           Half-yearly Report 2020
Looking forward
Outlook 2020

     Disturbance from the COVID-19 pandemic on Huhtamaki's operating environment is
     expected to continue. The demand especially for food on-the-go packaging may be
     significantly negatively impacted whilst demand for food on-the-shelf packaging and
     convenience tableware may be positively impacted. Huhtamaki's diversified product
     portfolio provides resilience to the effects of the pandemic.

25   July 23, 2020   Half-yearly Report 2020
Short-term risks and uncertainties

     The COVID-19 pandemic including a potential second wave of the pandemic is a significant
     short-term risk potentially creating disturbance in the Group’s trading conditions and its
     operating environment, as well as in demand for the Group’s products. Volatile raw
     material and energy prices as well as movements in currency rates are considered to be
     relevant short-term business risks and uncertainties in the Group's operations. General
     political, economic and financial market conditions can also have an adverse effect on the
     implementation of the Group's strategy and on its business performance and earnings.

26   July 23, 2020   Half-yearly Report 2020
Financial calendar 2020

       October 22
       Q3 2020 Interim Report

       November 10
       Segment update and site visit in
       Hämeenlinna, Finland
       More information will follow. Event subject to restrictions
       following COVID-19.

27   July 23, 2020   Half-yearly Report 2020
Disclaimer

     Information presented herein contains, or may be deemed to contain, forward-looking statements. These statements
     relate to future events or Huhtamäki Oyj’s or its affiliates’ (“Huhtamaki”) future financial performance, including, but not
     limited to, strategic plans, potential growth, expected capital expenditure, ability to generate cash flows, liquidity and
     cost savings that involve known and unknown risks, uncertainties and other factors that may cause Huhtamaki’s actual
     results, performance or achievements to be materially different from those expressed or implied by any forward-looking
     statements. By their nature, forward-looking statements involve risks and uncertainties because they relate to events
     and depend on circumstances that may or may not occur in the future. Such risks and uncertainties include, but are not
     limited to: (1) general economic conditions such as movements in currency rates, volatile raw material and energy prices
     and political uncertainties; (2) industry conditions such as demand for Huhtamaki’s products, pricing pressures and
     competitive situation; and (3) Huhtamaki’s own operating and other conditions such as the success of manufacturing
     activities and the achievement of efficiencies therein as well as the success of pending and future acquisitions and
     restructurings and product innovations. Future results may vary from the results expressed in, or implied by, forward-
     looking statements, possibly to a material degree. All forward-looking statements made in this presentation are based on
     information currently available to the management and Huhtamaki assumes no obligation to update or revise any
     forward-looking statements. Nothing in this presentation constitutes investment advice and this presentation shall not
     constitute an offer to sell or the solicitation of an offer to buy any securities or otherwise to engage in any investment
     activity.

28   July 23, 2020   Half-yearly Report 2020
For further information,
please contact us:

ir@huhtamaki.com
www.huhtamaki.com/investors
You can also read