Active lives children and young people survey - Sport England
←
→
Page content transcription
If your browser does not render page correctly, please read the page content below
active lives
 children and young
  people survey

    attitudes towards
     sport and physical
      activity (academic year 2017/18)
          Published March 2019

                                         1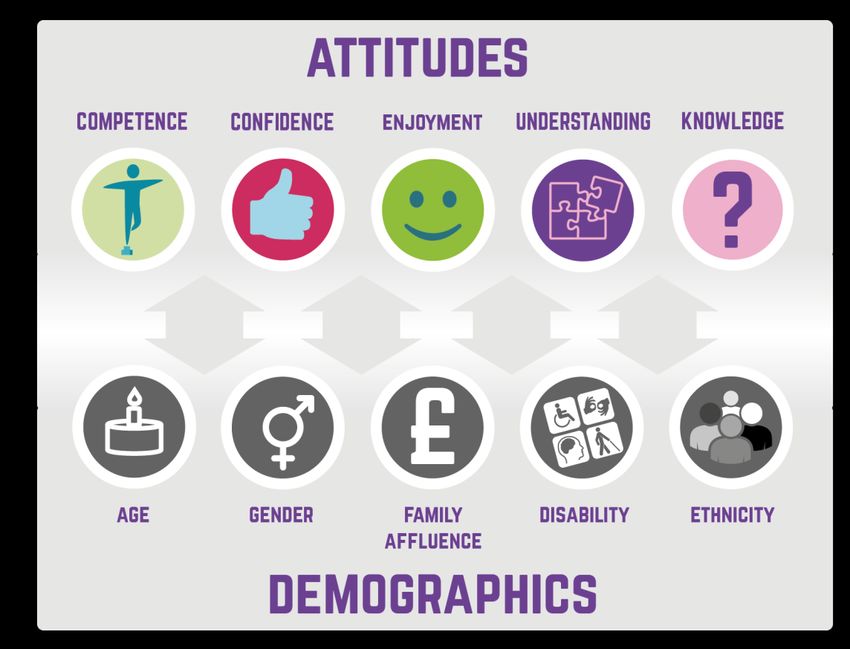
welcome                                                                                                    contents
Welcome to the second part of the Active Lives Children and Young People Survey year
                                                                                                             ▪    Key findings                    3
1 results. This report represents the richest ever data exploring how children and young
people aged 5-16 in England feel about sport and physical activity, measured between                              Background                      4
September 2017 and July 2018.
                                                                                                             ▪    Positive attitudes              5
The last report revealed that although 43% of children and young people lead active                          ▪    Attitudes and activity levels   7
lives, there is much more to do to increase activity levels at every age, whilst also
addressing some significant inequalities – including gender and affluence. To help with                      ▪    Attitudes and wider outcomes 10
that challenge, this report focuses on the five elements of physical literacy – enjoyment,
confidence, competence, understanding and knowledge. It identifies which of those                            ▪    Socio-demographic variations 20
elements – both individually and in combination – have the biggest impact on increasing                     ▪     Next steps                      26
levels of activity, mental wellbeing, resilience and social trust.
                                                                                                             ▪    Notes                           27
It’s well understood that increasing activity levels will make an important contribution to
improved physical wellbeing, but the data presented helps us better understand how                         key information
delivered in the right way, sport and physical activity can also contribute to better mental
wellbeing, individual development and social and community development outcomes for                        This report presents data from the
children and young people.                                                                                 Active Lives Children and Young
                                                                                                           People Survey for the academic year
The intention of this report is to summarise the key findings. We hope it becomes a                        2017/18. Data is presented for
valuable, practical tool to help the wide range of organisations with an interest in                       children and young people in school
providing children’s sport and physical activity understand and recognise the importance                   Years 1-11 (ages 5-16) in England.
of how children feel, alongside what activity they do.
                                                                                                           release dates
Finally, I would like to record my thanks to colleagues within the Department for Digital,                 This release: 21 March 2019
Culture, Media and Sport, the Department of Health and Social Care and the                                 Next release: TBC
Department for Education who have been key partners in the delivery of this survey, the
network of Active Partnerships who have recruited the schools to take part and finally                     find out more
the schools, children, parents and teachers who took the time to complete the survey.
                                                                                                           For further information on the data
                                                                                                           presented in this report, please visit the
Lisa O’Keefe Insight Director                                                                                                                         2
                                                                                                           Active Lives section of our website.
                                                                             Creating a lifelong sporting habit                                        2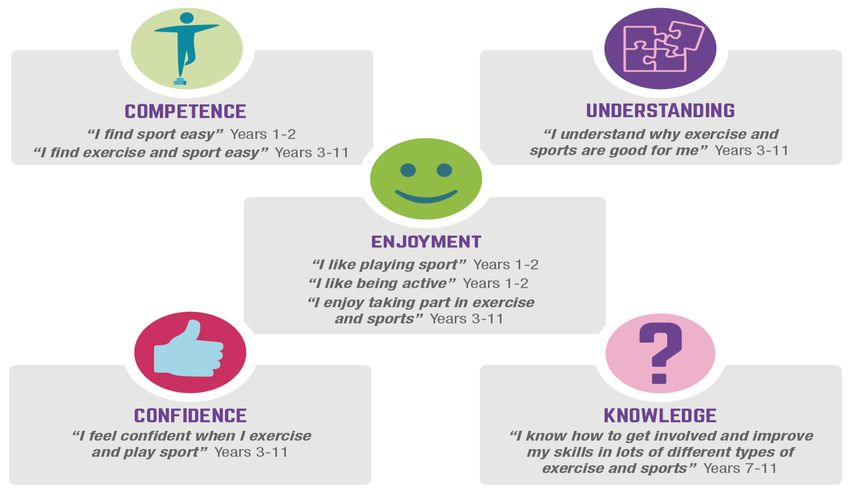
key findings
Children and young people’s attitudes to sport and physical activity are key to understanding their levels of activity,
mental wellbeing, resilience and social trust.

         the report has five key findings:

          Physically literate children and young people              Physically literate children and young people
    1     are more likely to be active                         3     are happier, more resilient and more trusting
          Physical literacy has five elements – enjoyment,           of other children and young people
          confidence, competence, understanding and                  The more elements of physical literacy present,
          knowledge. The more elements present, the more             the higher the levels of happiness, resilience and
          active a child or young person is likely to be.            social trust.

          Enjoyment is the biggest driver of activity                Physical literacy declines with age
    2                                                          4     As children and young people grow older, they
          While all of the reported attitudes make a
          difference, enjoying sport and physical activity           report lower levels of enjoyment, confidence,
                                                                     competence and understanding.
          makes the biggest difference to activity levels.
                                                                     There are important inequalities that must
                                                               5     be tackled
                                                                     Girls and those from less affluent families are less
                                                                     likely to enjoy being active.

These findings will be used to inform a new attitudes-led market segmentation of children and young people.
More details on our next steps can be found on page 26.                                                                     3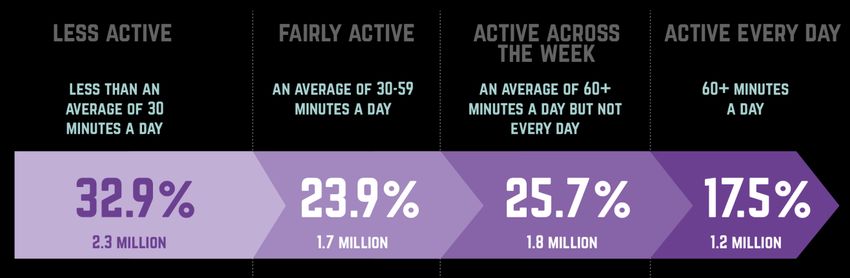
understanding
attitudes                              background
The Government’s Sporting              understanding attitudes towards sport
Future strategy identified that:
“Opportunity for children to take
                                       and physical activity is key
part in and develop a love of
                                       In December 2018, we published the first data from the Active Lives
sport and physical activity is vital
                                       Children and Young People Survey, revealing that while 3 million
to ensuring their long-term
                                       children are active, 2.3m do not reach at least an average of 30
enjoyment and participation.”
                                       minutes a day (are less active).
                                       This report builds on that analysis to look at the attitudes of children
The survey helps us understand
                                       and young people to sport and physical activity, and most importantly
the relationship between               how this impacts on their activity levels, mental wellbeing, resilience
attitudes, activity levels and wider   and levels of social trust.
outcomes. However, it does not
establish what causes positive (or
negative) experiences. As a next
step, we’ll be generating a market
segmentation of children and
young people based on these
attitudes (see page 26).

                                                                                                                  4
                                                         Creating a lifelong sporting habit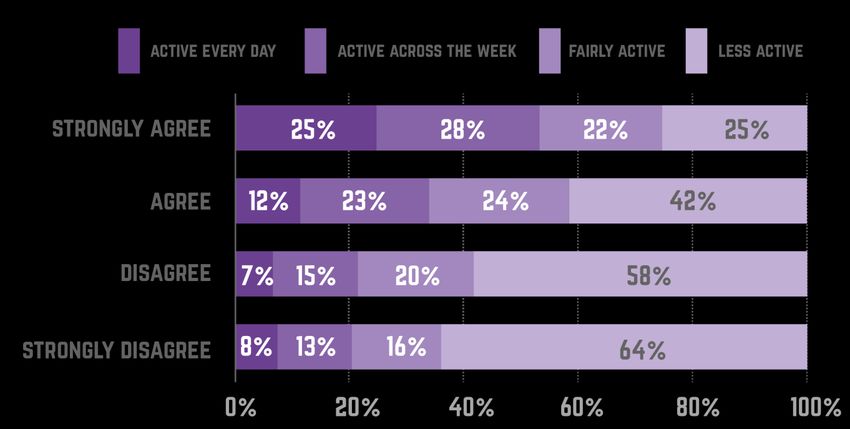
definitions                            positive attitudes
                                     When talking about individual attitude statements, we report where a child strongly
The International Physical           agrees1 with a statement as evidence of positive feelings towards it. For example, where a
Literacy Association’s definition    child strongly agrees that they enjoy taking part in sport, we describe that child as enjoying
of physical literacy has five        sport and physical activity. These statements were developed by an expert advisory group
elements: enjoyment,                 commissioned by the Department for Digital, Culture, Media and Sport and Sport England.
confidence, competence,
understanding and knowledge.
The organisation says these help
an individual “value and take
responsibility for engagement in
physical activities for life”.

Source: The International Physical
Literacy Association

We used this definition to
develop statements covering
each of the five attitudes that we
added to the survey.

                                         1By looking specifically at those who “strongly agree”, we both mitigate the tendency
                                         of children and young people to “agree” to socially desirable statements, and focus on
                                         how the firmest attitudes relate to activity and health and social outcomes.             5
positive attitudes
half of children and young people enjoy sport and physical activity
The majority of children and young people feel they understand why exercise and sports is good for them, but
just 51% strongly agree that they enjoy taking part, meaning 49% are not likely to receive the full benefits of
doing so.
Levels of feeling confident when taking part or finding sport easy (competence) are lower.
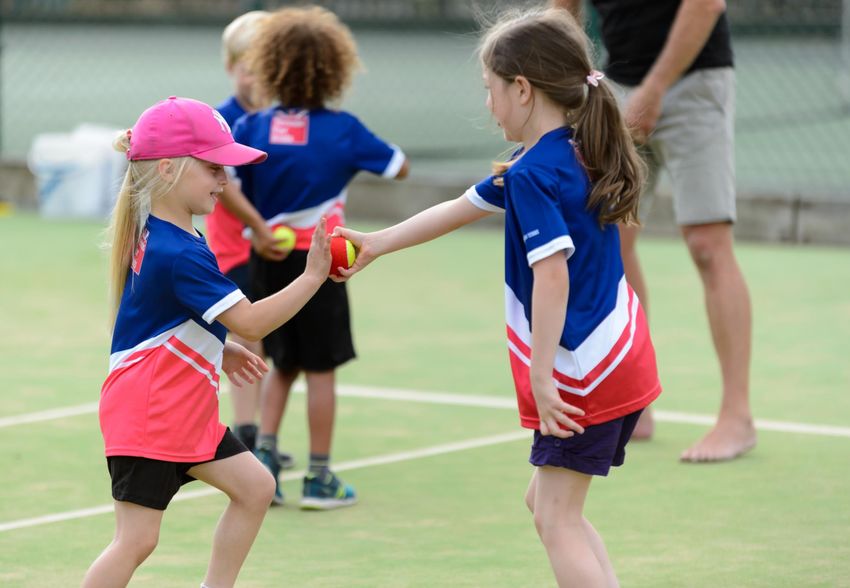
Years 1-2 (ages 5-7)
children
• The majority love being
active (63%) and love
playing sport (61%).
• 83% find sport easy.
6attitudes and activity levels
definitions
Activity Levels are broken into: WHAT DO WE MEAN BY SPORT AND PHYSICAL ACTIVITY?
• Active every day (at least
60 minutes every day)
• Active across the week
(an average of at least 60
minutes a day, but not every
day)
• Fairly active
(an average of 30-59 minutes
a day)
• Less active (less than an
average of 30 minutes a day).
7attitudes and activity levels
physically literate children and young people are more likely to be active
There’s a strong positive association between activity levels and enjoying it, feeling confident when taking
part and knowledge of how to get involved or improve. Over half of children and young people who strongly
agree that they enjoy taking part in exercise and sports are active – either every day or across the week. In
contrast, the majority who strongly disagree are less active.
While not as strong as it is with the other three attitudes, there’s still a clear positive association between
activity levels and finding sport easy (competence) and understanding why taking part is good for them.
“i enjoy taking Years 1-2 (ages 5-7)
children
part in exercise
and sports” Of those who love
years 3-11 playing sport, 54% are
(ages 7-16) active (every day or
across the week),
compared with 47% of
those who like playing
sport.
There’s no association
between finding sport
easy and levels of
activity.
8attitudes and activity levels
enjoyment is the biggest driver of activity levels Understanding the chart
Further analysis highlights the importance of the combination (and number) of The ticks in the table represent
positive attitudes, with enjoyment being the key driver (see darker outlines). which attitudes are present. The
numbers indicate the relative
years 3-6, activity levels outside school by positive attitudes difference in minutes of activity.
See page 29 for more details.
Enjoyment is the key driver of activity levels –
those who strongly agree that they enjoy taking
part do 33% more minutes of activity than those higher
who don’t. In addition, combinations of attitudes
including enjoyment drive more minutes of activity.
Relative
difference in
minutes of
activity
Index of
relative difference: lower
Strong agreement with all four attitudes drives the greatest number of minutes
– more than twice as many compared to strongly agreeing to none of them.
link to appendices 9attitudes and wider outcomes
definitions
This chapter presents data
looking at the associations
between attitudes and wider
outcomes for children and young
people, both overall and linked to
their levels of engagement in
sport and physical activity.
Measures covered are:
• Mental wellbeing (happiness)
• Individual development
(resilience)
• Social and community
development (social trust). Sport Satellite
Accounts
10attitudes and mental wellbeing
physically literate children and young people are happier
Those who strongly agree that they enjoy taking part have an average happiness score of 7.7 out of 10. This falls to
4.5 for those who strongly disagree. A similar pattern is seen for all the other attitudes.
“How happy did you feel yesterday?” years 3-11 (ages 7-16) Years 1-2 (ages 5-7) children
(mean score out of 10, where 10 is very happy and 0 is not happy at all)
All attitude statements are positively
associated with happiness.
11attitudes and mental wellbeing
the more elements of physical literacy present, the higher the levels of happiness
Further analysis highlights the importance of the combination (and number) of
Understanding the chart
attitudes present. For Years 3-6 (ages 7-11), understanding why taking part is
good for them is the lowest driver of happiness (see darker outlines). The ticks in the table represent which
attitudes are present. The numbers
years 3-6, happiness by positive attitudes indicate the likelihood of reporting a
higher happiness score. See page 29
For younger children, understanding has less impact than for more details.
the other attitudes – those who strongly agree that they
understand why sport is good for them are 22% more likely higher
to report a higher happiness score than those who don’t.
For older children, understanding is not the lowest driver.
Likelihood
of reporting a
higher
happiness
score
Index of
relative difference:
lower
Younger children with all four positive attitudes (and older children with all five positive
attitudes) are three times as likely to report a higher happiness score than those with none.
link to appendices 12attitudes and mental wellbeing
positive attitudes are a stronger driver of happiness than activity levels
The highest happiness levels are seen where children and young people have both positive attitudes and are active
(either every day or across the week). However, when a positive attitude is not present, there’s little difference in
happiness, regardless of whether a child or young person is active or not.
impact of attitudes and activity levels on happiness: years 3-11 (ages 7-16)
(mean score out of 10, where 10 is very happy and 0 is not happy at all)
13attitudes and resilience
physically literate children and young people are more resilient
Of children and young people who strongly agree that they find sport and exercise enjoyable, 51% report high levels of
resilience. This falls to 16% for those who strongly disagree. The same pattern is seen for the other attitudes.
There’s similarly a strong association between the number of positive attitudes and resilience.
“if i find something difficult, i keep trying until i can do it” years 3-11 (ages 7-16)
(proportion who strongly agree)
14attitudes and resilience
the more elements of physical literacy present, the higher the levels of resilience
Further analysis highlights the importance of the combination (and number)
of positive attitudes present. For Years 3-6 (ages 7-11), feeling confident Understanding the chart
when taking part and understanding why taking part is good for them are
The ticks in the table represent which
the key drivers of resilience (see darker outlines). attitudes are present. The numbers
indicate the likelihood of reporting
years 3-6, resilience by positive attitudes resilience. See page 29 for more details.
For younger children, confidence and understanding have a greater impact
than the other attitudes – those who strongly agree that they’re confident when higher
taking part or understand why taking part is good for them, are twice as likely
to report being resilient than someone without any positive attitudes. For older
children, knowing how to get involved or improve is the key driver of resilience. Likelihood
of
reporting
resilience
Index of
relative difference: lower
Children and young people with all four positive attitudes are 10 times as
likely to report being resilient than someone without any positive attitudes. 15
link to appendicesattitudes and resilience
positive attitudes are a stronger driver of resilience than activity levels
Children and young people who have positive attitudes and are active (both every day and across the week), are
more likely to be resilient. However, when a positive attitude is not present, there’s little difference in resilience,
regardless of whether children and young people are active or not.
impact of attitudes and activity on resilience: years 3-11 (ages 7-16)
(proportion who strongly agree)
16attitudes and social trust
physically literate children and young people are more trusting of each other
Around 30% of children and young people who have a positive attitude to any of the statements have high levels
of social trust. This falls to around 20% for those who only agree to the statement.
There’s similarly a strong positive association between the number of positive attitudes and social trust.
“How much do you feel you can trust people of a similar age to you?” Years 3-11 (ages 7-16)
(proportion who said ‘a lot’)
17attitudes and social trust
the more elements of physical literacy present, the higher the levels of social trust
Further analysis highlights the importance of the combination (and number) of Understanding the chart
positive attitudes present. For Years 3-6 (ages 7-11), understanding why taking
part is good for them is the key driver of social trust (see darker outlines). The ticks in the table represent
which attitudes are present.
years 3-6, social trust by positive attitudes The numbers indicate the
likelihood of reporting they
For younger children, understanding has a greater impact than the other attitudes trust others. See page 29 for
– those who strongly agree that they understand why sport is good for them are more details.
29% more likely to report trusting others of a similar age to them, than someone
with no positive attitudes. For older children, feeling confident when taking part or higher
knowing how to get involved or improve are the key drivers of social trust.
Likelihood
of
reporting
they trust
others
Index of
relative difference:
lower
Children and young people with all four positive attitudes are twice as likely to report
they trust others of a similar age to them than someone with no positive attitudes. 18
link to appendicesattitudes and social trust
positive attitudes are a stronger driver of social trust than activity levels
The highest social trust levels are seen when children and young people both have positive attitudes and are
active (both every day and across the week). However, where a positive attitude is not present, there’s little
difference in levels of social trust, regardless of whether children and young people are active or not.
impact of attitudes and activity levels on social trust: years 3-11 (ages 7-16) (proportion who said ‘a lot’)
19definitions socio-demographic variations
The following groups are The previous chapters show the clear associations between attitudes and
covered: both activity levels and health and social outcomes. It’s also important to
understand how attitudes are distributed across demographic groups to
• Age using school year highlight the important inequalities that should be tackled.
• Gender
• Socio-economic status using
the family affluence scale
• Disability using ‘needs extra
help’
• Ethnicity.
See notes page for further details
on these demographic groups.
20differences by school year
physical literacy declines with age
Younger children are more likely to report a positive attitude than older children.
• The majority of younger children strongly agree to between one and three of the attitudes.
• Older children are most likely to strongly agree to just one or fewer.
This gap is widest for feeling confident when taking part, and is slightly narrower for understanding why
taking part is good for them.
the presence of positive
attitudes: years 3-11 (ages 7-16)
(proportion who strongly agree)
21differences by gender
girls are less likely to enjoy being active than boys
Boys are more likely to report a positive attitude than girls across all statements. This gap is widest for finding
sport and physical activity enjoyable and feeling confident when taking part.
the presence of positive attitudes: years 3-11 (ages 7-16) (proportion who strongly agree)
Years 1-2 (ages 5-7)
children
Boys are more likely to
love playing sport, while
girls are more likely to
love being active.
Boys are slightly more
likely than girls to say
they find sport easy.
22differences by family affluence
those from the least affluent families are less likely to enjoy being active
Those from the least affluent families are less likely to report positive attitudes to sport and exercise. The gap is
narrowest for finding sport easy (competence).
the presence of positive attitudes: years 3-11 (ages 7-16) (proportion who strongly agree)
23differences by disability
understanding of why taking part is good for them is lower for children and young
people with a disability
Children and young people with a disability are less likely to report they enjoy taking part, they feel confident
when taking part and they understand why taking part is good for them, than those without a disability.
There’s no difference for finding sport easy (competence) and knowing how to get involved or improve.
the presence of positive attitudes: years 3-11 (ages 7-16) (proportion who strongly agree)
24differences by ethnicity
black children are more physically literate than all other ethnic groups
Black children and young people are more likely to report they enjoy taking part, they feel confident when
taking part and they know how to get involved or improve, than those from other ethnic groups.
In contrast, Asian children and young people are less likely to report they find sport easy (competence)
than those from other ethnic groups.
the presence of positive attitudes: years 3-11 (ages 7-16) (proportion who strongly agree)
25segmentation next steps
Market segmentation is the We’ll build on this analysis by creating a market segmentation of
process of dividing the population children and young people in England. This will be based on their
into groups, or segments, based sport and physical activity behaviours and attitudes, supplemented
on different characteristics – in by wider market insight.
this case their attitudes towards
We hope to start sharing resources from this later in 2019.
sport and physical activity.
Grouping individuals in this way
will let us tailor delivery in a more
informed way to maximise the
impact we have.
26
Creating a lifelong sporting habitnotes data considerations definitions
the active lives children and the achieved sample moderate activity is defined as activity
Young People survey is an online Attitudinal responses: 130,194 (pupils in where you raise your heart rate and feel a
Years 1-11) little out of breath (children were asked
survey
Behavioural responses: 109,503 (parents of whether it made them breathe faster).
Carried out by Ipsos MORI, it involves pupils in Years 1-2 and pupils in Years 3-
online questionnaires being completed 11). At school refers to activity done while at
in school during lesson time. Parents of school, during normal school hours. It
Years 1-2 children are asked to data have been weighted to Department for includes activities in PE lessons and break
complete a separate online Education pupil population estimates from times, but excludes activities at before and
questionnaire providing behavioural the January 2016 school census for after school clubs, even if these take place
data for these children – the children geography and key demographics. at school.
themselves answer basic questions confidence intervals can be found in the
about their attitudes only. outside School refers to activity done
linked tables. These indicate that if outside of school hours. It includes anything
repeated samples were taken and done before getting to school and after
More information on the survey can be confidence intervals computed for each leaving school (including travel to/from), as
found here. sample, 95% of the intervals would contain well as activity done at the weekend, on
the true value. Only significant differences holiday days and at before and after school
are reported within the commentary. Where clubs, even if these took place at school.
results are reported as being the same for
two groups, any differences fall within the Associations
margin of error. Where associations between attitudes and
activity levels, mental wellbeing, individual
development or community development
are referenced, this doesn’t tell us about
causality. We don’t know the direction of
the association or whether we’re seeing a
Link to more information on direct or indirect link.
measures and demographics
27notes demographic groups for children
Standard demographic breakdowns Age disability
are not applicable for children of all The survey is undertaken in schools, therefore Limiting disability is defined as an individual
ages, therefore simpler questions we have used school year as the main age reporting they have a physical or mental health
were often used. variable. This is split into three groups: condition or illness that has lasted or is
• Years 1-2 (ages 5-7) expected to last 12 months or more, and that
• Years 3-6 (ages 7-11) this has a substantial effect on their ability to
• Years 7-11 (ages 11-16). do normal daily activities. Here, we just ask
about disability without the reference to it being
gender limiting or long term. A slightly adapted version
Children and young people were given the option of the standard Office for National Statistics
to select boy, girl, other or prefer not to say. (ONS) harmonised disability question (to make
Responses to ‘other’ are included in the data the language appropriate to children) is asked
tables but not presented in this report due to low to parents of children in Years 1-2 and to
sample sizes. young people in Years 7-11. However,
comparisons shouldn’t be made as parents
family affluence scale and young people are likely to respond
The Family Affluence Scale provides an differently. A simpler question, ‘do you need
indication of the social status of children and additional help’, is asked of Years 3-6 children.
young people’s families. The scale is derived This gets higher levels of agreement.
from a series of questions about their home and
family such as car ownership, computers, and ethnicity
foreign holidays. Care should be taken when Children and young people in Years 3-11 were
looking across year groups, as the age of the asked a simplified question about ethnicity,
child is likely to impact on certain elements of the while parents of Years 1-2 children were asked
scale (e.g. families with older children may be the full ONS standard question. For the
more likely to own digital devices and travel purposes of analysis, Chinese has been
abroad). grouped with ‘Other’ from the parent
responses.
Link to more information on
measures and demographics
28notes drivers analysis
data considerations The analytical technique used to establish • The main effects were translated into
1. Analysis was only undertaken on drivers of behaviours is regression analysis. indices to be compared to the reference
data with complete information. This is a statistical technique which reveals group. An index of 1.25 indicates a 25%
2. Analysis was split by Years 1-2, associations between children’s activity levels greater likelihood to report the measure in
Years 3-6 and Years 7-11 age (or outcomes) with each of their personal question (i.e. minutes of activity, happiness,
groups. socio-demographic characteristics and their resilience or trust).
agreement or not to the attitude statements. It • Main effects were also combined to look at
3. Moderate minutes of sport and
reveals which characteristics are influential for the impact of combinations of attitudes on
physical activity were analysed by
the activity time being modelled. the measure, again being translated into
both at school and outside indices to aid interpretation.
school separately. Characteristics may show complex
4. Happiness was analysed on a 10- relationships with each other. For example, the We should consider findings as giving us broad
point scale. For infant, happiness effect of an attitude may be different for boys indications, rather than seeing it as a cause
was analysed by agree vs and girls, therefore ‘main effects’ were and effect model.
neutral/disagree. calculated for each attitude indicating the
5. Resilience and trust were analysed impact of the presence of that attitude,
by strongly agree vs do not regardless of the other attitudes and socio-
strongly agree. demographic characteristics.
6. Attitudes were analysed by those
Specifically:
who strongly agree vs those who
• A reference group was set (with index 1.00)
do not strongly agree. For infant,
based on those who do not strongly agree to
‘find sport easy’ was analysed by all attitude statements AND those who are
yes vs no. male, from high affluence families, do not
have a disability, are from white British
backgrounds and are in Years 6-7
(primary/secondary analysis).
see appendices
29You can also read