Business development of the Deka Group - as at 31 December 2018 Frankfurt/Main, 9 April 2019

Page created by Tracy Duran
 
CONTINUE READING
Business development of the Deka Group - as at 31 December 2018 Frankfurt/Main, 9 April 2019
Business development of the Deka Group
as at 31 December 2018
Frankfurt/Main, 9 April 2019
Business development of the Deka Group - as at 31 December 2018 Frankfurt/Main, 9 April 2019
Agenda

   The Deka Group at a glance                                                                                                                  3
   Business development                                                                                                                        6
   Total income and expenses                                                                                                                   7
   Total customer assets                                                                                                                       8
   Net sales                                                                                                                                   9
   Financial position                                                                                                                         10
   Regulatory capital and risk-weighted assets                                                                                                11
   Economic risk situation                                                                                                                    12
   Gross and net loan volume                                                                                                                  13
   Financial ratings                                                                                                                          14
   Sustainability ratings                                                                                                                     15
   Forecast for 2019 according to the 2018 Group management report                                                                            16
   Appendix                                                                                                                                   A

Presentation “Business development of the Deka Group as at 31 December 2018” published together with the Annual Report 2018 on 9 April 2019        2
Business development of the Deka Group - as at 31 December 2018 Frankfurt/Main, 9 April 2019
The Deka Group at a glance (1/3)
Wertpapierhaus of the German Savings Bank Finance Group

                                                                                                 Clients

               Corporate object                                                                                                                      Value creation

                                                                           German savings banks, savings
    Administration, management                                                                                                                At all points in the investment
                                                                            bank clients and institutional
     and investment of assets                                                                                                                             process
                                                                                      investors

  The Wertpapierhaus strategy and resulting business model assist savings banks with their securities business
                      and promote the acceptance of securities investments in Germany.

Presentation “Business development of the Deka Group as at 31 December 2018” published together with the Annual Report 2018 on 9 April 2019
                                                                                                                                                                                3
Business development of the Deka Group - as at 31 December 2018 Frankfurt/Main, 9 April 2019
The Deka Group at a glance (2/3)
Wertpapierhaus – value creation at all points in the investment
process
                                                                     Sales and sales support
                                                                     ▪   Advisor training and coaching
                                                                     ▪   Investment/advisory process
                                                                     ▪   Marketing support
                                                                     ▪   Implementation of regulations
             Asset servicing                                                                                                                  Product management
             ▪   Custodian                                                                                                                    ▪   ALM
             ▪   Master funds                                                                                                                 ▪   Strategic asset allocation
             ▪   DekaBank securities account                                                                                                  ▪   Choice of investment style
             ▪   S-Komfort securities account                                                                                                 ▪   Research

                                                                                                                                        Fund management
                                                                                                                                        ▪     Fundamental fund management
                               Implementation                                                                                           ▪     Quantitative fund management
                               ▪   Brokerage/execution                                                                                        and ETFs
                               ▪   Trading and structuring                                                                              ▪     Asset management and funds
                               ▪   Repo/securities lending                                                                                    of funds
                               ▪   Primary market activities                                                                            ▪     Real estate/debt funds

Presentation “Business development of the Deka Group as at 31 December 2018” published together with the Annual Report 2018 on 9 April 2019                                    4
Business development of the Deka Group - as at 31 December 2018 Frankfurt/Main, 9 April 2019
The Deka Group at a glance (3/3)
Clear strategic orientation – leading solution provider for asset
investment, management and administration

                                             Savings Banks Sales                                                              Institutional Sales
                                                      Retail clients                                                          Institutional clients

                             Asset Management (AM)                                                                                            Banking business

         AM Securities                           AM Real Estate                              AM Services                            Capital Markets         Financing

                                                                                        Corporate Center

Presentation “Business development of the Deka Group as at 31 December 2018” published together with the Annual Report 2018 on 9 April 2019
                                                                                                                                                                        5
Business development
Economic result at previous year’s level

 Economic result (in €m)
     Full year                               611
                                                                                              449                     452                      Despite a challenging market
                                                                     415
                                                                                                                                                environment in 2018, the Deka
                                                                                                                                                Group achieved a satisfactory
                                                                                                                                                economic result of €451.8m

 Cost/income ratio and return on equity (before taxes)
                                                                                        68.8%                    69.9%
     Cost-income ratio
                                        57.2%                   60.1%                                                                          Cost-income ratio was 69.9%
     Return on equity (before taxes)
                                                                                                                                               Return on equity (before taxes) was
                                                14.9%                   9.6%                    9.9%                     9.6%                   9.6%

 Total customer assets (in €bn)

                                                                                                                                               At €275.9bn, the Deka Group’s total
                                             240                     257                      283                     276                       customer assets were slightly down
                                                                                                                                                on the figure for year-end 2017 due
                                            2015                    2016                    2017                     2018                       to market-related factors

Presentation “Business development of the Deka Group as at 31 December 2018” published together with the Annual Report 2018 on 9 April 2019                                           6
Total income and expenses
Net commission income proves to be a key sustainable income
component – accounting for around 80% of income
 Total income (in €m)                                                                                       Total expenses (in €m)
     2017                                                                                                                                                                2017
     2018                                                                                                                                                                2018
                                                                            1,494 1,509
                              1,203 1,218

                                                                                                 Ʃ €452m                                           Operating
                                                                                                                                                   expenses
                                                                                                (py: €449m)
                                                                                                                     Total            Personnel      (incl.       Bank          Restructuring
  143 182                                       159 131                                                            expenses           expenses    depreciation)   levy           expenses
                        22                                       8
                                                                                                                                                                  35 30             5   19
                  -18                                                -44
Net interest    Risk        Net       Net                       Other            Total                                                              480 478
                                                                                                                                       524 531
 income      provisions commission financial                   operating       income
           in the lending income    income                       profit
           and securities                                                                                         1,045 1,057
              business

   Net interest income characterised by higher earnings contributions
    from the Financing and Capital Markets business divisions                                                 There was only a minor increase in personnel expenses year-on-
   Positive risk provisions chiefly due to the reversal of loss allowances                                    year
    that were no longer required                                                                              Operating expenses remained almost unchanged on the previous
   Adverse valuation effects on securities in the wake of spread                                              year. They also reflect the expenses incurred in relation to the
    movements had a negative impact on the net financial income from                                           implementation of regulatory requirements
    banking book portfolios
Presentation “Business development of the Deka Group as at 31 December 2018” published together with the Annual Report 2018 on 9 April 2019                                                     7
Total customer assets
Slightly down on the prior-year figure despite clearly positive net sales

 Total customer assets by customer segment (in €bn)
     Retail customers                                                                                  -3%
     Institutional customers                                                             283                          276                      The Deka Group was unable to fully
                               240                         257
                                                                                                                                                escape the cyclical effects arising
                                                           129                           139                          137                       from the negative performance of
                               123
                                                                                                                                                almost all asset classes in 2018
                               117                         128                           144                          139                      At €275.9bn, total customer assets
                                                                                                                                                were slightly down on the figure for
                            2015                          2016                         2017                          2018                       year-end 2017
 Total customer assets by product categories (in €m)                                                                                           The positive sales performance was
     31 Dec 2017
                                                                                                                                                accompanied by a market-induced
     31 Dec 2018
                                                                                                                                                negative investment performance at
                     141,166 137,249
                                                   115,057 109,585                                                                              the reporting date, distributions (from
                                                                                                                                                which customers benefited) and
                                                                                                                                                certificate redemptions
                                                                                  17,552 20,443                  9,113 8,602

                     Mutual funds and                   Special                     Certificates                      ETF
                     fund-based asset                  funds and
                       management                      mandates

Presentation “Business development of the Deka Group as at 31 December 2018” published together with the Annual Report 2018 on 9 April 2019                                               8
Net sales
Retail business remains clearly positve

 Net sales by customer segment (in €m)
                                                                                                                                               At €11.3bn, net sales in the retail
      Retail customers
                                                                                                                                                business remains clearly positive
      Institutional customers                                                          25,671
                            19,505                                                                                                             At €0.5bn, institutional business
                                                         16,914                        12,309                                                   was substantially down on the
                            10,196                        7,710                                                     11,773                      previous year, partly as a result of
                                                                                       13,362                       11,296                      the termination of an individual
                                9,308                     9,204                                                                 477             mandate (as planned) as part of
                            2015                          2016                         2017                          2018                       the integration of Deka
                                                                                                                                                Vermögensmanagement GmbH1) in
 Net sales by product category (in €m)                                                                                                          2018
      2017
      2018                                            9,724
                         8,492                                                      7,597 8,043
                                  4,547
                                                                                                                                               Equity funds, mixed funds, real
                                                                                                                          601                   estate funds and certificates made
                                                                                                                  -141                          up a particularly significant
                                                             -1,418                                                                             proportion of net sales
                      Mutual funds and                  Special                     Certificates                      ETF
                      fund-based asset                 funds and
                        management                     mandates
1) formerly   LBB-INVEST GmbH
Presentation “Business development of the Deka Group as at 31 December 2018” published together with the Annual Report 2018 on 9 April 2019                                            9
Financial position
Financial position remains sound

 Total assets (in €bn)
                                                                                                          +7%
                                       108                                                                              100                    Total assets amounted to
                                                                   86                         94
                                                                                                                                                approximately €100bn
                                                                                                                                               Leverage ratio of the Deka Group
                                                                                                                                                virtually unchanged at 4.6%
 Leverage ratio (fully loaded)                                                                                                                 The Deka Group’s LCR was
                                                                                                                                                149.8%, comfortably above the
                                                                 5.1%                       4.7%                       4.6%                     minimum requirements
                                       4.0%

 Liquidity coverage ratio (LCR)
                                                                                          152.5%                     149.8%
                                                                124.4%
                                      99.3%

                                      2015                       2016                      2017                       2018

Presentation “Business development of the Deka Group as at 31 December 2018” published together with the Annual Report 2018 on 9 April 2019                                        10
Regulatory capital and risk-weighted assets
Common Equity Tier 1 capital ratio (fully loaded) of 15.4%

 Change in regulatory capital and RWA (fully loaded)
                                                    16.7%                            16.7%                                                     Common Equity Tier 1 capital ratio
        Common Equity Tier 1                                                                                         15.4%                      (fully loaded) of 15.4%
        capital ratio
                                                                                                                                               The increase in Common Equity
                                                                                                                                                Tier 1 capital was offset by an
                                                                                                                                                increase in risk weighted assets
in €m
                                                                                                                      29,021                    (mainly credit risk and market risk)
                                                   23,813                           24,886
                                                                                                                                               Regulatory own funds requirements
     Credit risk                                                                                                      18,744                    were met at all times
                                                   15,038                           15,568
     Market risk
                                                                                                                                               2018 SREP requirement for the
     Operational risk
                                                   4,478      2,887                  5,127                             6,348                    Common Equity Tier 1 capital ratio
     CVA risk
                                                              1,411                  3,242     950                     3,365     565            (P2R requirement including
                                                   2016                              2017                             2018                      combined capital buffer, with
                                                                                                                                                transitional provisions) at 8.18%1)
in €m

Own funds                                          5,289                             5,442                              5,741
Tier 1 capital                                     4,451                             4,619                              4,933
Common Equity Tier 1 capital                       3,978                             4,145                              4,460

1) Minimum capital requirement calculated as at 31 Dec 2018

Presentation “Business development of the Deka Group as at 31 December 2018” published together with the Annual Report 2018 on 9 April 2019                                            11
Economic risk situation
Utilisation remains at non-critical levels

 Change in total risk1) (in €m) and utilisation ratios as at 31 Dec 2018

            2,440                                                2,492
                               2,039            2,035
                                                                                                                                                          Increase in total risk over
                                                                                                                               56.4%          67.4%        the course of the year
                                                                                                              42.1%
                                                                                                                                                           predominantly attributable
                                                                                                                                                           to the development of
            2015                2016             2017             2018                                         Risk           Max. risk        Risk        credit risk and market
                                                                                                             capacity         appetite        appetite     price risk
 Total risk1) and internal capital (in €m)                                                                                                                Utilisation remained at a
                                                                                                                                                           non-critical level
                                                                                                               5,920
                                                                                                                                                           throughout the whole of
                                                                                                                                4,420                      the year under review
                                                                                                                                               3,700
                                                                                              2,492
     1,416                                    269                250              36
                            520

     Credit           Market price Operational               Business        Shareholding   Total risk        Risk            Max. risk        Risk
      risk               risk         risk                     risk              risk                       capacity          appetite        appetite

1) Value-at-Risk   (VaR): confidence level of 99.9%, holding period of one year
Presentation “Business development of the Deka Group as at 31 December 2018” published together with the Annual Report 2018 on 9 April 2019                                       12
Gross and net loan volume
Difference between gross and net loan volume shows extent of
collateralisation
 Change in gross and net loan volume (in €bn)
     Gross loan volume            Net loan volume
                                                                                                                                               Average rating for the gross loan
         142                                                                 137
                                                                                                               151                              volume was 3 on the DSGV master
                                           124
                                                                                                                                                scale (corresponds to BBB on the
                    59                                                                  55
                                                                                                                          72                    S&P scale)
                                                      50

             2015                              2016                              2017                              2018

 Gross loan volume by countries and risk segments (as at 31 Dec 2018)
                                                                                          Other                                                The eurozone accounted for 71.8% of
                    Other
                                                                                               15%                                              the gross loan volume (previous year:
                            24%
                                                                                 Funds                                                          70.9%)
                                          45% Germany                                 11%
              France 7%                                                                 5%                  56% Financial institutions
                                                                       Savings banks
                      11%                                                               8%
          Luxembourg             13%                                        Corporates 5%
                                                                  Public sector (Germany)
                                 UK

Presentation “Business development of the Deka Group as at 31 December 2018” published together with the Annual Report 2018 on 9 April 2019                                             13
Financial ratings
Good ratings remain unchanged
                                                                  Standard & Poor’s                                                      Moody’s

 Preferred Senior Unsecured Debt1)                                                              A+                                                      Aa2 (stable)
                                                                                     Senior Unsecured Debt                                           Senior Unsecured Debt

 Non-Preferred Senior Unsecured Debt2)                                                           A                                                             A1
                                                                                    Senior Subordinated Debt                                       Junior Senior Unsecured Debt

Deposit Rating                                                                                 n/a                                                            Aa2
                                                                                                                                                          Bank Deposit

Counterparty Rating                                                                             A+                                                            Aa2
                                                                                    Counterparty Credit Rating                                       Counterparty Risk Rating

 Issuer Rating                                                                           A+ (stable)                                                    Aa2 (stable)
                                                                                       Issuer Credit Rating                                               Issuer Rating

 Own financial strength                                                                        bbb                                                           baa2
                                                                                   Stand-alone Credit Profile                                       Baseline Credit Assessment

Short-Term Rating                                                                              A-1                                                            P-1

As at: 9 April 2019
1) Senior unsecured notes, which are no dept instruments according to section § 46f (6) sentence 1 German Banking Act (KWG).
2) Senior unsecured notes, which are non preferred dept instruments according to section § 46f (6) sentence 1 German Banking Act (KWG)

Presentation “Business development of the Deka Group as at 31 December 2018” published together with the Annual Report 2018 on 9 April 2019                                       14
Sustainability ratings
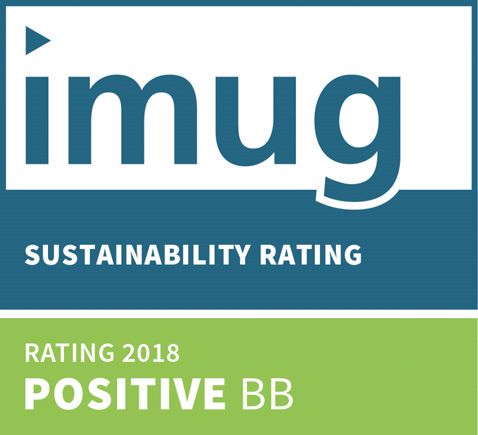
Ratings confirm our sustainable governance

   83 (# 11 / 332)                                                                                                                                                                     BB
                                                                          AA                                             C+ (prime)
     “Leader”                                                                                                                                                                        positive

  2013         2015          2017                           2016          2017          2018                         2015         2016          2018                        2017         2018          2019
    66           73            83                             AA            AA           AA                             C           C+            C+                         CC             B           BB

Sustainability ratings as at: MSCI: 24 May 2018; sustainalytics: 12 October 2017; oekom: 23 May 2018; imug: 4 March 2019 (Sustainability Rating: positive (BB); Mortgage Covered Bonds: positive (BBB); Public Sector
Covered Bonds: positive (BBB))
Presentation “Business development of the Deka Group as at 31 December 2018” published together with the Annual Report 2018 on 9 April 2019                                                                        15
Forecast for 2019 according to the 2018 Group management
report

                                                 2018                         Forecast 2019                        “The Group’s economic result in 2019 is expected to remain at
                                                                                                                   the level seen in the reporting year. The forecast economic
                                                                            Stable compared to
   Economic result                             €451.8m                                                             result will ensure that DekaBank remains able to distribute
                                                                               previous year
                                                                                                                   profits and to make the reinvestments necessary for the
                                                                                                                   purposes of capital management.”
    Total customer                                                            Noticeably above
                                              €275.9bn
        assets                                                                the previous year
                                                                                                                   “Expected returns for 2019 are based on ambitious sales plans
                                                                                                                   combined with an investment fund business that maintains
                                                                              Noticeably above                     lasting value, including regular securities saving.”
         Net sales                              €11.8bn
                                                                              the previous year

   Common Equity                                                                                                  “Despite anticipated charges for guarantee and Riester
  Tier 1 capital ratio                           15.4%                             Over 13%                       pension products among other things, the Common Equity
     (fully loaded)                                                                                               Tier 1 capital ratio (fully loaded) is expected to considerably
                                                                                                                  exceed the 13% target.”
  Utilisation of risk-                                                        Noticeably above
                                                 42.1%                                                             “Utilisation of risk capacity will rise appreciably in view of
        capacity                                                              the previous year
                                                                                                                   planned changes to the methodology, while also remaining at a
                                                                                                                   non-critical level.”

The Deka Group plans its future business development on the basis of assumptions that appear most probable from a current perspective. However, plans and statements about growth during 2019 are subject to
uncertainties.

Presentation “Business development of the Deka Group as at 31 December 2018” published together with the Annual Report 2018 on 9 April 2019                                                                    16
APPENDIX
Glossary 1/2

  As a key management indicator, together with economic risk, the economic result forms the basis for risk/return management in the Deka Group
  and is, in principle, determined in accordance with accounting and measurement policies of IFRS.

  As well as net income before tax, the economic result also includes:
   changes in the revaluation reserve before tax
   as well as the interest rate and currency related valuation result from financial instruments recognised at amortised cost, which are not
    recognised in the income statement under IFRS but are relevant for assessing financial performance.
   The interest expense in respect of AT1 bonds (Additional Tier 1 capital), which is recognised directly in equity, is also included in the economic
    result.
   Furthermore, the economic result takes into account potential future charges that are considered possible in the future but
    that are not yet permitted to be recognised under IFRS due to the fact that accurate details are not yet available.

  The economic result is therefore a control variable on an accrual basis whose high level of transparency enables
  recipients of the external financial reporting to consider the company from the management perspective.

Presentation “Business development of the Deka Group as at 31 December 2018” published together with the Annual Report 2018 on 9 April 2019              18
Glossary 2/2

   Common Equity Tier 1 capital ratio
    The Common Equity Tier 1 capital ratio is defined as the ratio of Common Equity Tier 1 capital to risk-weighted assets (RWAs) for all relevant
     credit, market and operational risk positions plus the credit valuation adjustment (CVA) risk.

    Internal capital in the economic risk-bearing capacity analysis
     In the economic risk-bearing capacity analysis, internal capital potential essentially consists of equity under IFRS, income components and
      positions of a hybrid capital nature (subordinated capital/AT1 capital). It is available in its entirety as a formal overall risk limit to guarantee the
      Bank’s risk-bearing capacity.

    Total customer assets
     Total customer assets essentially comprise the income relevant volume of mutual and special fund products (including ETFs) direct investments
      in cooperation partner funds, the portion of fund-based asset management attributable to cooperation partners, third party funds and liquidity,
      advisory/management mandates, certificates and third party managed master funds.

    Net sales
     Performance indicator of sales success in asset management and certificate sales. This figure essentially consists of total direct sales of mutual
      and special funds, fund-based asset management, funds of partner organisations, master funds and advisory/management mandates, ETFs
      and certificates. Sales generated through proprietary investment activities are not taken into account. Redemptions and maturities are not taken
      into account for certificates, since in the certificates business the impact on earnings primarily occurs at the time of issue.

Presentation “Business development of the Deka Group as at 31 December 2018” published together with the Annual Report 2018 on 9 April 2019                      19
Contact persons

Contact                                                     Michael Hahn                                                                Sven Jacoby
                                                            Head of Reporting & Rating                                                  Reporting & Rating
investor.relations@deka.de                                                                                                              Head of External Reporting & Rating
                                                            +49 (0)69 7147-5169
DekaBank                                                                                                                                +49 (0)69 7147-2469
Deutsche Girozentrale
Reporting & Rating
Hahnstrasse 55                                              Claudia Büttner                                                             Markus Ottlik
60528 Frankfurt/Main                                        Reporting & Rating                                                          Reporting & Rating
                                                            External Reporting & Rating                                                 External Reporting & Rating
                                                            +49 (0)69 7147-1514                                                         +49 (0)69 7147-7492

                                                            Silke Spannknebel-Wettlaufer
                                                            Reporting & Rating
                                                            External Reporting & Rating
                                                            +49 (0)69 7147-7786

Presentation “Business development of the Deka Group as at 31 December 2018” published together with the Annual Report 2018 on 9 April 2019
                                                                                                                                                                              20
Disclaimer

This presentation has been prepared by DekaBank for the purpose of informing the respective stakeholders. The assessments submitted here
have been made to the best of our knowledge and belief and come (in part) from sources that are not verifiable by us and are generally
accessible. Liability for the completeness, timeliness and accuracy of the information provided to the extent permitted by law, including the legal
remarks, is excluded. The information does not constitute an offer, an invitation to subscribe or purchase financial instruments or a
recommendation to purchase. The information or documents are not intended to form the basis of any contractual or other obligation.
The Deka Group Annual Report and the Interim Financial Report as well as the corresponding presentations contain forward-looking statements
as well as expectations and forecasts. These are based on the information available to us at the time of publication, which we have deemed to be
reliable after careful consideration. We do not assume an obligation to update based on new information and future events after the publication of
this information. We have derived our estimations and conclusions from these forward-looking statements, expectations and forecasts. We
expressly point out that all of our future-oriented statements are associated with known or unknown risks or imponderables and are based on
conclusions relating to future events, which depend on risks, uncertainties and other factors that are outside of our area of influence. Such
developments can result from, among other things, a change in the general economic situation, the competitive situation, the development of the
capital markets, changes in the tax law and legal framework and from other risks. The events actually occurring in the future may thus turn out to
be considerably different from our forward-looking statements, expectations, forecasts and conclusions. We can therefore assume no liability for
their correctness and completeness or for the actual occurrence of the information provided.
The presentation may not be reproduced in excerpts or as a whole without the written permission of DekaBank or passed on to other persons.
The English translation of the Deka Group Annual Report is provided for convenience only. The German original is definitive.
Due to rounding, slight deviations may occur in the present presentation for totals and for calculations of percentages. Annual figures refer to
both key dates and time periods.
© 2019 DekaBank Deutsche Girozentrale, Mainzer Landstr. 16, 60325 Frankfurt/Main

Disclaimer
Presentation “Business development of the Deka Group as at 31 December 2018” published together with the Annual Report 2018 on 9 April 2019           21
You can also read