Which local areas are most at risk in terms of impacts of coronavirus on employment? - RSA
←
→
Page content transcription
If your browser does not render page correctly, please read the page content below
Which local areas are most at risk in terms of impacts
of coronavirus on employment?
Authors: Fabian Wallace-Stephens, Alan Lockey
New RSA analysis finds a stark geographical divide in terms of how coronavirus could impact
employment in local areas, with rural areas in the north and south west of England most at risk.
Most of the less vulnerable areas can be found either in London itself or in the city’s
surrounding commuter belt. Our analysis also shows that younger workers are more at risk of
losing their job than older age groups.
Introduction and findings
On 23 April the Office of National Statistics (ONS) published the second wave of its Business
Impact of Coronavirus (Covid-19) Survey (BICS). This is part of a series of quickly collected,
more experimental datasets developed by the statistics agency in order to “provide a closer
picture of the impact Covid-19 and some of the measures introduced by the UK government in
response to the pandemic are having on the labour market”. 1
Figure 1: Percent of the workforce that have been furloughed, by industry
Source: ONS, Business Impact of Coronavirus Survey (BICS)
Accommodation and food service…
Arts, entertainment and recreation
Construction
Manufacturing
Administrative and support…
All industries
Transportation and storage
Wholesale and retail trade; repair…
Human health and social work…
Professional, scientific and…
Water supply; sewerage, waste…
Information and communication
Education
0% 20% 40% 60% 80% 100%
The survey reveals what proportion of the workforce has been furloughed using the
government’s coronavirus job retention scheme (CJRS) across different industries. Hospitality or
‘accommodation and food services’ (80% of workers); ‘arts, entertainment and recreation’
(68%); and construction (41%) are the industries where the largest share of workers have been
furloughed. Meanwhile in industries such as ‘education’ (4%) and ‘information and
communication’ (7%) less than 10% of workers have been furloughed. This dataset includes
1ONS. (2020) Furloughing of workers across UK businesses: 23 March 2020 to 5 April 2020 [Dataset] Available at:
https://www.ons.gov.uk/employmentandlabourmarket/peopleinwork/employmentandemployeetypes/articles/furloughin
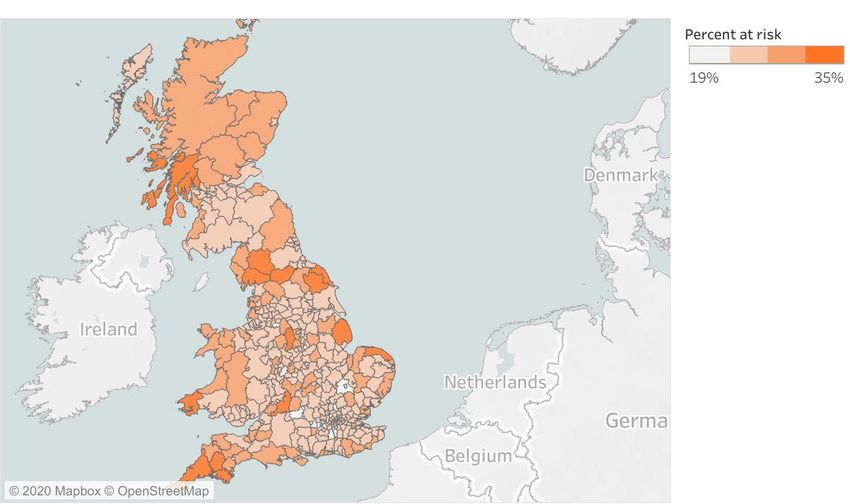
gofworkersacrossukbusinesses/23march2020to5april2020responses from over six thousand businesses that were either still trading or had temporarily paused trading, for the period 23 March - 5 April 2020. The RSA has mapped this data onto the industrial composition of different local authority areas allowing us to identify which parts of the country are most exposed to the labour market risks associated with Covid-19 (see the appendix for a more detailed outline of our methodology). These risks include unemployment - which the CJRS was specifically designed to prevent – and the immediate hit to local economic resilience that comes with having a higher proportion of workers receiving 80% of their salary, as the CJRS allows. In lieu of better data, the number of furloughed workers also provides a sense-check on which areas of the country might be suffering most from the ‘demand shock’ economic impact of Covid-19. This is particularly important for policymakers to consider because even if lockdown measures are relaxed demand may not return to the same levels for many industries. Our analysis finds a stark geographical divide in how Covid-19 could impact local labour markets, with rural areas and coastal towns most at risk of high job losses. Many of the most vulnerable areas are located in the north and south west of England. Cities and other urban areas tend to be less at risk, particularly local authority areas located in London or in its surrounding commuter belt. However, whilst there are clear hotspots of vulnerability, the small degree of variation between the most (Richmondshire, 35% of jobs at risk) and least at risk (Oxford, 19%) suggests that the impacts of Covid-19 will be widely felt across the country. In fact, Oxford is the only local authority area in the country where fewer than one in five workers are at risk – and even then, marginally so. Figure 2: Percent of jobs at risk due to coronavirus by local authority Source: RSA analysis of Business Impact of Coronavirus Survey (BICS) and Business Register and Employment Survey (BRES) 2018 Explore our interactive data map
Which areas are most at risk?
The top 20 areas most vulnerable to the labour market impacts of Covid-19 are largely rural
areas located in the north or south west of England. Many are national parks, coastal towns and
other tourist hotspots where the economy is geared towards hospitality and retail. Some of these
areas also have a relatively high level of workers in manufacturing or construction, two other
sectors that have been adversely affected. In summary, we found:

    •   Richmondshire in North Yorkshire is the most at-risk area, with 35% of jobs at risk from
        Covid-19. This district council forms part of Chancellor Rishi Sunak’s constituency.
        Relative to the UK average of 25% of jobs at risk this area is 39% more exposed than
        the rest of the UK (see Figure 3).

    •   Other areas most at risk include parts of the Lake District and Peak District, such as
        Eden (34% of jobs at risk), South Lakeland (33%) and Derbyshire Dales (33%).

    •   Seaside towns and coastal areas also feature heavily in the top 20 at-risk areas. This
        includes East Lindsey (34% of jobs at risk) and Cornwall (31%).

    •   Pembrokeshire and Conway are the most at-risk areas in Wales, both with 31% of jobs
        at risk. Argyll and Bute is the most at risk in Scotland, with 32% of jobs at risk.

Figure 3: Percent of jobs at risk due to coronavirus relative to UK average (UK = 0) for 10
most and least at-risk areas
Source: RSA analysis of Business Impact of Coronavirus Survey (BICS) and Business Register
and Employment Survey (BRES) 2018

        Richmondshire
                   Eden
           East Lindsey
        South Lakeland
      Derbyshire Dales
          Scarborough
           West Devon
                Ryedale
        Argyll and Bute
               Cornwall
                     UK
   Vale of White Horse
        Tower Hamlets
 South Cambridgeshire
         City of London
                Reading
            Wokingham
       Bracknell Forest
       Welwyn Hatfield
             Cambridge
                  Oxford

                           -30   -20     -10      0       10       20      30       40

                                 Relative exposure to Covid-19 jobs risk (UK = 0)
What areas are least at risk?
Of the top 20 least vulnerable areas, most are in London and its surrounding commuter belt in
the south east and east of England. Many of these areas have a more diverse local economy with
a high concentration of jobs in ‘knowledge economy’ services that allow workers to easily work
from home. Previous RSA analysis has explored homeworking trends in more depth, finding a
strong relationship between the ability to work from home and earnings: those who are least
likely to work from home are often the lowest paid. 2 In summary, we found:
• University hubs Oxford (19% of jobs at risk) and Cambridge (20%) are the two least at-
risk areas, with these areas at least 20% less exposed than other parts of the UK.
• Areas in the home counties - such as Welwyn Hatfield, Bracknell Forest, Wokingham
and Reading (21% of jobs at risk respectively) - where large number of workers are
employed in professional services and information and communication are also less
vulnerable.
• Similarly, several London boroughs including City of London (21%), Tower Hamlets
(22%), Southwark (23%) and Camden (23%) also feature in the top 20 least at risk.
How do different demographic groups fare?
We also used our approach to explore the vulnerability of different demographic groups to the
labour market impact of Covid-19. Our main finding is that younger workers are overwhelmingly
more likely to be furloughed – nearly twice as likely as middle-aged workers. This is particularly
worrying for policymakers as evidence shows younger workers hit by recession and
unemployment early in their working lives often suffer particularly long-lasting economic
consequences. This dynamic was particularly pronounced in the aftermath of the 2008 financial
crash. 3 In summary, we found:
• Younger workers are more at risk: 40% of jobs performed by 16- to 19-year-olds are at
risk, whilst the next most vulnerable group is 20-24 year olds (30%). 16- to19-year-olds
are nearly twice as likely to be furloughed as middle-aged workers.
• Men are slightly more at risk than women (26% vs. 21%). This reflects the sectoral
impact of Covid-19 on the labour market with high male-employment sectors, such as
manufacturing and transport, particularly vulnerable. Whilst there are a high proportion of
women in the most affected industries, such as hospitality and retail, this is balanced by
high levels of female employment in less affected sectors, such as health and education.
2 Wallace-Stephens, F. and Grimond, W. (2020) Low pay and a lack of homeworking: Why workers are suffering
during lockdown’ [Blog] RSA. Available at: https://www.thersa.org/discover/publications-and-articles/rsa-
blogs/2020/04/low-pay-lack-homeworking
3
See for example: Bell, D. and Blanchflower, D. Young People and the Great Recession, Institute for Study of Labour
(IZA), Bonn. Available here: http://ftp.iza.org/dp5674.pdfFigure 3: Percent of jobs at risk due to coronavirus by age group
Source: RSA analysis of Business Impact of Coronavirus Survey (BICS) and Labour Force
Survey (Oct-Dec 2019)
0% 10% 20% 30% 40% 50%
16-19yrs
20-24yrs
25-29yrs
30-34yrs
35-39yrs
40-44yrs
45-49yrs
50-54yrs
55-59yrs
60-64yrs
How to support these workers?
The RSA is calling for the government to respond to the crisis at scale and use its policy
interventions to build bridges to a more resilient future. The first step must be to mitigate the
labour market vulnerability exposed by our analysis. So widespread are these risks that the
government must now consider extending the CJRS beyond its current June deadline. The CJRS
must be decoupled from the debate about relaxing lockdown rules – even if many businesses
are formally allowed to trade, it is unlikely that demand for their services will return to the levels
needed to avert an enormous rise in unemployment. Even the least affected areas in our analysis
have around one in five workers on the CJRS scheme – a level of theoretical unemployment on
the scale of the early 1930s.
Beyond this we need a new ‘social contract’ between government, civil society, employers and
employees that can deliver greater economic security for all workers. This will require radical
reform of the welfare safety net and lifelong learning systems so that workers are supported,
both through this crisis and beyond, to transition to where the economy is creating jobs. The
RSA is advocating two policies as part of this:
• Universal basic income: A universal basic income (UBI) is a regular cash payment made
to all citizens, without any conditionality. Our modelling on planned pilots by the Scottish
government found a £4800 a year UBI would reduce relative household poverty by 33%and end destitution overnight. 4 This could be funded progressively by removing the
personal tax allowance.
• Personal learning accounts: Personal learning accounts are a flexible training policy,
used in countries such as France and Singapore, that grant all workers credits they can
spend on training courses accredited by the government. For example, in France each
worker receives €500 credits a year which can be accumulated over time up to a
maximum of €5000. The government should look to introduce this system here, targeted
initially at furloughed workers. According to the House of Commons library, as of autumn
2018 just £370m of the apprenticeship levy had been spent by employers, despite the
levy raising £3.5bn. 5 This is over £3bn of training money that could be deployed rapidly
to ensure that furloughed workers have access to training.
For further information, contact: Fabian Wallace-Stephens fabian.wallace-
stephens@rsa.org.uk or Alan Lockey alan.lockey@rsa.org.uk
4
Painter, A. Cooke, J. Burbridge, I. and Ahmed, A. (2019) A Basic Income for Scotland. RSA. Available at:
https://www.thersa.org/discover/publications-and-articles/reports/basic-income-scotland
5 Powell, A. and Foley, N. (April 2020) Apprenticeship Statistics for England. House of Commons Library. Available at:
https://commonslibrary.parliament.uk/research-briefings/sn06113/Appendix I: Methodology
Wave 2 of the ONS Business Impact of Coronavirus Survey (BICS) contains data on the
furloughing of workers across UK businesses between 23 March to 5 April 2020. This data
includes responses from businesses that were either still trading or had temporarily paused
trading.
We have mapped this data against the industrial composition of different local
authority districts to estimate which are most exposed to labour market risks associated with
Covid-19. The data on the industrial composition of local authorities comes from the Business
Register and Employment Survey (BRES) 2018, which is publicly accessible via NOMIS.
Our approach calculates the total number of jobs at risk in each local area by identifying the
number of jobs in each industry in that area multiplied by the estimated percentage of those that
have been furloughed on the government’s Coronavirus Job Retention Scheme (CJRS). We then
divide this by the total number of jobs in each local area to calculate the percentage of jobs at
risk.
The CJRS was set up by the government specifically to prevent growing unemployment and
the National Institute for Economic and Social Research (NIESR) has described furloughed
workers as technically unemployed.i It therefore seems the best available data with which to
calculate medium-term employment risk as a result of Covid-19. The number of furloughed
workers also clearly indicates where there could already be impacts on local economic resilience
due to the higher or lower proportion of workers receiving 80% of their salary, as the CJRS
allows.
The BICS does not contain responses for workers in Agriculture, Financial Services
and Public Administration and Defense. We exclude these industries from the denominator (total
number of jobs in each local area) used to calculate the percentage of jobs at risk.
Appendix II: Data tables
Table 1: 20 areas with the most jobs at risk due to coronavirus
Source: RSA analysis of Business Impact of Coronavirus Survey (BICS) and Business Register
and Employment Survey (BRES) 2018
Local authority Total Percent Region
number of jobs at
of jobs risk
at risk
Richmondshire 5,965 35% Yorkshire and the Humber
Eden 7,989 34% North West
East Lindsey 14,509 34% East Midlands
South Lakeland 17,424 33% North West
Derbyshire Dales 10,350 33% East MidlandsScarborough 14,458 33% Yorkshire and the Humber
West Devon 5,226 32% South West
Ryedale 7,699 32% Yorkshire and the Humber
Argyll and Bute 10,074 32% Scotland
Cornwall 66,878 31% South West
Pembrokeshire 13,313 31% Wales
Cotswold 13,526 31% South West
South Hams 11,436 31% South West
North Norfolk 10,063 31% East of England
East Devon 14,716 31% South West
Isle of Wight 15,423 31% South East
Conwy 12,907 31% Wales
Staffordshire Moorlands 8,733 30% West Midlands
Torbay 13,856 30% South West
Torridge 5,676 30% South West
Table 2: 20 areas with the least jobs at risk due to coronavirus.
Source: RSA analysis of Business Impact of Coronavirus Survey (BICS) and Business Register
and Employment Survey (BRES) 2018
Local authority: district / Total Percent Region
unitary (as of April 2019) number of of jobs at
jobs at risk
risk
Oxford 22,243 19% South East
Cambridge 21,077 20% East of England
Welwyn Hatfield 18,434 21% East of England
Bracknell Forest 12,422 21% South East
Wokingham 17,653 21% South East
Reading 20,831 21% South East
City of London 71,761 21% London
South Cambridgeshire 17,654 21% East of England
Tower Hamlets 48,605 22% London
Vale of White Horse 13,477 22% South EastCoventry 33,471 22% West Midlands
Southwark 49,699 22% London
Worthing 9,820 22% South East
Stevenage 9,755 22% South East
Slough 18,597 22% South East
Epsom and Ewell 6,488 22% South East
Worcester 11,606 22% West Midlands
Camden 79,862 23% London
Exeter 18,895 23% South West
Rushmoor 10,783 23% South East
i
Bell, D. and Blanchflower, D. US and UK Labour Markets Before and During the Covid-19 crash. National Institute
Economic Review Paper. NIESR. https://www.niesr.ac.uk/publications/us-and-uk-labour-markets-and-during-covid-
19-crashYou can also read