The past is key to the future; Collating historical cases of liquefaction to supplement liquefaction hazard assessments - Amazon AWS
←
→
Page content transcription
If your browser does not render page correctly, please read the page content below
The past is key to the future; Collating historical
cases of liquefaction to supplement liquefaction
hazard assessments
S.H. Bastin
Beca Ltd, Christchurch, New Zealand.

S. van Ballegooy
Tonkin & Taylor Ltd, Auckland, New Zealand.

M. Ogden
Tonkin & Taylor Ltd, Nelson, New Zealand.

ABSTRACT

Historical records indicate that consequential liquefaction has occurred during upwards of 11 earthquakes in
New Zealand since European settlement and prior to 2010. Post-event observations of land damage have been
collated into an online geospatial database that is now publicly available. The dataset outlines areas that have
historically liquefied, and thus are susceptible to liquefaction during future events, and may be used to
supplement Level A (Desktop) and Level B (Calibrated Desktop) liquefaction hazard assessments as per the
MBIE (2017) guidelines. Interrogation of the dataset indicates that liquefaction has primarily occurred in low
elevation areas proximal to waterways with 80 percent of the collated reports within 500 m of a river or stream.
Comparison of CPT traces in areas where liquefaction was and was not reported following the 2016 Kaikoura
earthquake show that liquefaction predominantly manifested in areas containing comparatively thick layers of
low relative density silty sands under PGA in excess of ~0.1g. The collated dataset enables calibration of
liquefaction triggering assessments against actual observations when combined with estimated ground shaking
intensities of the causative earthquake. Comparison of the predicted liquefaction hazard in Whakatane with
that observed following the 1987 Edgecumbe earthquake outlines areas of inconsistent prediction. Potential
reasons for the over-predictions include interlayering of soil types within distal floodplains and/or back swamp
environments, and/or the presence of pumice. It is anticipated that this work will help to characterize settings,
and/or geomorphic conditions where liquefaction typically manifests. The collated dataset provides a valuable
tool for desktop hazard studies and in the verification of liquefaction hazards as interpreted from simplified
analyses.

                                                       1
1    INTRODUCTION
Earthquake-induced liquefaction and associated lateral spreading pose a significant hazard to the built
environment. Heightened awareness of the consequences of liquefaction following the 2010-2011 Canterbury
earthquake sequence (CES) resulted in a series of guidelines for practicing engineers (i.e NZGS, 2016).
Subsequent recommendations made by the Royal Commission of Inquiry into Building Failure caused by the
Canterbury Earthquakes resulted in guidance to manage liquefaction related risk in land use planning with a
focus on regulatory framework (MBIE, 2017). The guidance outlines approaches for assessing liquefaction
hazards at range of scales based on the availability of geotechnical data ranging from a high-level regional
assessment down to site-specific analysis. Recommendations for Level A (Desktop) and Level B (Calibrated
Desktop) studies involve consideration of geology/ geomorphology, groundwater and seismic hazard, with a
qualitative assessment of some geotechnical data required for Level B. Both approaches may be supplemented
by historical records of liquefaction however these records are scattered throughout post-event literature so are
rarely considered.
Historical records indicate that consequential liquefaction has occurred during upwards of 11 earthquakes in
New Zealand since European settlement and prior to the 2010 Darfield earthquake (indicated in Figure 1).
Records of ‘ground cracking’ and ‘quicksand’ are often included in newspaper articles, photographs, and
diaries following historical earthquakes (i.e. pre-1850’s). These reports are typically held in museum archives
and in some cases have been collated and geospatially located to infer distributions of liquefaction (i.e. Fairless
and Berrill (1984) and Elkortbawi, (2017). Maps outlining distributions of liquefaction manifestations are
available following more recent events, however these are typically scattered throughout post-event
publications and technical reports. Fairless and Berrill (1984) previously collated pre-1984 records of
liquefaction into a tabular format and produced a New Zealand scale map outlining the spatial distribution of
the historical reports. The collated reports indicate that the liquefaction had generally been confined to
localized areas proximal to waterways however the map scale does not allow for site-specific interrogation and
subsequently the data cannot be readily incorporated into liquefaction hazard assessments.

Figure 1: Distribution of earthquakes since European settlement within New Zealand for which liquefaction
has previously triggered been reported.

                                                        2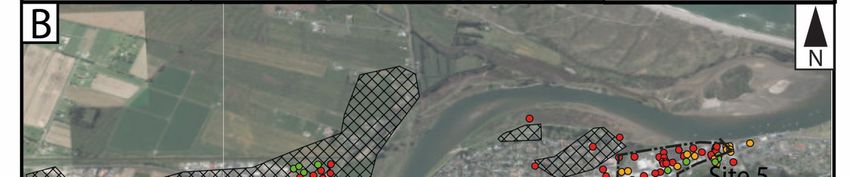
Reports of liquefaction collated by Fairless and Berrill (1984), and mapped extents for events post-1984,
provide a general overview of the distributions of liquefaction manifestations following historical
earthquakes. Online geospatial software provides a platform where previous records of liquefaction can be
presented, thus allowing for quick interrogation of areas that have previously liquefied. As part of this study,
historical records of liquefaction have been collated and mapped into an online ArcGIS-based database that
is publicly available on the QuakeCoRE Wiki Page at https://wiki.canterbury.ac.nz/display/QuakeCore/FP2
%3A+Liquefaction+Impacts+on+Land+and+Infrastructure. The collated observations provide insights into
the settings and soil types that have previously liquefied, while estimation of the shaking intensities of the
causative events enables liquefaction triggering analyses to be calibrated against the actual observations.

2   METHODOLOGY

2.1 Collating historical records
Records of liquefaction were collated from Fairless and Berrill (1984) along with post-event publications and
technical reports following more recent events (i.e. QuakeCoRE-GEER (2017)). Distributions of liquefaction
in Whakatane following the 1987 Edgecumbe earthquake and in Napier following the 1931 Hawkes Bay
earthquake were assessed by Masters students who examined post-event photographs and archives held
within museums (see Mellsop (2017) and Elkortbawi (2017)). Records of liquefaction were subsequently
digitised using simplified geometries into an online GIS-based dataset. Each record was given a separate
datapoint outlining the affected area. Records were subsequently tagged with the reference, earthquake event,
and type of observation (i.e. water ejection or lateral spreading). The inferred severity of liquefaction was
assigned based on the land damage classification of None, Minor, Moderate, Major or Severe, generally
following the definitions outlined by MBIE (2017). The level of confidence in the location and that the
observation relates to liquefaction were additionally documented for each point. Locations where
liquefaction was well documented have low levels of uncertainty whereas reports loosely tied to a person’s
property or region have a higher level of uncertainty.

3   COLLATED LIQUEFACTION OBSERVATIONS
Records of liquefaction currently included in the historical liquefaction database are shown in Figure 2 and
are summarised in Table 1. The database will continue to be updated as new reports of liquefaction are
identified, along with distributions of liquefaction in future events. It is important to note that non-
observations do not necessitate a lack of liquefaction triggering. Liquefaction manifestations may have gone
unreported in areas that were not visited during post-event reconnaissance, particularly for historical events.

                                                       3
Figure 2: Spatial distribution of previous reports of liquefaction that are included in the online database.

Table 1: Summary of events included in the historical liquefaction database

Event                  Report

                      •   Subsidence, sand craters releasing ground water observed along the lower
1848
                          Wairau River in Blenheim.
Marlborough
                      •   Localized liquefaction additionally reported along the west coast of the North
Mw ~7.4-7.5
                          Island as far north as Wanganui however no specific locations are listed.

                      •   Expulsion of sand and water along the lower Wairau River near Blenheim.
1855 Wairarapa        •   Sand cones, fissuring of ground surface, and subsidence reported in downtown
Mw ~8.1                   Wellington, Lower Hutt, Wairarapa, Manawatu Plains, and Ohau. Specific
                          localities not provided.

                      •   Liquefaction and lateral spreading reported at properties in Sewell Street
1901 Cheviot
                          adjacent to the Kaiapoi River in Kaiapoi.
Mw ~7.0
                      •   Localised liquefaction likely across the wider region based on observed damage
                          but specific records not located.

                      •   Liquefaction observed across the wider Westport, Karamea, Inangahua, and
1929 Murchison            Greymouth areas.
M7.3                  •   Evidence of liquefaction and lateral spreading well documented proximal to
                          mouth of the Karamea River and on river flats near Inangahua.

                                                       4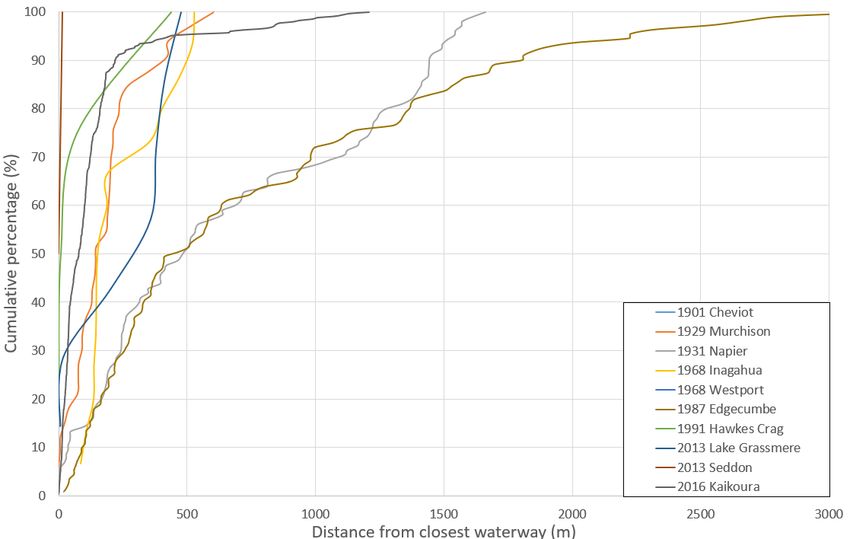
•   Localised liquefaction reported adjacent to waterways and coastal areas within
1931 Napier
                          Napier and towards Hastings.
M ~7.4-7.8
                      •   Cases of no liquefaction inferred from historical photographs in central Napier.

                      •   Liquefaction reported near rivers and estuarine settings near river mouths in the
1968 Inangahua            Inangahua, Westport, and Karamea areas; minor liquefaction reported in
Mw 7.1                    Greymouth.
                      •   Many of the sites that liquefied in the 1929 Murchison earthquake re-liquefied.

                      •   Liquefaction mapped in recent fluvial deposits on the Rangitaiki Plains near the
1987
                          Rangitaiki and Tarawera Rivers.
Edgecumbe
                      •    Liquefaction and lateral spreading observed in recent fluvial deposits adjacent
Mw 6.5
                          to the Whakatane River in Whakatane.

                      •   Widespread severe liquefaction and lateral spreading observed in eastern
2010 – 2011
                          Christchurch. Worst hit areas (red zone) primarily adjacent to meandering rivers
Canterbury
                          and the Avon-Heathcote Estuary to the east of the central city. Distributions of
Earthquake
                          liquefaction proximal to rivers primarily correspond with areas of point-bar and
Sequence
                          paleo-channel deposition.

2013 Lake              • Localised liquefaction ejecta and lateral spreading mapped in recent fluvial and
Grassmere                estuarine deposits adjacent to the Opawa River and Big Lagoon.
Mw 6.6                 • Minor liquefaction in reclamation fill near Wellington Harbour

                      •  Localized liquefaction mapped on alluvial plains proximal to rivers in the wider
                         Waiau, Cheviot, Kaikoura, Ward regions.
                      •  Localised  severe liquefaction observed in reclamation fill near Wellington
2016 Kaikoura
                         waterfront.
Mw 7.8
                       • Localised severe liquefaction and lateral spreading observed proximal to rivers
                         to the east in Blenheim. Distribution confined to relatively low-elevation areas
                         primarily corresponding with point-bar and paleo-channel deposits.

4   GEOMORPHIC SETTINGS OF LIQUEFACTION OBSERVATIONS
The spatial distributions of liquefaction reported following recent and historical events indicates that
liquefaction has primarily occurred proximal to waterways in areas containing recent (Quaternary) fluvial
deposits, while localised reports have been made in areas underlain by recent estuarine deposits. The
geospatial dataset enables interrogation of commonalities in the spatial distributions, extents, and severities
of liquefaction for different events. Initial comparison of the spatial location of the recorded observations
with the ‘NZ River Centrelines’ dataset available from LINZ indicates that 80 percent of the reports are
within 500 m of waterways (Figure 3).

                                                        5
Figure 3: Cumulative percentage plot showing the distance of each reported liquefaction observation from
the most proximal waterway for each historical earthquake included in the database.
Historical cases of liquefaction may also be paired with geotechnical data from the New Zealand
Geotechnical Database (NZGD) to examine subsurface soil properties in areas of liquefaction and no
liquefaction. It is important to note that areas where no liquefaction has been reported should not be treated
as not liquefying unless this has been confirmed by a post-event site visit.
The mapped distribution of liquefaction in Blenheim following the 2016 Kaikoura earthquake indicated that
liquefaction was confined to low elevation areas proximal to rivers and streams to the north and east of the
township (Figure 4; see Bastin et al., 2018). Collated CPT from sites of known liquefaction indicate that the
subsurface soils generally comprise a silt-to-clay cap underlain by thick layers of low relative density sands
to silts (Figure 4). CPT traces in areas of no observed liquefaction generally indicate that the underlying soils
comprise higher density deposits sands and silts. The qc and Ic traces of these deposits additionally show
higher variability, possibly due to inter-layering of soil types (Figure 4). Comparisons from Blenheim
suggest that liquefaction hazard assessments should include consideration of depositional setting, in addition
to the depth to groundwater and proximity to waterways. Recorded PGA during the Kaikoura earthquake was
~0.22 g; it is likely that liquefaction would be more widespread under a higher intensity event.
6Figure 4: Mapped distribution of liquefaction and no liquefaction sites in Blenheim following the 2016
Kaikoura earthquake shown with collated CPT.
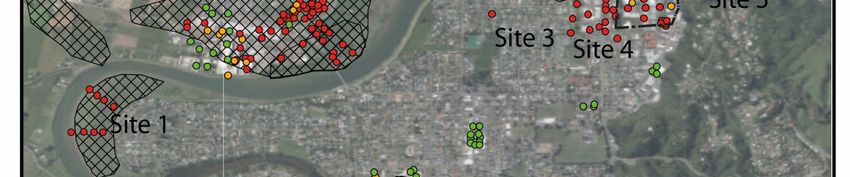
5 CASE STUDY COMPARISON OF OBSERVED AND PREDICTED LIQUEFACTION
Collated reports of liquefaction in Whakatane following the 1987 Edgecumbe earthquake show that localized
liquefaction occurred proximal to the Whakatane River under an estimated PGA of ~0.15 g (Figure 5;
Christensen, 1995). Recent liquefaction hazard maps developed for Whakatane using current state of practice
methodologies suggest that the liquefaction hazard is high for much of the township. Comparison of the
observed extent of liquefaction with that predicted from simplified analysis of existing geotechnical datasets
using back-calculated PGA and depth to ground water models shows areas of inconsistent prediction (Figure
5; see Bastin et al., 2020 for discussion on analysis methodologies).
7Figure 5: Comparison of observed and predicted extents of liquefaction in Whakatane for the 1987
Edgecumbe earthquake (modified from Bastin et al. 2020).
Geomorphic mapping indicates that the observed distribution of liquefaction corresponds with areas
underlain by fluvial deposits comprising point-bar and paleo-channel deposits. Areas of inconsistent
prediction are generally distal to the Whakatane River (Sites 4-5 in Figure 5). Potential reasoning for the
variability in observed and predicted liquefaction includes differences in the age of the deposits, thin-scale
inter-layering within the distal flood-plain, and/or the presence of pumice (see Bastin et al., 2020 for detailed
discussion). The results highlight the importance of incorporating historical observations and geomorphic
mapping as a form of ground truthing the assignment of liquefaction hazards.
6 POTENTIAL INCORPORATION IN LIQUEFACTION HAZARD MAPPING
The historical liquefaction database identifies areas that have historically exhibited surface manifestations of
liquefaction for a given earthquake event and PGA. Areas where the earthquake-induced damage was well
reported and/or photographed, and in which no liquefaction was reported, may be inferred as not exhibiting
surface manifestations of liquefaction for the given earthquake PGA. Actual observations of liquefaction
may subsequently be used to calibrate predicted liquefaction severities if simplified liquefaction triggering
analyses are conducted using estimated shaking intensities of the causative earthquake event. The collated
dataset therefore provides a valuable tool kit to verify and/or cross-examine the interpreted liquefaction
hazard from simplified analyses.
The collated reports indicate that liquefaction has primarily been observed in relatively low elevation areas
proximal to waterways that are underlain by recent fluvial deposits. The consistency in the geomorphic
settings of the reported observations suggests that these settings contain deposits with low resistance to
liquefaction-triggering. Geomorphic mapping may therefore be used as a ‘first-pass’ filter to identify areas
likely to contain deposits susceptible to liquefaction as part of the Level A (Desktop) and Level B
(Calibrated Desktop) studies. It is recommended that this be done in conjunction with published geology and
consultation with shallow groundwater records.
87 CONCLUSIONS
Historical records indicate that consequential liquefaction has occurred during upwards of 11 earthquakes in
New Zealand since European settlement and prior to the 2010 Darfield earthquake. The historical records have
been collated and geospatially plotted into an online, open-access ArcGIS database.
The collated historical records of liquefaction provide an independent methodology by which liquefaction
hazard assessments may be ‘cross-checked’ and/or supplemented in the absence of geotechnical investigations.
It is anticipated that the database will assist Level ‘A’ and ‘B’ liquefaction hazard assessments across the
country.
The spatial distributions of liquefaction indicate that liquefaction primarily occurs in low elevation areas
proximal to waterways. Geomorphic mapping indicates that liquefaction manifestations in Whakatane
following the 1987 Edgecumbe earthquake and in Blenheim following the 2016 Kaikoura earthquake occurred
within recent point-bar and paleo-channel deposits. Subsurface deposits in these areas generally contain thick
layers of low relative density sands to silts.
Predicted liquefaction hazards may be calibrated using actual observations of liquefaction recorded for a
given earthquake event and associated PGA. Comparisons of observed and predicted liquefaction in parts of
New Zealand have found that the simplified liquefaction triggering analyses over-predict liquefaction
hazards in certain soil types, including inter-layered soils and those containing pumice. The collated
historical liquefaction dataset subsequently provides a valuable tool kit that may be used to verify and/or
cross-examine the liquefaction hazard interpreted from simplified analyses.
8 ACKNOWLEDGEMENTS
This project was supported by QuakeCoRE, a New Zealand Tertiary Education Commission-funded Centre.
This is QuakeCoRE publication number 0582.
9 REFERENCES
Bastin, S., Ogden, M., Wotherspoon, L., van Ballegooy, S., Green, R.A., Stringer, M., 2018.
Geomorphological Influences on the Distribution of Liquefaction in the Wairau Plains, New Zealand,
Following the 2016 Kaikōura Earthquake, Bulletin of the Seismological Society of America, 108(3B): 1683–
1694.
Bastin, S., van Ballegooy, S., Mellsop, N., Wotherspoon, L., 2020. Liquefaction case histories from the 1987
Edgecumbe earthquake, New Zealand – Insights from an extensive CPT dataset and paleo-liquefaction
trenching, Engineering Geology, 241: 105404.
Fairless, G.J., and Berrill, J.B., 1984. Liquefaction during Historic Earthquakes in New Zealand, Bulletin of
the New Zealand National Society for Earthquake Engineering, 17(4):280-291.
Christensen, S.A. (1995) Liquefaction of cohesionless soils in the March 2, 1987 Edgecumbe Earthquake,
Bay of Plenty, New Zealand, and other earthquakes, Masters Thesis, University of Canterbury, Christchurch,
New Zealand.
Elkortbawi, M.R., 2017. Insights into the Liquefaction Hazards in Napier and Hastings Based on the
Assessment of Data from the 1931 Hawke's Bay, New Zealand, Earthquake, Master of Engineering Thesis,
Virginia Tech, Virginia, United States of America.
QuakeCoRE-GEER, 2017. Geotechnical Reconnaissance of the 2016 M7.8 Kaikoura, New Zealand
Earthquake, Joint report between QuakeCoRE and GEER, New Zealand.
9NZGS, 2016. Earthquake Geotechnical Engineering Module 3 – Liquefaction Hazards, New Zealand
Geotechnical Society, New Zealand.
MBIE, 2017. Planning and engineering guidance for potentially liquefaction-prone land Resource
Management Act and Building Act aspects, Revision 0.1, Ministry of Business, Innovation and Employment,
Wellington, New Zealand.
Mellsop, N., 2017. Liquefaction Case Histories from the 1987 Edgecumbe Earthquake – Insights from an
Extensive CPT Dataset, Direct Push Cross Hole Shear and Compression Wave Velocity (VsVp) Testing and
Paleo- Liquefaction Trenching, Master of Engineering Thesis, University of Auckland, New Zealand.
Ogden, M. L., 2018. Assessment of Liquefaction from New Zealand Case Histories: With Insights from
Liquefaction-induced Land Damage, Over the Lower Wairau Plains, Caused by the 2016 Kaikoura
Earthquake. Master of Engineering Thesis, University of Auckland, New Zealand.
10You can also read