Development of a Waikato Basin T0 and depth model by the H/V spectral ratio method - NZSEE
←
→
Page content transcription
If your browser does not render page correctly, please read the page content below
Development of a Waikato Basin T0 and
depth model by the H/V spectral ratio
method
S. Jeong
School of Engineering, University of Waikato, Hamilton.

L.M. Wotherspoon
Department of Civil and Environmental Engineering, University of Auckland, Auckland.

ABSTRACT
This paper presents the development of a preliminary model of the fundamental site period (T0)
across the Waikato Basin using the Horizontal-to-vertical (H/V) spectral ratio technique. We
measured the ambient vibration of the ground at over 100 sites across the Waikato Basin, and
produced a T0 map by spatially interpolating T0 obtained by the H/V spectral ratio technique. The
measured site periods were over 5 seconds near Te Rapa and Gordonton, suggesting a deep
sedimentary basin. This finding is also consistent with previous studies. We also found that most
parts of the Waikato Basin, except very near the basin edge, have fundamental site periods longer
than 0.6s, which means they should be categorised as site class D at a minimum, according to
NZS1170.5: 2004. More site-specific assessments of shear wave velocity profiles will be able to
identify site class E locations. Using the depths to the greywacke basement obtained from the
existing petroleum logs in the region, we established a fundamental site frequency-depth
correlation.

1 INTRODUCTION
It is well-known that the dynamic response of a soft sedimentary basin amplifies ground motions and
prolongs the duration of shaking (Borcherdt, 1970; Kramer, 1996). Therefore, to accurately characterise
seismic hazards, we have to understand the dynamic characteristics of sedimentary basins in regions of
interest. For example, the fundamental site period (T0) is a key parameter used to define site subsoil class
within the New Zealand seismic design standard (NZS 1170.5:2004 Structural design actions - Part 5:
Earthquake actions - New Zealand). Vs30, the weighted harmonic mean shear wave velocity of the upper 30
metres, is another key parameter to quantify the seismic hazard at a given site (Bradley, 2013; Campbell and

 Paper 301
2019 Pacific Conference on Earthquake Engineering and Annual NZSEE Conference 1
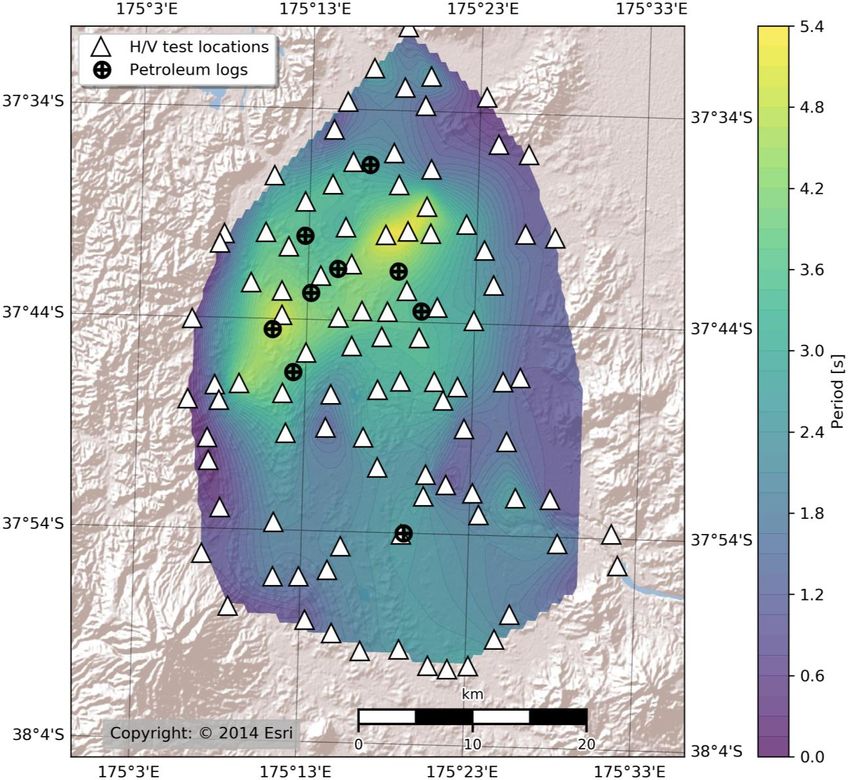
Bozorgnia, 2014). In order to undertake site-specific ground motion analysis or physics-based ground motion
simulation, the seismic velocity profile must be fully characterised (Eberhart-Phillips et al., 2010; Graves
and Pitarka, 2010).
Despite its relatively low regional seismicity, the impact of a future large earthquake in the Waikato region
could be significant, considering the region has a population of 460,000, the fourth largest regional economy
in New Zealand (Stats NZ, 2017), and a number of critical infrastructure systems, such as the Waikato
expressway, high-pressure gas pipes, and high-voltage electricity transmission lines (New Zealand Lifelines
Council, 2017). The surficial geology of Waikato Basin is often characterised by soft, challenging soils,
which are known to cause adverse effects in the case of larger magnitude earthquakes (Kramer, 1996;
Edbrooke, 2005) but current knowledge on the dynamic response characteristics of Waikato soils is quite
limited.
We are currently carrying out a series of geophysical tests to improve our understanding of the dynamic
properties of the Waikato Basin and the soils within, as part of the ongoing nation-wide collaborative effort
to quantify the site dynamic characteristics of New Zealand basins and urban areas. In this paper, we present
the preliminary model for the variation in fundamental site period and depth across the Waikato Basin,
developed using the horizontal-to-vertical (H/V) spectral ratio method (Nakamura, 1989) and measured
ambient vibrations at the ground surface.

2 GEOLOGIC SETTING
In general, the geology of the Waikato Basin is dominated by thick Quaternary sediments and volcanic ash
(Tauranga Group), overlying Oligocene-Miocene sedimentary rock (Waitemata and Te Kuiti Group) and
greywacke basement. In the 1960’s and 1970’s, nine petroleum exploration boreholes were drilled in the
Waikato Basin, which are the main source of information about the stratigraphy of the basin (Edbrooke et al.,
2009). Figure 1 shows the locations of these boreholes, along with the locations of the H/V test sites. The
stratigraphy found in the petroleum boreholes suggests that the Te Kuiti and Waitemata Group rocks are
thickest in the west and thin eastwards, which is primarily attributed to the pre-Tauranga Group erosion.
Edbrooke et al. (2009) summarised the stratigraphy found in the petroleum boreholes, which is reproduced in
Table 1.
Table 1: Thickness and depths from the ground surface to the base of stratigraphic groups found in Waikato
Basin petroleum boreholes, modified from Edbrooke et al., (2009). NP stands for ‘not present’.

Name Tauranga Group Waitemata Group Te Kuiti Group Total depth to HTG/
 Thickness, HTG (m) Thickness, HWG (m) Thickness, HTKG (m) basement, HT (m) HT

Puketaha-1 439 NP NP 439 1.0

Te Rapa-1 610 829 210 1649 0.37

Waikato-1 485 510 30 1025 0.47

Waikato-2 453 437 125 1015 0.45

Waikato-3 200 104 NP 304 0.66

Waikato-4 518 NP 42 560 0.93

Waikato-5 265 512 228 1005 0.26

Paper 301 – Development of a Waikato Basin T0 and depth model by the H/V spectral ratio method
2019 Pacific Conference on Earthquake Engineering and Annual NZSEE Conference 2

The basin is bound by the Waipa and Taupiri faults to the West. Previous studies, including the gravity
anomaly data and exploration boreholes, suggested the presence of a deep sedimentary basin at the
downthrown side of the faults, northwest of Hamilton along a line that connects Whatawhata and Gordonton
(Edbrooke et al., 2009). The borehole logs showed that the basement rock is at least 1.6km deep near Te
Rapa.

Figure 1: Shaded relief map showing the extent of the Waikato basin. Sun cross symbols show the locations
of the petroleum exploration boreholes and the H/V test sites are marked with triangles.

3 METHODOLOGY

1.1 Horizontal-to-vertical (H/V) spectral ratio
The peak frequency from the H/V spectral ratios, the ratios of the horizontal-to-vertical Fourier amplitude
spectra of ambient seismic noise, is known to be generally consistent with the fundamental frequency (f0) of
the 1D transfer function of the site (Nakamura, 1989; Sánchez-Sesma et al., 2011).
We collected the ambient vibration records using 3-component broadband seismometers (Nanometrics
Trillium Compacts, 20 second period). Each seismometer was placed in a hole approximately 10-15
centimetres deep and oriented towards the magnetic north. Soil was then tightly compacted around the
seismometer to ensure a good coupling of the seismometer with the surrounding ground. The ambient
vibration testing took place between November 2018 and February 2019. We deployed the seismometers at
over 100 sites across the Waikato basin as shown in Figure 1. At each site, we recorded the ambient vibration
for approximately 60 minutes. A sampling rate of 100Hz was used in all cases.

Paper 301 – Development of a Waikato Basin T0 and depth model by the H/V spectral ratio method
2019 Pacific Conference on Earthquake Engineering and Annual NZSEE Conference 3
The ambient vibration data were processed using the software Geopsy (www.geopsy.org). Recorded motions
were divided into multiple time windows of 180 seconds with a 5% cosine taper. Time windows including
large transient spikes and time windows producing obviously erroneous spectral ratios were rejected in the
processing stage. The geometric mean horizontal Fourier amplitude spectra were used to compute the H/V
spectral ratios, and each amplitude spectrum was smoothed by a Konno-Ohmachi window (Konno and
Ohmachi, 1998) with a smoothing constant b = 40.

2 SITE PERIODS IN THE WAIKATO BASIN
Figure 2 shows typical H/V spectral ratios from sites within the Waikato Basin. The majority of sites show a
very clear fundamental mode peak with a large amplitude, indicative of a large impedance contrast. Also, in
most cases, the lowest frequency (longest period) peak in the H/V ratio showed the largest amplitude. The
peaks of the lowest frequency in the H/V spectral ratios likely correspond to, in most cases, fundamental
mode vibration of the entire soil profile down to the basement rock (greywacke), and this is the focus of our
study in this paper.
It is possible that, at some sites, a shallower impedance contrast dominates the lowest frequency peak
(Toshinawa et al., 1997; Wotherspoon et al., 2015). We plan to characterise the Vs of soils and sedimentary
rocks of the Waikato Basin using the multichannel analyses of surface waves (MASW) and the microtremor
array method (MAM), which is expected to help us better interpret the H/V spectral ratios of the Waikato
Basin in the future. H/V spectral ratios at some sites can also feature multiple H/V peaks, and there are a few
possible situations in the Waikato area that could cause such multiple peaks in the H/V ratio. This includes
the impedance contrast between the Tauranga Group and the Waitemata Group or the impedance contrast
between the Pirongia volcanic formation and the younger quaternary sediments. Figure 2 shows examples of
second peaks at higher frequencies with less pronounced amplitudes, which could be due to the response of
shallower soil layers. Towards the southern end of the basin near Te Awamutu, a few sites even showed
three peaks in their H/V ratios, which is indicative of a complex layering of sedimentary soils and the
volcanic formations.

Figure 2: Examples of H/V spectral ratios obtained in the Waikato Basin. Nearly all sites show a clear
fundamental mode of vibration with large amplitude ratios.

Paper 301 – Development of a Waikato Basin T0 and depth model by the H/V spectral ratio method
2019 Pacific Conference on Earthquake Engineering and Annual NZSEE Conference 4
Figure 3: Interpolated map of T0 across the Waikato basin. Also shown are the H/V test sites and the
locations of petroleum borehole logs.

To create a map of the fundamental period across the Waikato Basin, we spatially interpolated the
fundamental period of tested sites using the Natural Neighbor algorithm (Sibson, 1981). Figure 3 shows the
fundamental site period map of the Waikato Basin, along with locations of the H/V test sites. Also shown in
the same figure are the locations of existing petroleum boreholes at which the depths to the basement rock
are known. Figure 3 shows that the fundamental site period can be over five seconds in some locations, and
the longest site periods are observed from the west through to the north of Hamilton, almost along a linear
trend that goes through Whatawhata, Te Rapa, Rototuna, and Gordonton; we also found that the site periods
change rapidly near the areas of longest site periods. The shape of the contour of T0 is consistent with the
gravity anomaly of the region (Frogtech, 2011), and the borehole log Te Rapa-1 showed that the greywacke
basement was encountered approximately at 1.6km. Figure 3 suggests that most places within the Waikato
basin should be categorised as the site class D, according to NZS1170.5: 2004, except where it’s very close
to the basin edge.

Paper 301 – Development of a Waikato Basin T0 and depth model by the H/V spectral ratio method
2019 Pacific Conference on Earthquake Engineering and Annual NZSEE Conference 5
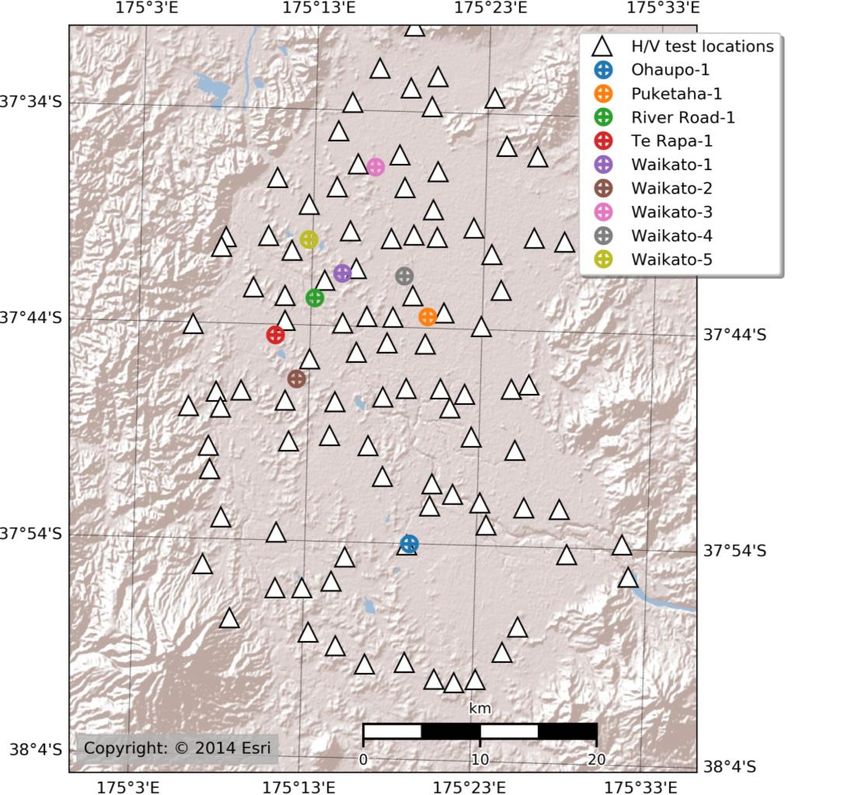
3 FUNDAMENTAL SITE FREQUENCY-BASIN DEPTH CORRELATION
Previous studies showed that the relationship between fundamental frequency (f0) of a soil layer and its
thickness (H) can be defined by a power-law equation (Ibs-von Seht and Wohlenberg, 1999; Parolai et al.,
2002):
 = 0 (1)

where a and b are coefficients that can be defined for different deposits and locations. Using the depth to the
basement logged at the petroleum boreholes and the interpolated site frequency, we carried out a regression
analysis to establish a correlation between the basin depth, H, and the fundamental site frequency, f0. Figure
4 shows the observed depth-interpolated f0 pairs, along with a power law model obtained by the regression
analysis represented by:
 = 101.6 0−1.565 (2)

We also compared our data with two previous studies (Ibs-von Seht and Wohlenberg, 1999; Parolai et al.,
2002). We found that both of these models fit our data reasonably well, but the Parolai et al. (2002) model
was much closer to the model we obtained. Large uncertainties should be expected from a simple model of
this form, as the model simply ignores the local variability of the shear wave velocity and implicitly assumes
that the Vs of the soil within the basin can be defined by a unique function.
In Figure 4, equation (2) clearly over-predicted the depths at boreholes Puketaha-1, Waikato-3, and Waikato-
4. The ratio HTG/HT in Table 1 suggests that the Tauranga Group soils dominate the geology of these sites,
which means that the actual average Vs are likely lower at these sites compared with other locations. In other
sites where the model under-predicted the depths, the thickness of Oligocene-Miocene sedimentary rocks is
considerable. Such variability in the basin geology will likely cause the variability of Vs, which contributes to
the prediction uncertainty.
We plan to improve our model in the future to account for the spatial variability of the Vs. Nevertheless, we
found that the predictions are generally within a range of 0.7 to 1.5 times the observed depths. However,
because all the petroleum boreholes showed the basement depths greater than 250m, the current model is not
well constrained near the edge of the basin where fundamental frequencies are greater than 1Hz (or periods
shorter than 1s).

Figure 4: H-f0 model developed using the measured f0 and H.

Paper 301 – Development of a Waikato Basin T0 and depth model by the H/V spectral ratio method
2019 Pacific Conference on Earthquake Engineering and Annual NZSEE Conference 6
4 CONCLUSIONS
We developed a fundamental site period map of the Waikato basin, which was derived from ambient-
vibration H/V spectral ratios obtained from over 100 sites across the Waikato basin.
One of the petroleum logs (Te Rapa-1) showed that the depth to basement is nearly 1.6km near Te Rapa. The
measured site periods were over 5 seconds near Te Rapa and Gordonton. It is expected that those are the
locations where the basement rock is the deepest; we also found that the site periods change rapidly near the
areas of longest site periods.
We found that most of the places in the Waikato Basin, except where it’s very near the basin edge, have
fundamental site periods longer than 0.6s, which means they should be categorised as the site class D at a
minimum, according to the NZS1170.5: 2004. More site-specific assessments of shear wave velocity profiles
will be able to identify site class E locations.
Using the measured site frequencies and the depths to the basement observed in previous studies, we
developed an empirical model that estimates the bedrock depth using the obtained fundamental site
frequency. Uncertainty is expected as this model does not account for the spatial variability of soil velocities,
and the predictions are generally within a range of 0.7 to 1.5 times the observed depths. However, it should
be noted that the current model is not well constrained at locations where depths are less than 250m.

5 ACKNOWLEDGEMENTS
This study is supported by the University of Waikato and QuakeCoRE, a New Zealand Tertiary Education
Commission-funded Centre. Mr. Ethan Flintoft collected the ambient vibration data. This is QuakeCoRE
publication number 0417.

REFERENCES
Borcherdt, R.D. 1970. Effects of Local Geology on Ground Motion Near San Francisco bay, Bulletin of the
 Seismological Society of America, Vol 60(1) 29–61.
Bradley, B.A. 2013. A New Zealand-specific pseudospectral acceleration ground-motion prediction equation for active
 shallow crustal earthquakes based on foreign models, Bulletin of the Seismological Society of America, Vol 103(3)
 1801–1822. doi: 10.1785/0120120021.
Campbell, K.W. & Bozorgnia, Y. 2014. NGA-West2 ground motion model for the average horizontal components of
 PGA, PGV, and 5% damped linear acceleration response spectra, Earthquake Spectra, Vol 30(3) 1087–1114. doi:
 10.1193/062913EQS175M.
Eberhart-Phillips, D. et al. 2010. Establishing a Versatile 3-D Seismic Velocity Model for New Zealand, Seismological
 Research Letters, Vol 81(6) 992–1000. doi: 10.1785/gssrl.81.6.992.
Edbrooke, S., Ricketts, B. & Leonard, G. 2009. Opportunities for underground geological storage of CO2 in New
 Zealand - Report CCS -08/2 - The onshore Waikato Region.
Edbrooke, S.W. 2005. Geology of the Waikato area. Institute of Geological & Nuclear Sciences.
Frogtech. 2011. Waikato Structural GIS & SEEBASE Project.
Graves, R.W. & Pitarka, A. 2010. Broadband ground-motion simulation using a hybrid approach, Bulletin of the
 Seismological Society of America, Vol 100(5A) 2095–2123. doi: 10.1785/0120100057.
Ibs-von Seht, M. & Wohlenberg, J. 1999. Microtremor Measurements Used to Map Thickness of Soft Sediments,
 Bulletin of the Seismological Society of America, Vol 89(1) 250–259.
Konno, K. & Ohmachi, T. 1998. Ground-motion characteristics estimated from spectral ratio between horizontal and
 vertical components of microtremor, Bulletin of the Seismological Society of America, Vol 88(1) 228-241,
 Seismological Society of America. Available at: http://bssa.geoscienceworld.org/content/88/1/228.abstract
 (Accessed: 27 March 2016).

Paper 301 – Development of a Waikato Basin T0 and depth model by the H/V spectral ratio method
2019 Pacific Conference on Earthquake Engineering and Annual NZSEE Conference 7
Kramer, S.L. 1996. Geotechnical Earthquake Engineering, Prentice-Hall, Inc. doi: 10.1007/978-3-540-35783-4.
Nakamura, Y. 1989. A method for dynamic characteristics estimation of subsurface using microtremor on the ground
 surface, Quarterly Report of the Railway Technical Reasearch Institute.
New Zealand Lifelines Council. 2017. New Zealand Infrastructure Vulnerability Assessment : Stage 1.
New Zealand Standards. 2004. NZS 1170.5:2004 Structural design actions - Part 5: Earthquake actions - New Zealand.
Parolai, S., Bormann, P. & Milkereit, C. 2002. New relationships between Vs, thickness of sediments, and resonance
 frequency calculated by the H/V ratio of seismic noise for the cologne area (Germany), Bulletin of the Seismological
 Society of America, Vol 92(6) 2521–2527. doi: 10.1785/0120010248.
Sánchez-Sesma, F.J. et al. 2011. A theory for microtremor H/V spectral ratio: Application for a layered medium,
 Geophysical Journal International, Vol 186(1) 221–225. doi: 10.1111/j.1365-246X.2011.05064.x.
Sibson, R. 1981. A Brief Description of Natural Neighbor Interpolation, Interpolating multivariate data. New York:
 John Wiley & Sons, pp. 21–36.
Stats NZ. 2017. New Zealand’s regional economies 2017 | Stats NZ. Available at:
 https://www.stats.govt.nz/infographics/new-zealands-regional-economies-2017 (Accessed: 16 October 2018).
Toshinawa, T., Taber, J.J. & Berrill, J.B. 1997. Distribution of ground-motion intensity inferred from questionnaire
 survey, earthquake recordings, and microtremor measurements - A case study in Christchurch, New Zealand, during
 the 1994 Arthurs Pass Earthquake, Bulletin of the Seismological Society of America, Vol 87(2) 356–369.
Wotherspoon, L.M. et al. 2015. Development of deep Vs profiles and site periods for the Canterbury region, New
 Zealand Society for Earthquake Engineering Conference.

Paper 301 – Development of a Waikato Basin T0 and depth model by the H/V spectral ratio method
2019 Pacific Conference on Earthquake Engineering and Annual NZSEE Conference 8
You can also read