Air Quality Prediction Modeling for Badarpur to NHPC Chowk Faridabad, Delhi-NCR, India using Caline 4 - irjet
←
→
Page content transcription
If your browser does not render page correctly, please read the page content below
International Research Journal of Engineering and Technology (IRJET)                                          e-ISSN: 2395-0056
         Volume: 07 Issue: 10 | Oct 2020                   www.irjet.net                                              p-ISSN: 2395-0072

         Air Quality Prediction Modeling for Badarpur to NHPC Chowk
                   Faridabad, Delhi-NCR, India using Caline 4
                 Pintu Kumar1, Syed Khursheed Ahmad2, Saurabh Kumar Garg3, Shivani3
                                                            1M.Tech.   Student
                                                          2Professor    and HoD
                                                             3M.Tech. Student
                              1-3Dept. of Civil Engineering, Al-Falah University, Dhauj, Faridabad

---------------------------------------------------------------------***----------------------------------------------------------------------
Abstract - The primary cause of urban air pollution is                   pedestrians. On urban roadways, where ventilation is
traffic emissions. While new technologies to control the level of        inadequate, the situation continues to deteriorate.
pollution are being implemented, the number of vehicles                     The CPCB has estimated that the share of automotive
without changing road conditions is rising, especially on                emissions in air pollution of Delhi has risen to 72 percent
congested urban roads, causing high-level emissions in the               over the years.
vicinity of roadways. The dispersion modelling exercise will
                                                                             The primary source of urban air pollution is traffic
provide optimal orientation of the intersection to minimise the
                                                                         emissions. While new technologies to control the level of
trapping of contaminants, which can be applied at the
                                                                         pollution are being implemented, the number of vehicles
planning stage, taking into account the gravity of the                   without changing road conditions, especially on congested
situation. The goal of this research is to conduct a dispersion          urban roads is causing high-level emissions in the vicinity of
modelling study with the CALINE 4 model to determine the                 roadways. The dispersion modelling exercise will provide
levels of air pollution from road transport sources and to               optimal orientation of the intersection to minimise the
predict the distance & dispersion pattern and their impacts.             trapping of contaminants, which can be applied at the
For the present study, Badarpur to NHPC Chowk Faridabad                  planning stage, taking into account the gravity of the
was selected as the study location. The amount of traffic in this        situation. In the context of the location of the study, the scope
road consists of vehicles, two wheelers, three wheelers, Car,            of the present study is to carry out air dispersion modelling
MAV, LCV and buses. Cars make up roughly 46 percent and                  with the Caline 4 model.
motorized two wheelers makes 41 percent of the total traffic
                                                                             Analysis of the viability and applicability of the dispersion
on the study road. The minimum percentage of MAV due to no               model has always been a matter of high interest among
entry of MAV vehicle in Delhi due to no entry hours. By using            scientists. Many scholars around the world have performed
the emission factors and corresponding deterioration factors,            numerous studies on the viability of a specific model of
the weighted emission factor was determined. Micro-                      dispersion. Some of the studies went one step forward and
meteorology data was collected from wunderground website                 developed their own mathematical models for pollutant
at Indira Gandhi International Airport Station Delhi. These              dispersion assessment. Karim and Matsui (1998) and Karim
meteorological data as needed for model application of Caline            et al, in a report. (1998) developed a computer model to
4. The study and monitoring of Particulate Matter 10 (PM10),             classify street canyons and vehicle wake effects on the
Sulphur Di-oxide (SO2), Nitrogen dioxides (NO2) and Carbon               transport of air pollution from urban roads to their micro
Monoxide (CO) was carried out at three (3) monitoring                    environments consisting of wind distributions, emission
stations located very close to the study road.                           dispersion and modified Gaussian equation. (1998)
                                                                         developed a computer model to classify street canyons and
Key Words: Urban Roadway, Carbon Monoxide, Air                           vehicle wake effects on the transport of air pollution from
Quality Monitoring, Air Quality Prediction Modeling,                     urban roads to their micro environments consisting of wind
CALINE 4                                                                 distributions, emission dispersion and modified Gaussian
                                                                         equation.
1. INTRODUCTION                                                             In his research, Baijayanta Kumar Majumdar (2009)
                                                                         presents that CALINE 4 offers many advantages over other
   Growing demand of transport due to economic growth                    models and is chosen as the basis model for the creation of a
has caused a boom in Delhi (Capital City of India) in the                modified line source model for an area. Niraj Sharma (2013 )
number and use of motor vehicles. In urban environments,                 conducted the performance assessment research of the
pollutants such as respirable particulate matter (RPM),                  CALINE 4 model to predict concentrations of carbon
especially PM2.5, nitrogen dioxide (NO2), carbon monoxide                monoxide (CO) along an urban highway corridor passing
(CO) and hydrocarbons (HC), are directly emitted by vehicles.            through Together with Rajni Dhyani (2013), carbon
Urban inhabitants are the most affected group, especially the            monoxide (CO) concentrations along an urban highway
population residing in the vicinity of urban roads as well as            corridor passing through the city of Delhi also compared
                                                                         CALINE 4 model predictions between flat and hilly terrain

© 2020, IRJET          |     Impact Factor value: 7.529              |     ISO 9001:2008 Certified Journal                 |   Page 1457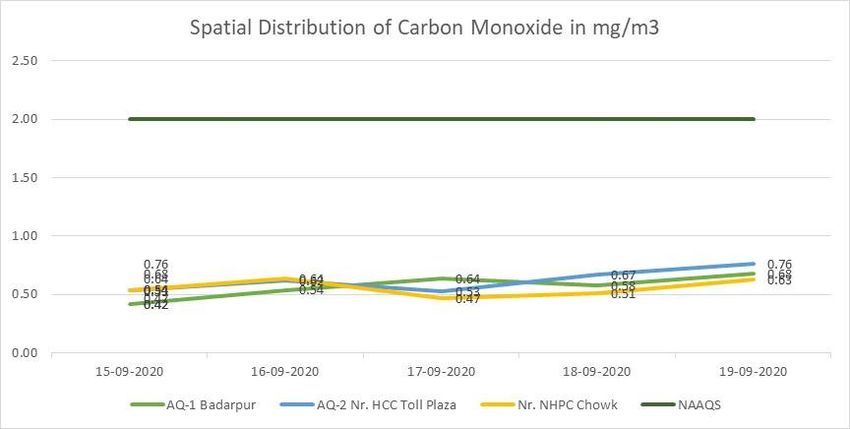
International Research Journal of Engineering and Technology (IRJET) e-ISSN: 2395-0056
Volume: 07 Issue: 10 | Oct 2020 www.irjet.net p-ISSN: 2395-0072
along two Solan District road corridors in the state of 24915 and 13497 to 23957. The composition of traffic
Himachal Pradesh (India). Studies show that the Caline 4 volume across different days during the monitoring period is
model remains unanswerable for complex terrain algorithms presented in figure below.
such as a hilly stretch, and the concentration is also expected
by the model.
a: Traffic Composition on 15-09-2020
In this study, Chadetrik Rout (2015) found that the
predicted results of Caline 4 are satisfactorily in agreement
with the monitored value.
2. MATERIALS AND METHOD
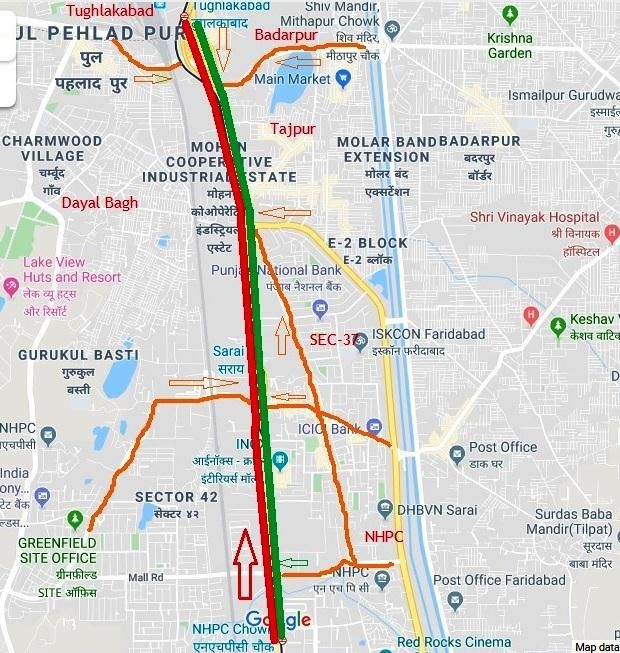
For the current report, Badarpur to NHPC Chowk
Faridabad was selected as the research location. The road
receives traffic from Prahladpur, Meethapur (Delhi), Gurukul
basti, Sarai road, Sector-37, and NHPC Sectror-33
(Faridabad). The present road is configured for 6 lanes and
provided for signal-free traffic by flyover & service lane. The b: Traffic Composition on 16-09-2020
Land use of the study road is surrounded by mix of shopping
complex, restaurants, petrol pumps and Multiplex. The study
location's average elevation is 210 m above MSL.
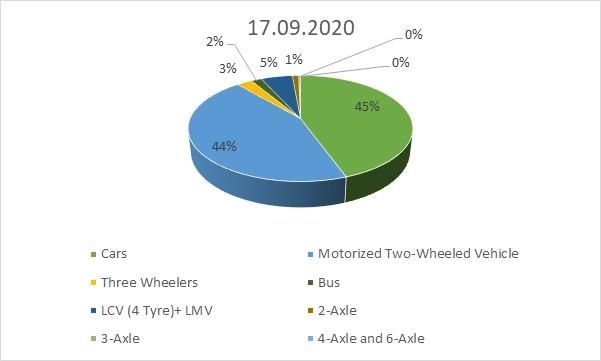
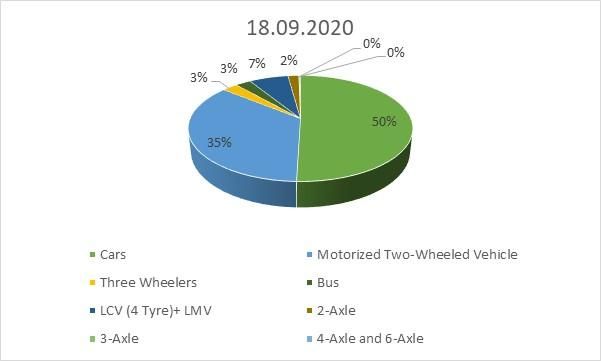
c: Traffic Composition on 17-09-2020
Fig -1: Description of Study Area d: Traffic Composition on 18-09-2020
The monitoring and analysis of Particulate Matter 10
(PM10), Sulphur Di-oxide (SO2), Nitrogen Oxides (NOX) and
Carbon Monoxide (CO) was carried out at three (3)
monitoring stations located very close to the study road. 8
hourly monitoring, covering the time from 9 am to 5 pm, was
carried out. Starting from Tuesday, i.e. 15-09-2020 to
Saturday, i.e. 19-09-2020, air quality monitoring was carried
out continuously for 5 days.
The amount of traffic in this road consists of vehicles, two
wheelers, three wheelers, Car, MAV, LCV and buses. Cars
make up roughly 46 percent and motorized two wheelers e: Traffic Composition on 19-09-2020
makes 41 percent of the total traffic on the study road. The
minimum percentage of MAV due to no entry of commercial
vehicle (except taxi) in Delhi due to no entry hours. Traffic
Nos. were found from Badarpur to NHPC Chowk and NHPC
Chowk to Badarpur respectively, ranging from 14304 to
© 2020, IRJET | Impact Factor value: 7.529 | ISO 9001:2008 Certified Journal | Page 1458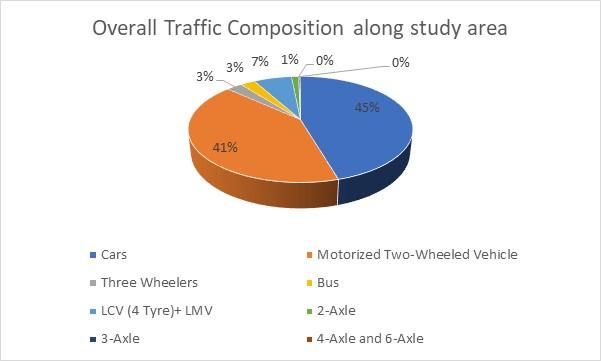
International Research Journal of Engineering and Technology (IRJET) e-ISSN: 2395-0056
Volume: 07 Issue: 10 | Oct 2020 www.irjet.net p-ISSN: 2395-0072
f: Overall Traffic Composition d: Traffic Composition on 18-09-2020
Chart - 1: Traffic Composition Badarpur To NHPC Chowk e: Traffic Composition on 19-09-2020
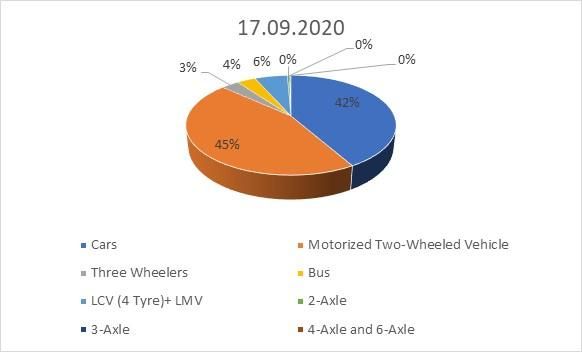
a: Traffic Composition on 15-09-2020
f: Overall Traffic Composition
b: Traffic Composition on 16-09-2020
Chart - 2: Traffic Composition NHPC Chowk to Badarpur
c: Traffic Composition on 17-09-2020
© 2020, IRJET | Impact Factor value: 7.529 | ISO 9001:2008 Certified Journal | Page 1459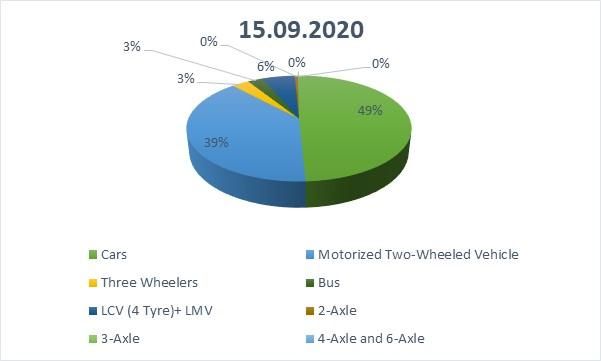
International Research Journal of Engineering and Technology (IRJET)                                e-ISSN: 2395-0056
         Volume: 07 Issue: 10 | Oct 2020             www.irjet.net                                          p-ISSN: 2395-0072

   Chart - 3: Overall Traffic Composition in Study Road

    Using the emission factors and corresponding                      Chart - 5: Temporal and Spatial Distribution of Sulphur
deterioration factors, the weighted emission factor was                                 Dioxide in µg/m3
calculated. The weighted emission factor of the specified
pollutant (gm / km / vehicles), i.e. EW can be calculated as
the cumulative amount of the vehicle product Nos. in the
particular age group, pollutant deterioration factor and
emission factor divided by the total number of vehicles
registered. Varying from 2.27 to 2.41 gm / mile / vehicle, the
weighted emission factor was found. Micro-meteorology data
as needed for Caline 4 model application including hourly
wind speed, direction, ambient temperature, etc. were
collected from the Indira Gandhi International Airport Station
website of wunderweather. Mixing height was extracted from
the Atlas of Hourly Mixing Height and Assimilative Capacity of
Atmosphere in India published by India Meteorological Dept.
for post-monsoon season Around India.
3. RESULTS AND DISCUSSION
                                                                      Chart - 6: Temporal and Spatial Distribution of Nitrogen
   Considering the Covid 19 pandemic scenario, the limited                              Dioxide in µg/m3
commercial activities are supporting the satisfactory level of
ambient air pollutant.
    The concentration of Particulate matter 10 was found
varying from 74 to 92 µg/m3 in respect to the prescribed
National Ambient Air Quality Standards of 100 µg/m3 for
residential areas. The concentration of SO2 and NO2 were
found varying from 5.2 to 8.2 µg/m3 and 16.9 to 24.3 µg/m3
respectively in respect to residential NAAQS limit of 80
µg/m3. The spatial distribution of Carbon Monoxide was
found varying from 0.42 to 0.76 mg/m3 in respect to 8 hourly
NAAQS of 2 mg/m3. The spatial and temporal variation of the
Ambient Air Quality Parameters are presented in Figures
                                                                       Chart - 7: Temporal and Spatial Distribution of Carbon
below.
                                                                                       Monoxide in mg/m3

                                                                         All the input parameters have been gathered and
                                                                     incorporated in the various tabs on individual input screens
                                                                     for Job Parameters, Rub Conditions, Link Geometry, Link
                                                                     activity and receptors positions. Since the model is window
                                                                     based therefore after incorporation of parameters the run
                                                                     command has been given and the output file has been saved.
                                                                     The model has been run for 8 hourly data (multi run
                                                                     scenario) based on climatological data downloaded from
                                                                     wunderground’s website.

Chart - 4: Temporal and Spatial Distribution of Particulate
                  Matter 10 in µg/m3
© 2020, IRJET        |    Impact Factor value: 7.529             |    ISO 9001:2008 Certified Journal           |   Page 1460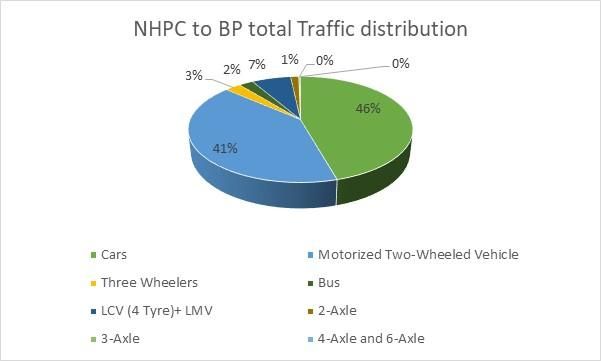
International Research Journal of Engineering and Technology (IRJET)                                     e-ISSN: 2395-0056
          Volume: 07 Issue: 10 | Oct 2020               www.irjet.net                                              p-ISSN: 2395-0072

   The model was run considering the Multi run / Worst case             [6]    Laura E. Venegas and Nicolás A. Mazzeo (2013), ‘A
approach. In this approach model itself estimate the wind                      Method for Selection of Background Air Quality
direction for worst case scenario pollution load assessment.                   Monitoring Sites in an Urban Area’
This approach negates the variation of prediction due to wind           [7]    R. Angle Consulting (2014), ‘Ambient Air Quality
angle.                                                                         Objectives’
                                                                        [8]    Xingzhe Xie, Ivana Semanjski, Sidharta Gautama,
4. CONCLUSIONS                                                                 Evaggelia Tsiligianni, Nikos Deligiannis, Raj Thilak
                                                                               Rajan, Frank Pasveer and Wilfried Philips (2017), ‘A
    Predicted results have clear indication that the CO                        Review of Urban Air Pollution Monitoring and Exposure
concentration varies significantly with downwind distance                      Assessment Methods’
from the running traffic and atmospheric conditions. The                [9]    Mogesh Naidoo and Mark Zunckel (2018), ‘Overview of
predicted results were found varying from 0.06 mg/m3 to                        ambient air quality monitoring in South Africa’
0.15 mg/m3 across the receptors. The variation in the                   [10]   Sadheesh Sellamuthu (2018), ‘Assessment of Ambient
predicted concentration is observed due to traffic scenario,                   Air Quality Monitoring and Modelling in Coimbatore
distance of the receptors from the traffic point, width of                     City’
mixing zone and most importantly the meteorological                     [11]   Baijayanta Kumar Majumdar, Amit Dutta, Shibnath
scenario. Calm weather condition supports the least                            Chakraborty and Subhabrata Ray (2009), ‘Assessment of
dispersion, which results in higher concentration near to                      vehicular pollution in Kolkata, India, using CALINE 4
roadways. Scenario was observed in the modeling study                          model’
undertaken for Saturday i.e. 19th September, 2020. On this              [12]   Niraj Sharma, Sunil Gulia, Rajni Dhyani and Anil Singh
day traffic was the least in number, however, calm condition                   (2013), ‘Performance evaluation of CALINE 4 dispersion
didn’t support dispersion of the pollutant. Therefore, highest                 model for an urban highway corridor in Delhi’
ever predicted concentration were observed on this day.                 [13]   Niraj Sharma, Sunil Gulia, Rajni Dhyani and Anil Singh
                                                                               (2013), ‘Performance evaluation of CALINE 4 model in a
   The spatial distribution of Carbon Monoxide was found                       hilly terrain – a case study of highway corridors in
varying from 0.42 to 0.76 mg/m3 in comparison to the                           Himachal Pradesh (India)’
predicted concentration of 0.06 to 0.15 mg/m3. The                      [14]   Rout Chadetrik, Gulia Sunil and Saini Mukesh (2015),
monitoring results were slightly higher than the modelled                      ‘Air Quality Prediction along a Highway Corridor under
value. Higher values of the monitoring can be concluded as                     Mixed Traffic Condition’
due to long term deposition of the Carbon Monoxide in the               [15]   Md M Karim, Hiroshi Matsui and Randall Guensler
atmosphere and horizontal movement of the gaseous                              (1998), ‘A mathematical model of wind flow, vehicle
pollutant from the nearby emitters like DG set, Parking areas,                 wake, and pollutant concentration in urban road
commercial activities, etc. as Caline 4 model capability is                    microenvironments. Part II: Model results’
limited for assessment of traffic generated emission only.              [16]   Validation of air pollution dispersion modeling for the
                                                                               road transport sector under Irish conditions (2000-LS-
    Further, since vehicles contribute significantly to the total              6.3-M1)
air pollution load in most urban areas vehicular pollution              [17]   Performance evaluation of air quality dispersion models
control deserves top priority. A practical strategy should be                  at urban intersection of an Indian city: A case study of
devised that reduces both emissions and congestion, using a                    Delhi city
mixed set of instruments, which are dictated by command                 [18]   Mayer, H., Air pollution in cities. Atmospheric
and control, and / or the market-based principles.                             Environment (1999), pp. 4029- 4037
REFERENCES                                                              [19]   Sharma, N., Chaudhry, K.K. and Rao, C.V.C., Vehicular
                                                                               pollution modeling in India. Journal of the Institution of
                                                                               Engineers (India), (2005), pp. 46-63
[1]   Humaib Nasir, Kirti Goyal and Dolonchapa Prabhakar
      (2016), ‘Review of Air Quality Monitoring: Case Study of          [20]   Badami, M. G., Urban transport policy as if people and
      India’.                                                                  the environment mattered: Pedestrian accessibility the
                                                                               first step. Economic & Political Weekly, EPW Vol. XLIV
[2]   C. P. Kaushik, Ravindra Khaiwal, Krishan Yadav,                          (33), 2009
      Surender Mehta and A. K. Haritash (2006), ‘Assessment
      of Ambient Air Quality in Urban Centres of Haryana                [21]   CPCB, Status of vehicular pollution control program in
      (India) in Relation to Different Anthropogenic Activities                India, Program Objective Series/PROBES/136/2010
      and Health Risks’.
[3]   Lakshmi Rajagopalan and Sarah Lamothe (2015), ‘Urban
      Air Pollution Data in India: Gaps Between Regulations
      and Reality’
[4]   Pallavi Pant & Raj M. Lal & Sarath K. Guttikunda &
      Armistead G. Russe & Ajay S. Nagpure & Anu
      Ramaswami & Richard E. Peltier (2018), ‘Monitoring
      particulate matter in India: recent trends and future
      outlook’
[5]   Umesh Chandra and Kamal Jain (2013), ‘Web Based
      Ambient Air Quality Monitoring System for Delhi’.

© 2020, IRJET          |   Impact Factor value: 7.529               |    ISO 9001:2008 Certified Journal               |   Page 1461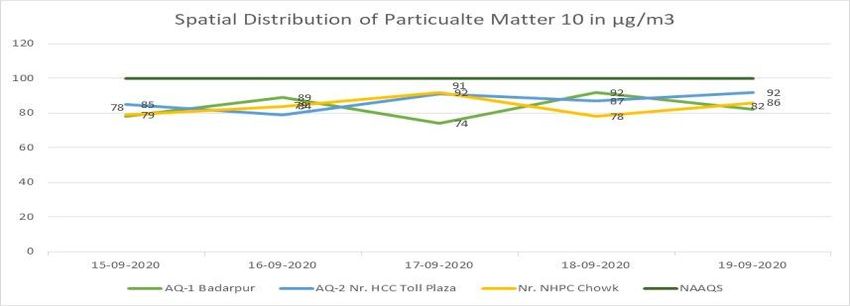
International Research Journal of Engineering and Technology (IRJET)                    e-ISSN: 2395-0056
      Volume: 07 Issue: 10 | Oct 2020           www.irjet.net                             p-ISSN: 2395-0072

BIOGRAPHIES

                Pintu Kumar has 12+ years of
                progressive experience in the field
                of Environment, Risk/Hazard and
                Social Impact Assessment (ESIA)
                Studies,      formulation        of
                Environment & Social Management
                and Monitoring Plan / Framework
                (ESMMP / ESMF), Environment
                and Social Audit & Due diligence
                (ESDD),       Preparation        of
                Environment and Social Action
                Plan (ESAP), Air Dispersion
                Modeling,     Risk    Assessment
                Modeling, Noise Modeling, carrying
                capacity assessment, preparation
                of Forest Diversion Proposals,
                Wildlife Clearance / NoC Proposal,
                etc.

© 2020, IRJET   |    Impact Factor value: 7.529        |    ISO 9001:2008 Certified Journal      |   Page 1462
You can also read