Game-Watching Should be More Entertaining: Real-Time Application of Field-Situation Prediction to a Soccer Monitor - RoboCup 2019
←
→
Page content transcription
If your browser does not render page correctly, please read the page content below
Game-Watching Should be More Entertaining:
      Real-Time Application of Field-Situation
           Prediction to a Soccer Monitor

    Yudai Suzuki1 , Takuya Fukushima1 , Léa Thibout1 , Tomoharu Nakashima1 ,
                             and Hidehisa Akiyama2
                             1
                            Osaka Prefecture University
                               2
                                 Fukuoka University
             {yudai.suzuki, takuya.fukushima}@kis.osakafu-u.ac.jp,
         thiboutlea@eisti.eu, tomoharu.nakashima@kis.osakafu-u.ac.jp,
                              akym@fukuoka-u.ac.jp

        Abstract. This paper describes an extension to a soccer monitor used
        in the RoboCup Soccer Simulation 2D League. The aim of the exten-
        sion is to make the experience of watching games more entertaining. The
        audio effects and the visualization are focused on this purpose. The ex-
        tended soccer monitor simulates the supporters’ excitement in watching
        a game by estimating the time cycle until the next goal, which is called
        SituationScore. This paper describes how SituationScore is obtained
        using a machine learning model and also describes the resulting soccer
        monitor.
          – github : https://github.com/rinmunagi/spectator_app
          – YouTube demo : https://youtu.be/J_NgcwcFtQI

1     Introduction
Soccer is a sport as well as an entertainment. RoboCup soccer should have the
same characteristics as the real soccer has. The current version of the official
soccer monitor [1] shows only the status of the soccer field. This is a simple
monitor just for watching games. soccerwindow2 [2] is an extended soccer mon-
itor which is mainly for promoting a team development. For the team developers,
soccerwindow2 is one of the most useful tools to analyze games and perceive
about the thinking process of the players. Although the monitor is sufficient for
the team developers to watch the games. If there were an additional effects in
accordance with the field status, such effects would make the spectator possible
to enjoy the game more. For example, the audio narration would be helpful for
the spectator to understand what is happening the ongoing game. For instance,
Caspian monitor [3] has a function of on-line commentary that utters in the real
time when passes and shoots are made. Another audio information is the sound
from the virtual supporters inside the soccer monitor. The cheering and booing
could have non-verbal effect to enjoy watching the game. In this paper, we define
“the supporters” as the virtual supporters inside the soccer monitor, and “the
spectator” as the real-world people who watching the soccer monitor.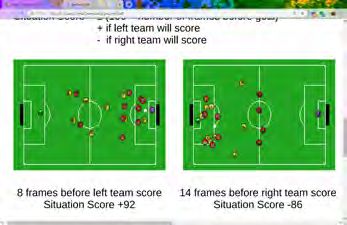
In this paper, we propose an application that extends soccerwindow2 in
the way the spectator does not miss the important scenes such as scoring. A
prediction model is built by learning the field situation from a set of log files.
Nakashima et al.[4] proposed a machine learning method to evaluate the game
situation quantitatively from field images. We also use the same method in our
application to express the excitement of the supporters. The prediction model
takes the current field situation as an input and produces the number of ex-
pected time steps until the next goal, which is called a SituationScore. We have
enhanced soccerwindow2 so that it produces a sound effect and the visualization
according to the SituationScore.
2 Soccer Simulation 2D League
Since the games in the Soccer Simulation 2D League happen on a virtual soccer
field constructed within a computer, every piece of information regarding the
games can be digitally stored. This stored information can be easily utilized
for analysis purposes by team developers. Such logs contain, for example, the
coordinates of the ball and all players’ positions, the velocity of the ball and
the players, and the players’ body and neck angle for every cycle of a game.
Therefore, it is not surprising that the log files play an important role when
analyzing games and designing strategies.
Games can be visualized on computers even after the games are finished by
using tools such as soccerwindow2 [2] that displays the position of the ball and all
players for every cycle of the game, with one computational cycle corresponding
to one frame on it. A game consists of 6,000 cycles and one cycle is discretized
in 0.1 second, which means a game consists of 6,000 frames. Figure 1 shows
the example screen of the ongoing game on soccerwindow2. soccerwindow2 is
a component of HELIOS Base package [5]. This tool not only allows spectators
to watch games, but also allows researchers to replay the same game, the same
actions, in order to easily analyze them.
3 SituationScore Evaluation
In the RoboCup Soccer Simulation 2D League, there are various ways to define
the degree of dominance in an ongoing game. Example metrics would be the
number of those players who are on a specific part of the field, the target place
and the partner teammate of passes, and the position and the player of the
current ball holder. While such analysis can be easily conducted using numerical
data from log files, it would be much more complicated to work only with field
images that are provided by the soccer monitor. Therefore, another metric was
defined in [4], which is called a SituationScore, that asseses the situation of a
game without numerical data.
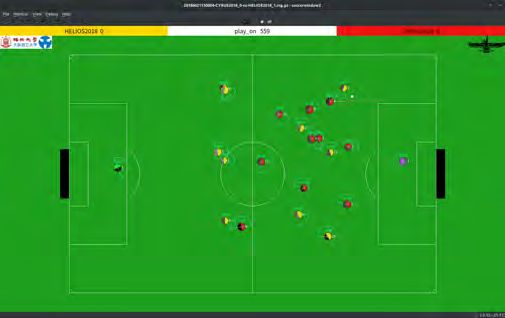
In this paper, we also employ SituationScore of a frame fr as the value of a
field situation, which is defined by the following equation:
SituationScore(fr ) = ±(100 − n), (1)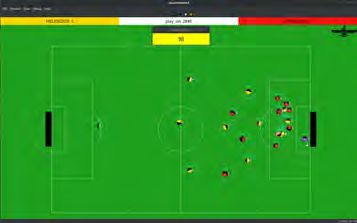
Fig. 1: Running a game on soccerwindow2.

where n is the number of frames between fr and the one corresponding to the
next goal. It is assumed in this paper that the considered frames are at most 100
cycles away from the next goal. Therefore, in this formula, n should be lower
than 100. The range of SituationScore is −100 ≤ SituationScore ≤ 100. The
sign of SituationScore is determined by the team that will score the next goal.
A positive value is assigned when the next goal is scored by the left team. On
the other hand, a negative value is assigned when the next goal is scored by
the right team. An example of soccer field images and its corresponding score is
provided in Figure 2.

(a) 35 frames before the left team scores.   (b) 17 frames before the right
The corresponding SituationScore is          team    scores.   The  corresponding
+65.                                         SituationScore is −83.

        Fig. 2: The example of soccer field images and SituationScore.

   The definition of the SituationScore in this paper brings us two main merits.
The first merit is easy to assign SituationScore to newly produced images, as it
does not require any complex computation. The second merit is inherent to our
objective, which is to work only with images. SituationScore does not take into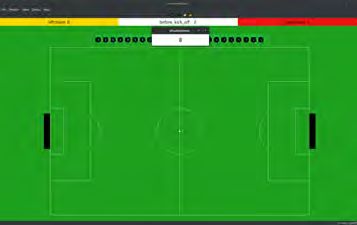
account the state of the field itself at all, but only the number of frames before
next goal. Therefore, all situations or formations can be automatically covered
by this model.
    Using the defined SituationScore, a prediction model is built. that model
estimates the value of SituationScore for any given frame. The next section
talks about a prediction model.

4     Prediction Model

Nakashima et al. [4] showed high prediction accuracy of SituationScore by using
a CNN model that handles image data. Therefore, we also employ a CNN for
the prediction model of the SituationScore. This section first describes the CNN
model in detail, and then describes the dataset used for training the model.

4.1   The CNN Model

The CNN model is trained with Python scripts and based on the images gen-
erated by soccerwindow2 during matches. We decided to use the TensorFlow
library [6] for use the CNN model. A CNN architecture as well as its appropri-
ate hyper-parameter values leading to satisfactory results have been determined
by our preliminary experiments. Our architecture is illustrated in Fig. 3. The
network structure is similar to the VGG architecture [7]. This structure has four
convolutional blocks (blue boxes), four max-pooling layers (orange boxes), and
a four-layered fully-connected block. ReLU (Rectified Linear Unit) is used as an
activation function. Adam algorithm [8] is used as the optimizer. Our CNN was
trained with an initial learning rate of 0.0001, then it was decreased by 5% every
1500 steps. The size of the mini batch was 16. It should be also noted that our
CNN takes a 160 × 256 image as input and the dropout rate is 15% at the last
layer of each convolutional block, as well as after each fully-connected layer.

         160x256x32

                 80x128x64

                             40x64x128                      5x8x256
                                         20x32x256
                                                     10x16x256      4096        4096        4096         1

                                                                 Convolutional layer + ReLU activation

                                                                 Max pooling

                                                                 Fully connected + ReLU activation

Fig. 3: Architecture of our CNN, composed of four convolutional blocks as in
VGG, but with another fully-connected layer at the end of the network.
4.2 Dataset for Training The Model
In order for our dataset to cover as many situations and formations as possible,
games between several 16 different teams have been simulated.
Dataset-creation process is decomposed into the following five steps:
1. Games between each possible pair of teams are performed.
2. Log files of games without any goals are deleted.
3. For each game, every frame is saved using soccerwindow2.
4. Their corresponding log files are analyzed by using Python scripts to deter-
mine at which cycles goals have been scored.
5. The field situations of 0 ∼ 100 frames before each of these goals are captured,
and the value of SituationScore for these frames is computed. These frames
are saved as an image data, and the name of the image file is specified so as
to include their SituationScore value.
When using soccerwindow2 in this procedure, some graphic options have
been specified, mainly to enhance the frames’ quality, to remove superfluous
information, and to enlarge the players and the ball. These options include hiding
score board, player numbers, view area, stamina and potential yellow card, as
well as setting player size to 2.0, and ball size to 1.3. The size of the saved
images has also been specified in these options, but because the minimum size
from soccerwindow2 is 280 × 167, captured frames have been then cropped to
be of size 256 × 160. Soccer field images such as in Figure 2 offers a good insight
of frames contained in our dataset.
A dataset containing about 1.02 million soccer field images taken from 5,215
games was constructed. This dataset was then split into three parts: a training
set containing ∼720,000 images, a validation set containing ∼156,000 images
and a test set containing ∼135,000 images. Images from a specific game are all
included in only one of these sets. In other words, each of these sets contains
images from different games. The CNN model trained by this dataset, and the
performance to the test data was as high as M eanAbsoluteError = 14.00.
5 Application of the Prediction Model to Soccer Monitor
We developed a spectator application by extending soccerwindow2 in order to
pursue the entertaining aspect. This application expresses the supporters’ ex-
citement by sound effects and visualization.
First of all, this application calculates the SituationScore by using the
trained CNN model described in 4.2. And then, the SituationScore is displayed
on the window with color changing and sound effects like as supporters’ cheering.
The CNN model in the spectator application was trained the dataset as de-
scribed in 4.2. The SituationScore only have to be evaluated at the end of
the match in the previous work [4]. This is because we could only take images
after finishing the game. To use the trained model in real time, we need to cap-
ture images from the ongoing game in real time. This paper proposes to permitthis score to be evaluated during a match, in real time. We store images from
soccerwindow2 in real time and pass them into the already trained CNN model.
Figure 4 shows the architecture of the spectator application. The application
performs the following procedure:
The first procedure is to take the images from extended soccerwindow2 in
real time using the Qt library. Then, soccerwindow2 sends the directory name
of saving images to the Python server. And, the python server evaluates the
saved images by using the trained CNN model. Finally, the application expresses
the supporters excitement by sound effects and color display according to the
SituationScore. We use socket connection by TCP/IP protocol to connect be-
tween soccerwindow2 and the server, and the first one was coded in C++ and
the second one in Python.
Extended soccerwindow2 Python server
CNN !"#$%#"&'!(&)*
Evaluate
Directory
Effects
Capture name
& Save
Send
Directory Display Sound
C++ (Qt) Python (PyQt)
Fig. 4: The architecture of the spectator application.
Once we begin a game between two teams, the images of the game in progress
are stored every five frames in a local directory. Then, whenever an image
is stored, soccerwindow2 sends the saved directory name as a signal to the
Python server for evaluating the image. The trained CNN model calculates the
SituationScore of the image in the directory when the Python server receives
the signal. What is more, the Python server add sound effects and display the
colored window according to the SituationScore. The image already used is
sequentially moved to the other directory that store images of the past.
Figure 5a shows the window displays the SituationScore using PyQt library.
This window’s background is colored and changes the color according to the
SituationScore as shown in Figure 5b. If the situation is good for the yellow
team, the window gradually changes to yellow. And if the situation is good for
the red team, the window gradually changes to red. It’s shown in Figure 6.
In addition, the application has the sound effects in order to make the
game-watching experience more entertaining during a whole game. We employed(a) The SituationScore displayed. (b) The good situation for the yellow team.
Fig. 5: Example images displaying the SituationScore.
Fig. 6: The background color of the window gradually changes to red or yellow
according to the SituationScore.
the sounds library called Freesound [9]. The application implements real soccer
game’s supporters sound that is included in the Freesound library. The sound
effects are changed according to the SituationScore. There are three kinds of
sound effects : murmuring sounds (in stereo), cheering sound from the side of the
dominating team (in monaural), and excited cheering sound from both sides of
the teams (in stereo). Figure 7 shows the image of the sound effect. The choice
of the sound out of the three is defined by using two thresholds T 1 and T 2
(0 < T 1 < T 2 < 100) of SituationScore. When the SituationScore is higher
than T 1, which means it is a great opportunity for the yellow team (left team) to
score, the sound volume from the left speaker is turned up. On the other hand,
if the SituationScore is lower than −T 1 which means the field situation is in
favor for the red team (right team), the sound volume from the right speaker is
turned up. Furthermore, if the SituationScore is greater than T 2 or less than
−T 2, the sound is changed to more excited cheering. For the other cases, thesound is set to the murmuring noise from both sides. The thresholds are set as
T 1 = 70 and T 2 = 90 in the demo movie1 .
(a) The good situation for the yellow team. (b) The good situation for the red team.
Fig. 7: Sound effects of the supporters.
The spectator application is available at our code repository2 . This contains
the already-trained CNN prediction model. This application works on Ubuntu
OS, and requires rcssserver3 and soccerwindow2-screenshot4 as tools. The other
required libraries include Python 2.7, Tensorflow 1.12.0, PyQt4 and opencv2. Af-
ter preparing the above, the application called soccerwindow-screenshot should
be put in spectator app directory. If librcsc [5] is not installed in the system di-
rectory (default path), it is necessary to change the library path in the script
called execute. If the shell script execute is executed, three windows are launched:
two soccerwindow2 and the window for display the SituationScore. One of the
launched soccerwindow2 is the main window for watching games and the other
generates the images in order for the CNN to predict SituationScore. Next,
the both soccerwindows should be connected to the rcssserver and run the team
scripts to start a game. Lastly, a game is started with a ’KickOff’ option.
The demonstration, the tutorial, and detailed information are described in
the demo movie5 .
6 Conclusions
In this paper, we described an extension to a soccer monitor that is used in
the RoboCup Soccer Simulation 2D League. The extension is achieved by using
SituationScore and a machine learning method. The extension involves visual-
ization and sound effects by using the SituationScore that make the experience
of watching games more entertaining.
1
https://youtu.be/J_NgcwcFtQI
2
https://github.com/rinmunagi/spectator_app
3
https://github.com/rcsoccersim/rcssserver
4
https://github.com/rinmunagi/soccerwindow2-screenshot
5
https://youtu.be/J_NgcwcFtQIReferences 1. RoboCup Soccer Simulation Monitor, https://github.com/rcsoccersim/ rcssmonitor Accessed on June 8, 2019. 2. Hidehisa Akiyama (2009) RoboCup tools. https://osdn.net/projects/rctools/ releases/68532 Accessed on June 8, 2019. 3. M. N. Sedaghat, N. Gholami, B. Mirbagheri, A. Afkanpour, S. Vaisipour, H. H. Saffar, V. Montaghami, M. Shahbazi, O. M. Tourzan, M. Jeddi, A. Va- linejad, A. Motamedi, M. Kangavari (2003) Caspian 2003 Presentation Descrip- tion. https://archive.robocup.info/Soccer/Simulation/2D/TPs/RoboCup/2003/ Caspian_SS2D_RC2003_TP.pdf Accessed on June 8, 2019. 4. Tomoharu Nakashima, and Tanguy Pomas, “Evaluation of Situation in RoboCup 2D Simulations using Soccer Field Images”, Proc. of the RoboCup Symposium, 12 pages, 2018. 5. Hidehisa Akiyama, and Tomoharu Nakashima, “HELIOS Base: An Open Source Package for the RoboCup Soccer 2D Simulation”, The 17th annual RoboCup Inter- national Symposium, 2013. 6. Martn Abadi, Ashish Agarwal, Paul Barham, Eugene Brevdo, Zhifeng Chen, Craig Citro, Greg S. Corrado, Andy Davis, Jeffrey Dean, Matthieu Devin, Sanjay Ghe- mawat, Ian Goodfellow, Andrew Harp, Geoffrey Irving, Michael Isard, Rafal Joze- fowicz, Yangqing Jia, Lukasz Kaiser, Manjunath Kudlur, Josh Levenberg, Dan Man, Mike Schuster, Rajat Monga, Sherry Moore, Derek Murray, Chris Olah, Jonathon Shlens, Benoit Steiner, Ilya Sutskever, Kunal Talwar, Paul Tucker, Vincent Van- houcke, Vijay Vasudevan, Fernanda Vigas, Oriol Vinyals, Pete Warden, Martin Wat- tenberg, Martin Wicke, Yuan Yu, and Xiaoqiang Zheng, “TensorFlow: Large-scale machine learning on heterogeneous systems”, 2015, Software available from tensor- flow.org. 7. Simonyan, Karen, and Andrew Zisserman, “Very deep convolutional networks for large-scale image recognition”, arXiv preprint arXiv:1409.1556, 2015. 8. Diederik P Kingma and Jimmy Ba, “Adam: A method for stochastic optimization”, International Conference on Learning Representations, 2015. 9. Alastair Porter, Bram de Jong, Frederic Font, Sonia Esp, Xavier Serra, Eduardo Fonseca, Xavier Favory, and Antnio Ramires (2005) Freesound. https://freesound. org/ Accessed 8 June 2019.
You can also read