Climate change impacts on rainfall erosivity and hillslope erosion in NSW - Core
←
→
Page content transcription
If your browser does not render page correctly, please read the page content below
21st International Congress on Modelling and Simulation, Gold Coast, Australia, 29 Nov to 4 Dec 2015
www.mssanz.org.au/modsim2015

         Climate change impacts on rainfall erosivity and
                    hillslope erosion in NSW
                                     X. Yang a, B. Yu b and Q.G. Zhu c
 a
     New South Wales Office of Environment and Heritage, PO Box 3720, Parramatta, NSW 2150, Australia.
                   b
                     School of Engineering, Griffith University, Queensland 4111, Australia.
       c
         Ecological Modelling Research Group, University of Technology, Sydney, NSW 2007, Australia.
                                 Email: xihua.yang@environment.nsw.gov.au

Abstract: There are considerable seasonal and inter-annual changes in rainfall amount and intensity in
South-East Australia (SEA), particularly in coastal New South Wales (NSW). Consequently, soil erosion
rates may be expected to change in response to changes in the erosive power of rainfall or rainfall erosivity.
Recently, the downscaled 10 km rainfall projections from New South Wales (NSW) and Australian Capital
Territory (ACT) Regional Climate Modelling (NARCliM) project have become available for the SEA region
for the baseline (1990-2009), near future (2020-2039) and far future (2060-2079) periods. The aim of this
study was to model and assess the impacts of climate (rainfall) change on rainfall erosivity and hillslope
erosion risk in SEA based on the NARCliM projections from all the 12 model member ensembles. Outcomes
from this study are to assist the long-term climate change adaptation and regional planning such as NSW
state planning regions (SPR).
A daily rainfall erosivity model has been specifically developed and applied to calculate monthly and annual
rainfall erosivity values from the NARCliM projected daily rainfall data for the baseline and future periods.
Monthly and annual hillslope erosion risks for the same periods were estimated using the Revised Universal
Soil Loss Equation (RUSLE). Finer scale (100 m) surfaces of rainfall erosivity and hillslope erosion have
been produced using spatial interpolation techniques. Automated scripts in a geographic information system
(GIS) have been developed to calculate the time-series rainfall erosivity and hillslope erosion so that the
processes of large quantity NARCliM data are realistic, repeatable and portable.
Adequate random sampling points (4991) were used to sample and assess the accuracy of the modelled
rainfall erosivity from the NARCliM projections. The GIS modelled mean annual rainfall erosivity values
from the NARCliM projected daily rainfall were compared with those calculated using the gridded daily
rainfall data from Bureau of Meteorology for the baseline period (1990-2009). The overall coefficient of
efficiency (Ec) is 0.9753 (R2 = 0.9762), and RMSE 13.2% or 143 (MJ.mm.ha-1.hr-1.year-1) indicating the
relative size of the error bars from the 1:1 line.
The modelled baseline rainfall erosivity in NSW varies from less than 300 on parts of western NSW to over
15,000 on parts of the North Coast, with a mean of 1112 (MJ.mm.ha-1.hr-1.year-1). Both rainfall erosivity and
hillslope erosion risk are predicted to increase about 7% in the near future, and about 19% increase in the far
future compared with the baseline period. The change is highly uneven in space and time, with the highest
increase occurring in the Far-west SPR in autumn, with an increase about 22% in the near future and about
29% in the far future. The rainfall erosivity is generally higher in summer and lower in winter, with about 10
times difference between February (highest) and July (lowest).
Overall, the risk of soil erosion on NSW agricultural and plantation lands is expected to be steady, largely
due to the flat topographic factor. The lands with “Intensive uses” will have high erosion risk due to the
combined effect of terrain and rainfall erosivity. These ‘hot-spot’ erosion risk areas have been identified and
mapped to assist decision makers to develop the best management practices.
Keywords:      Rainfall erosivity, hillslope erosion, climate change, impact assessment, NARCliM

                                                   1572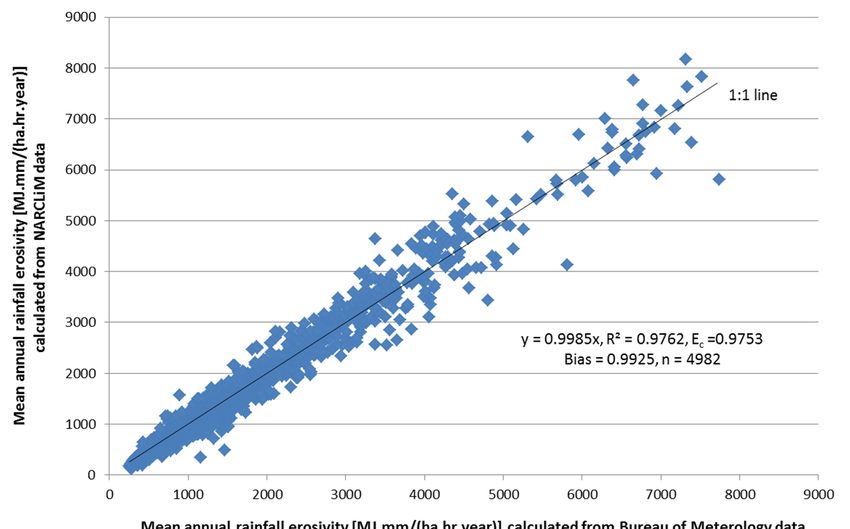
Yang et al., Climate change impacts on rainfall erosivity and hillslope erosion in NSW

1.   INTRODUCTION
Climates in New South Wales (NSW) are highly variable, ranging from subtropical in the northeast part with
summer-dominated rainfall to temperate climates with uniform or moderately winter rainfall in the southern
part. The temporal and spatial variations in rainfall have enormous implications for soil conservation, food
security, and natural resources management. One of the key climate drivers for soil erosion and land
degradation is rainfall erosivity or R-factor as defined in the Revised Universal Soil Loss Equation (RUSLE,
Renard et al. 1997).
Rainfall erosivity is largely a function of rainfall amount and peak rainfall intensity, and the R-factor, in unit
MJ.mm.ha-1.hr-1.year-1, is a multi-annual average index that measures rainfall's kinetic energy and intensity to
describe the effect of rainfall on sheet and rill erosion (Renard et al. 1997). When factors other than rainfall
are held constant, soil losses due to water erosion are directly proportional to the level of rainfall erosivity
(Wischmeier and Smith 1978). When using the RUSLE, the R-factor is multiplied with other component
factors relating to slope and slope-length (LS-factor), soil erodibility (K-factor), ground cover (C-factor) and
soil conservation practices (P-factor) to predict the average annual soil loss per unit area.
Earlier work on rainfall erosivity in NSW was focused on the R-factor values calculated using pluviograph
data at selected sites, and empirical relationships between the R-factor and rainfall intensity were used to map
rainfall erosivity (Rosewell and Turner 1992). These isoerodent rainfall erosivity maps for NSW are static in
nature, and unable to capture the seasonal and inter-annual variability in rainfall erosivity.
While a change in rainfall amount and intensity is expected to have significant effect on rainfall erosivity and
soil erosion, the magnitude of the impact is not well quantified because of the non-linear nature of the
relationship between rainfall amount and rainfall erosivity, and the extreme nature of large erosive events.
Natural resource management targets can be more easily achieved if the soil erosion hazard and land
degradation is well understood, and if the mean as well as extreme erosivity values are accurately mapped at
a range of temporal and spatial scales. The high resolution R-factor maps, in both spatial and temporal
contexts, can provide detailed information for climate (rainfall) impact assessment, and inform measurable
and cost effective means in sheet erosion identification and rehabilitation.
A daily erosivity model has been developed and the required parameter values can be estimated from long-
term climate averages or geographical attributes to allow efficient large scale erosion assessment (Yu and
Rosewell 1996; Yu 1998; Lu and Yu 2002). The technology has been widely used to estimate the magnitude
and spatial distribution of soil erosion at a range of temporal and spatial scales (Lu and Yu 2002; Lu et al.
2003), and for assessment of the impact of projected future climates on soil erosion and catchment health in
NSW (Yang et al. 2015). With the regional relationship for model parameters (Yu 1998; Lu and Yu 2002),
rainfall erosivity can now be estimated with gridded daily rainfall data anywhere in Australia. The improved
rainfall erosivity model (Yang and Yu 2015) may also have the potential to predict spatial and temporal
changes of rainfall erosivity and soil erosion risk using future climate projections.
NSW and ACT Regional Climate Modelling (NARCliM) funded by NSW Office of Environment and
Heritage (OEH) is an initiative to produce regional climate projections for South-East Australia. 12 climate
member ensembles were used to provide robust and unbiased projections that span the range of likely future
changes in climate (Evans et al. 2014). A wide variety of climate variables have been made available at high
temporal and spatial resolution for use in impacts and adaptation research including precipitation at daily and
hourly steps which are the major input data in this study.
The aim of this study was to model and assess the impacts of climate (rainfall) change on rainfall erosivity
and hillslope erosion across South-East Australia (SEA) based on simulations from the NARCliM
projections, and produce finer scale (up to 100-m resolution) time-series R-factor maps using spatial
interpolation techniques. This report outlines the data and methods used to produce the time series rainfall
erosivity maps for NSW and SEA, and the impact assessment of baseline and future rainfall on erosivity and
hillslope erosion risk in the state planning regions (SPR) of NSW.

2.   DATA, STUDY AREA AND METHODS
The dominant input data sets include: 1) NARCliM projected daily rainfall with bias correction for all 12
member ensembles from four Global Climate Models (GCM, CGCM 3.1, CSIRO mk3.0, ECHAM5,
MIROC-medres 3.2) and three Regional Climate Models (RCM, R1, R2, R3) for all three time periods
(1990–2009, 2020–2039, 2060–2079); 2) Gridded daily rainfall at 5 km spatial resolution from Bureau of
Meteorology since 1900; 3) 1-second (about 30m) hydrologically corrected Digital Elevation Model (DEM-

                                                    1573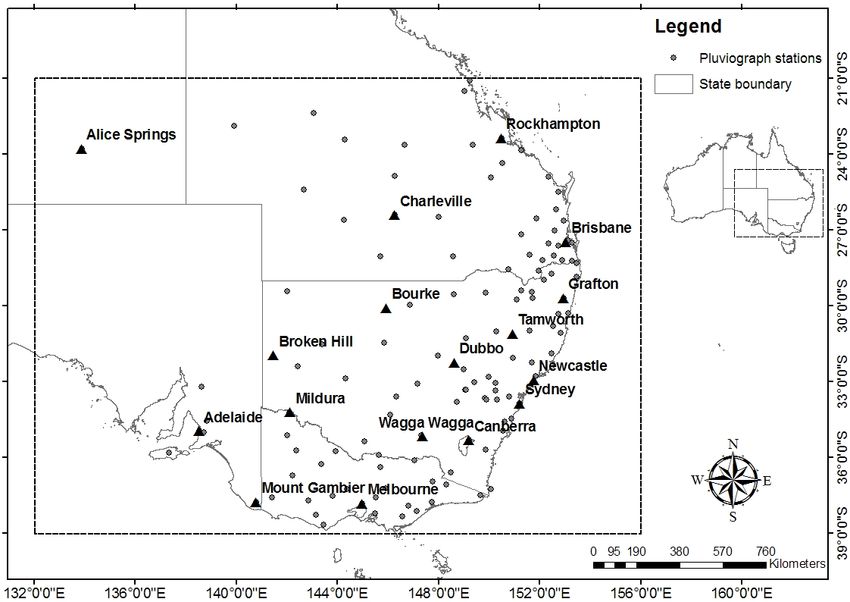
Yang et al., Climate change impacts on rainfall erosivity and hillslope erosion in NSW
H) from GeoScience Australia; 4) NSW Great Soil Groups (GSG) map and Soil and Land Information
System (SALIS) from OEH.
The NARCliM model domain is defined 21.669º-39.749ºS and 132.724º-165.725ºE which covers the SEA
landmass area (Evans et al. 2014). There are 124 rainfall stations in SEA with pluviograph data available for
model development and validation (Yang and Yu 2015). For statistical purposes, the spatial variation and
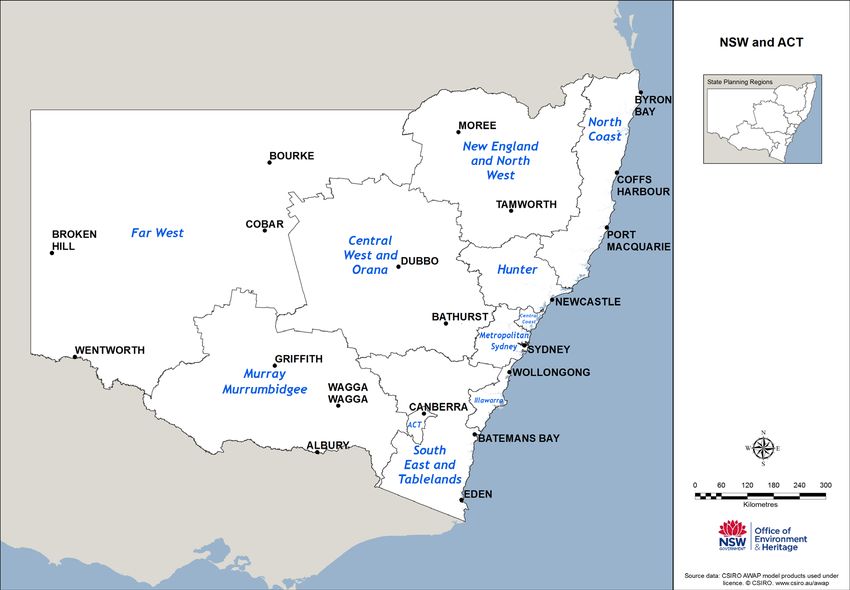
comparisons are focused on NSW SPRs. Figure 1 shows the SEA (left) and the SPRs (right).
Figure 1. The South-East Australia (SEA) landmass area and the locations of rainfall pluviograph sites (left),
and New South Wales state plan regions (right).
The daily rainfall erosivity model follows that of Lu and Yu (2002) with significant improvements on model
parameters (Yang and Yu 2015). Briefly, the model to estimate the sum of storm’s total kinetic energy and
the peak 30-min (5 x 6-min) intensity (or rainfall erosivity index EI30) values for the month j from daily
rainfall amounts (in unit MJ.mm.ha-1.hr-1.month-1) is based on
∧ N
E j = α [1 + η cos(2πfj − ω )] Rdβ (1)
d =1
where Rd is the daily rainfall amount (mm/day), N is the number of rain days in the month, and α, β, η, and
ω are model parameters. The model assumes a non-linear relationship between daily rainfall amount and
daily rainfall erosivity (EI30) values via the parameter β. For the same amount of rainfall, however, rainfall
erosivity can vary depending on the time of year and the location, especially the latitude and elevation. The
remaining three parameters in Equation (1), namely α, η, and ω, were used in an attempt to capture these
effects in a relatively parsimonious fashion. Details of these parameters and their calculation are presented in
Yang and Yu (2015).
The monthly rainfall erosivity layers produced from Equation (1) were further used to estimate soil erosion
risk (hillslope erosion for bare ground) based on RUSLE (Renard et al. 1997):
A = R × K × LS × C (2)
where A is the predicted potential soil erosion risk (tonnes.ha-1.year-1), R is rainfall erosivity factor, K is the
soil erodibility factor, LS is the slope and steepness factor, C is the cover and management factor (C = 1 for
bare soil). Note that the soil conservation practices (P-factor) were not considered in this work as the relevant
future data are not available. The K-factor was prepared from the great soil group and LS-factor calculated
from DEM-H (Yang 2015). Due to the large quantity of data sets, automated GIS scripts have been
developed to process the daily rainfall data and calculated the time-series monthly and annual rainfall
erosivity and hillslope erosion risk.
Model performance is measured by the coefficient of efficiency, Ec (Nash and Sutcliffe 1970) as:
M M
Ec = 1 − ( yi − yˆ i ) 2 / ( yi − y ) 2 (3)
i =1 i =1
where yi and ŷi are observed and modelled values, respectively; y is the average of observed values, and
M is the sample size. Essentially, Ec is an indicator of how close the scatters of predicted versus actual values
are to the 1:1 line which can be considered as a measure of model efficiency for any other types of models. In
addition, mean relative error (MRE), root mean squared error (RMSE) are also used for accuracy assessment.
1574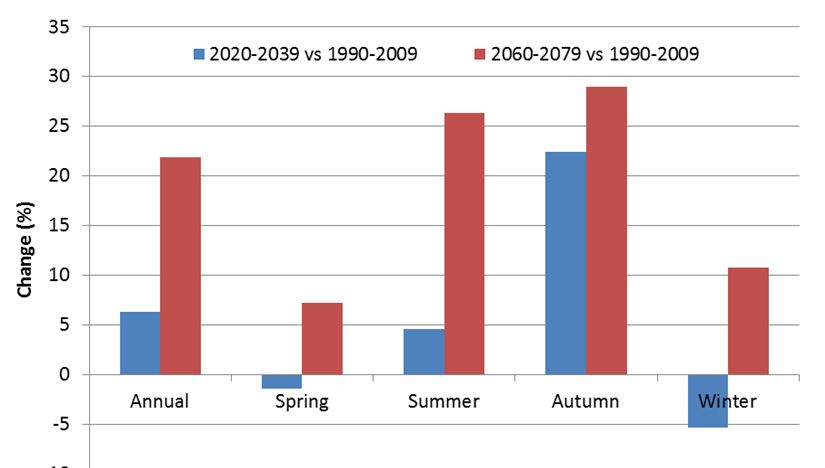
Yang et al., Climate change impacts on rainfall erosivity and hillslope erosion in NSW

3.   RESULTS AND DISCUSSION

     3.1.      GIS Data Layers
Based on the daily rainfall erosivity model as outlined above, we produced monthly and annual rainfall
erosivity GIS layers (total 34,800) for entire NSW and SEA from the daily rainfall data for all 12 NARCliM
essembles and three projection periods (1990–2009, 2020–2039, 2060–2079). Mean annual and seasonal
rainfall erosivity and the changes were further calculated and spatially interpolated into fine spatial resolution
(100 m) using Spline interpolation (Hutchinson 1998). The time-series rainfall erosivity data were further
used to estimate hillslope erosion risk based on RUSLE (Equation 2), and the same sets of erosion risk layers
(monthly and annual) have been produced for the same periods in NSW and SEA, plus spatial interpolation
and calculation of multi-model and seasonal means (same as rainfall erosivity). Figure 2 shows the modelled
mean annual rainfall erosivity and hillslope erosion risk for baseline and future periods.

Figure 2. Modelled mean annual rainfall erosivity (top row) and mean annual hillslope erosion risk (bottom
               row) for baseline (left), near future (middle) and far future (right) periods.

     3.2.      Accuracy Assessment
The GIS modelled mean annual rainfall erosivity values using the NARCliM projected daily rainfall were
compared with those calculated using the gridded daily rainfall data at 5-km spatial resolution from Bureau
of Meteorology (BoM) for the baseline period (1990–2009). The overall Ec for the rainfall erosivity is 0.9753
(R2 = 0.9762), overall bias is 0.9925 suggesting a slight under-estimation, and RMSE is 13.2% or 143
(MJ.mm.ha-1.hr-1.year-1) indicating the relative size of the error bars from the 1:1 line (Figure 3, left). The
seasonal patterns between the NARCliM and BoM data are also similar, both showing high rainfall erosivity
in summer and low in winter (Figure 3, right).

            Figure 3. Comparison of mean annual rainfall erosivity calculated from NARCliM projections and
                         BoM rainfall data (left) and their seasonal variations (right).

                                                    1575
Yang et al., Climate change impacts on rainfall erosivity and hillslope erosion in NSW
3.3. Future Changes in Rainfall Erosivity
Compared with the baseline period (1990–2009), the mean annual rainfall erosivity in NSW is predicted to
increase in the future. State-wide, there is about 7% increase in the near-future period (2020–2039) and about
19% increase in the far future period (2060–2079). Figure 4 shows the percent change (%) of rainfall
erosivity in the near-future and far-future periods across NSW.
90%
Figure 4. The percent change (%) of rainfall erosivity in the near-future period (2020–2039, left) and the far
future period (2060–2079, right) compared with the baseline period (1990–2009).
Future changes for each state plan region in relation to the baseline period are summarised in Table 1.
Changes vary from 1.4% (South East and Tablelands) to 13.8% (Central Coast) in the near future, from
13.9% (Illawarra) to 27.5% (Far West). Higher erosivity is likely in coastal areas in the near future, with
larger increases across the whole state in the far future.
Table 1. Mean annual rainfall erosivity (MJ.mm.ha-1.hr-1.year-1) and their changes across NSW in
the future periods (2020–2039 and 2060–2079).
Near future Far future
Far future
State Plan Region Baseline Near future change (%) change (%)
Far West 598 655 762 9.6 27.5
Murray Murrumbidgee 568 585 665 3.0 17.0
South East and Tablelands 1100 1116 1263 1.4 14.7
Illawarra 2683 2775 3056 3.4 13.9
Central West and Orana 1064 1125 1295 5.8 21.7
New England and North West 1663 1754 2009 5.5 20.8
North Coast 4043 4248 4647 5.1 15.0
Hunter 1736 1923 2074 10.8 19.5
Central Coast 2933 3339 3520 13.8 20.0
Metropolitan Sydney 2075 2293 2523 10.5 21.6
New South Wales 1081 1147 1300 6.9 19.2
3.4. Seasonal Change
Figure 5 shows the modelled mean monthly rainfall erosivity and the seasonal variation in the three periods
from NARCliM projection. The seasonal variation is similar to the pattern of the baseline periods showing
high rainfall erosivity in summer and low in winter, with about 10 times difference between February
(highest) and July (lowest). But the seasonal changes are highly uneven and variable among the 12 member
ensembles. The variations range from -22.2% in spring to 105.3% in autumn for the near future period, and
from -33.7% in winter to 101.2% in autumn for the far future period.
In the near and far future, it’s predicted that the rainfall erosivity will generally increase in all seasons (except
slight decrease in the near future in spring and winter), particularly in autumn with an increase about 22% in
the near future and about 29% in the far future. Rainfall erosivity in summer is also predicted to increase
1576Yang et al., Climate change impacts on rainfall erosivity and hillslope erosion in NSW
significantly, about 5% in the near future and 26% in far future. The information of rainfall erosivity
seasonality can provide critical information for hillslope erosion control and development of best
management practices.
Figure 5. Predicted monthly mean rainfall erosivity (left) and the seasonal change (%) in two future
periods.
The seasonal distribution of rainfall erosivity will have significant impact on hillslope erosion. This implies
that when all other RUSLE factors (including K-factor, LS-factor and C-factor) remain unchanged, the
seasonality of rainfall erosivity alone could cause about 10 times difference in soil loss even if the rainfall
amount and intensity are the same.
Note that the seasonal change is also highly variable across SPRs, ranging from -12% in South East and
Tablelands in winter to 33% in Hunter in autumn in the near future. The far future shows more variation
ranging from -18% in North Coast in winter to 33% in Far West in autumn. In general, NSW Coast is
predicted to experience more change in the next 60 years, in particular Central Coast and North Coast in
winter.
4. CONCLUSION AND FURTHER STUDIES
NARCliM projected daily rainfall data have been used to predict rainfall erosivity and hillslope erosion risk
and their future changes across NSW and SEA. Overall, rainfall erosivity and hillslope erosion risk across
NSW in the near future (2020-2039) are predicted to increase about 7%, and about 19% in the next 50 years.
The change is highly variable in space and in time, and the spatial and temporal patterns provide meaningful
information for climate change assessment and adaptation. Rainfall erosivity and hillslope erosion are mostly
greater in summer than those in other seasons. This suggests that summer (particularly February) is the
critical season for hillslope erosion prevention and management. The 7-19% extra hillslope erosion in the
future for unprotected soil is a serious concern. Review of erosion and sediment control standards for
construction and re-assessment of land management practices may be required for the predicted high risk
areas.
The improved daily rainfall erosivity model performed well and the overall model efficiency (Ec) for
estimated rainfall erosivity values is greater than 0.97 with an overall bias slightly over 1. The set of regional
relationships for model parameters are highly recommended for use for NSW and SEA to estimate and map
rainfall erosivity and its spatial and seasonal distribution.
The model outputs are available at high temporal and spatial resolution for use in climate impacts assessment
and hillslope erosion monitoring for the past, current and future. The time-series rainfall erosivity and
hillslope erosion GIS layers in such a high spatial (100 m) and temporal (monthly to annual) resolution
across SEA are first available in Australia. Baseline rainfall erosivity layers for the period of climate normals
(1961-1990), a recent (1990-2009) and a longer baseline period (1910-2013) have been produced for better
climate change comparisons.
This study has demonstrated an appropriate approach for modelling and mapping monthly and annual rainfall
erosivity from daily rainfall data for SEA which is also readily applicable to other regions. The methods have
been successfully implemented in GIS for efficient calculation and mapping of the spatial and temporal
variation of rainfall erosivity and hillslope erosion across SEA. With the automated GIS process developed in
this study, the erosivity maps and erosion modelling can be readily upgraded when better rainfall data and
models become available. The spatial interpolation greatly enhanced the level of detail which is useful for
assessing erosion hazard and determining the timing of erosion control practices. The time series of high
1577Yang et al., Climate change impacts on rainfall erosivity and hillslope erosion in NSW
resolution rainfall erosivity and hillslope erosion maps can provide detailed information for climate (rainfall)
impact assessment, and cost-effective means for hillslope erosion hazard identification and rehabilitation.
Further work will include examining and predicting the impacts of rainfall extremes on rainfall erosivity and
hillslope erosion as soil erosion happens mostly during a few severe storm or extreme events. These will
provide more useful information for storm impacts on bushfire affected areas so that one can optimise
appropriate remedial activities for individual storm events.
ACKNOWLEDGEMENTS
This project was funded by the NSW Government and managed through the NSW Office of Environment
and Heritage (OEH). Many OEH staff from the Climate Science, Soil Science, and Climate Impacts &
Adaptation programs, contributed to this project and their effort is greatly appreciated. Ian Macadam, Terry
Koen and John Young kindly provided R scripts for easy handling of the modelling outcomes and charts.
Hamish Clark, Yvonne Scorgie and Polly Mitchell reviewed the report and provided useful comments and
suggestions. The NARCliM team from the University of New South Wales provided the bias-corrected
rainfall projections. All the support and assistance are greatly appreciated.
REFERENCES
Evans, J.P., Ji, F., Lee, C., Smith, P., Argüeso, D. and Fita, L. (2014). Design of a regional climate modelling
projection ensemble experiment – NARCliM. Geosci Model Dev, 7(2), 621-629.
Hutchinson, M.F. (1998). Interpolation of rainfall data with thin plate smoothing splines—part I: two
dimensional smoothing of data with short range correlation. Journal of Geographic Information and
Decision Analysis, 2, 139–151.
Lu, H. and Yu, B. (2002). Spatial and seasonal distribution of rainfall erosivity in Australia. Australian
Journal of Soil Research, 40, 887-901.
Lu, H., Prosser, I.P., Moran, C.J., Gallant, J.C., Priestly, G., Stevenson, J.G. (2003). Predicting sheetwash
and rill erosion over Australian continent. Australian Journal of Soil Research, 41(6), 1037–1062.
Nash, J.E. and Sutcliffe, J.V. (1970). River flow forecasting through conceptual models, Part 1: A discussion
of principles. Journal of Hydrology, 10, 282-290.
NSW Rural Fire Services (2006) http://www.rfs.nsw.gov.au/__data/assets/pdf_file/0014/24332/Bush-Fire-
Environmental-Assessment-Code.pdf (accessed 20 July 2015).
Renard, K.G., Foster, G.R., Weesies, G.A., McCool, D.K. and Yoder, D.C. (1997). Predicting hillslope
erosion by water: a guide to conservation planning with the Revised Universal Soil Loss Equation
(RUSLE). Agricultural Handbook, vol. 703. US Department of Agriculture, Washington DC, pp. 1–251.
Rosewell, C.J. and Turner, J.B. (1992). Rainfall erosivity in NSW. CaLM Technical Report No. 20, New
South Wales Department of Conservation and Land Management, Sydney.
Wischmeier, W.H. and Smith, D.D. (1978). Predicting rainfall erosion losses, a guide to conservation
planning. Agricultural Handbook, vol. 537. US Department of Agriculture, Washington, DC. 58 pp.
Yang, X. and Yu, B. (2015). Modelling and mapping rainfall erosivity in New South Wales, Australia. Soil
Research, 53, 178-189.
Yang, X. (2015). Digital mapping of RUSLE slope length and steepness factor across New South Wales. Soil
Research, 53, 216–225.
Yang, X., Yu, B. and Xie, X. (2015). Predicting changes of rainfall erosivity and hillslope erosion risk
across Greater Sydney Region, Australia. International Journal of Geospatial and Environmental
Research (Open access htt://dc.uwm.edu/ijger/vol2/iss1/2).
Yu, B. and Rosewell, C.J. (1996). An assessment of a daily rainfall erosivity model for New South Wales.
Australian Journal of Soil Research, 34, 139-152.
Yu, B. (1998). Rainfall erosivity and its estimation for Australia’s tropics. Australian Journal of Soil
Research, 36, 143-165.
1578You can also read