Mapping of Blackspots Accident Area at North South Expressway to Produce Expressway Advisory System
←
→
Page content transcription
If your browser does not render page correctly, please read the page content below
IOP Conference Series: Materials Science and Engineering

PAPER • OPEN ACCESS

Mapping of Blackspots Accident Area at North South Expressway to
Produce Expressway Advisory System
To cite this article: N S M Mansor et al 2021 IOP Conf. Ser.: Mater. Sci. Eng. 1144 012083

View the article online for updates and enhancements.

                               This content was downloaded from IP address 46.4.80.155 on 19/09/2021 at 06:20
ISCEE 2020                                                                                                               IOP Publishing
IOP Conf. Series: Materials Science and Engineering              1144 (2021) 012083           doi:10.1088/1757-899X/1144/1/012083

Mapping of Blackspots Accident Area at North South
Expressway to Produce Expressway Advisory System

                     N S M Mansor1, M R Mat Yazid1*, N A Abdul Rashid1, A Mohd Taib1 and K
                     Ambak2
                     1
                       Department of Civil Engineering, Faculty of Engineering and Built Environment, Universiti
                     Kebangsaan Malaysia, 43600 Bangi, Selangor.
                     2
                       Smart Driving Research Center, Faculty of Civil Engineering and Built Environment,
                     Universiti Tun Hussein Onn Malaysia, 86400 Batu Pahat, Johor.
                     *Corresponding author: razuhanafi@ukm.edu.my

                     Abstract. The study was carried out to produce an advisory system based on the blackspot
                     accidents mapping at the North-South Expressway (NSE). Blackspots are location where the
                     road traffic crashes have historically concentrated by type of accident in which the accident
                     caused fatalities, severe injuries, minor injuries and damage. This research aims to identify
                     accident blackspot and plotting accident data into a digital map of the study area to produce
                     advisory systems for highway users. The software used in this study namely Google Earth Pro,
                     ArcMap and ArcGIS online. Results showed that blackspot location are known in the form of
                     mapping where it can be performed online. In addition, the path with high number of accident
                     points weightage location were identified and prioritized. By applying Google Earth Pro and
                     ArcGIS software, the advisory system was created, and these blackspot locations can also be
                     easily accessed by highway users. Therefore, the advisory system helps in facilitate the users
                     for trip planning base on the accident status locations as a precautionary measure and initiative
                     to reduce the rate of road accident in expressway.

1. Introduction
This paper will present about an advice system where can locate accident blackspots area along North-
South Expressway (NSE). From this study, people can determine the location of blackspots area. In
this era of globalization, the transportation system has become an important element for a country to
compete with other developed and developing countries. However, the increasing number of vehicles
due to increasing the demand for central business and economic activities [1]. The expressway is a
necessity for the inhabitants of the world as it connects cities with cities and between rural and urban
areas. Furthermore, the scope of this research study covers the entire North-South Expressway with an
overall length of 772 kilometres. The North-South Expressway connects the north and south of the
Malaysian peninsula across eight states connecting major cities to the west of the Malaysian peninsula.
At an altitude of 772 kilometres, the highway is considered the longest highway in Malaysia. The
study area ranges from Bukit Kayu Hitam, Kedah to Johor Bharu, Johor. With the rapid development
of the transportation system, apart from contributing to the positive, it can also contribute to the
negative such as road accidents. Also, there are many factors that affect traffic accident. According to
Soehodho [2], traffic accidents are usually caused by three different types of factors namely human
factors, vehicle factors and external factors including roads. Human factors have the strongest
influence, which is agreed by worldwide country. This can be also attributed to a study by Malaysian
              Content from this work may be used under the terms of the Creative Commons Attribution 3.0 licence. Any further distribution
              of this work must maintain attribution to the author(s) and the title of the work, journal citation and DOI.
Published under licence by IOP Publishing Ltd                          1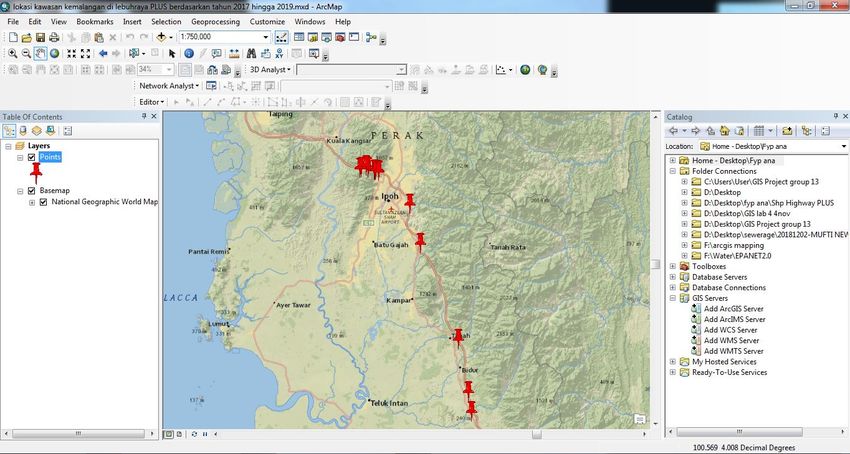
ISCEE 2020                                                                                            IOP Publishing
IOP Conf. Series: Materials Science and Engineering     1144 (2021) 012083       doi:10.1088/1757-899X/1144/1/012083

Institute of Road Safety Research (MIROS) which believes that human negligence is the biggest
contributor leading to 86.0% of accidents in Malaysia [3].
    Shafabakhsh et. al. [4] says generally, road accident statistics have been considered as an index of
evaluation to assess the probability of road traffic accidents. Refer to statistics of road accidents by the
Royal Malaysian Police (PDRM) in 2017 shows in table 1 and figure 1, found over a period of 20
years, from 1997 to 2016, a total of 7,164,210 road accident cases were reported throughout Malaysia
with a total of 128,279 fatal accident cases. From the total number of accidents reported, an average of
358,211 road accidents occur each year while the average road accident rate in the country is 981
cases per day. To be more relevant with this study, accident statistic comparison line graph of
Malaysia and the expressways under the supervision of the PLUS Expressways Berhad are shown in
figure 2. The line graph illustrates the total number of accidents from 2013 to 2018. The lowest
number of accidents happened in PLUS expressways was in 2013 and the number of accidents is
11,052 over 477,204 in Malaysia with the percentage of 2.4%. While the critical point for these six
years was in 2015 with the number of accidents in PLUS expressways is 14,210 over 489,606 in
Malaysia and the percentage is 2.9%. This clearly shows that the number of road accidents in Malaysia
is increasing every year as the network of roads and vehicles increases.

                                     Table 1. Accident statistics in Malaysia.

          Year          Total Road          Road Deaths        Serious Injury   Slight Injury     Damage
                         crashes
          1997           215,632                6,302             14,105          36,167          159,058
          1998           211,037                5,740             12,068          37,896          155,333
          1999           223,166                5,794             10,366          36,777          170,229
          2000           250,429                6,035              9,790          34,375          200,229
          2001           265,175                5,849              8,680          35,944          214,702
          2002           279,711                5,891              8,425          35,236          230,159
          2003           298,653                6,286              9,040          37,415          245,912
          2004           326,815                6,228              9,218          38,645          272,724
          2005           328,264                6,200              9,395          31,417          281,252
          2006           341,252                6,287              9,253          19,885          305,827
          2007           363,319                6,282              9,273          18,444          329,320
          2008           373,071                6,527              8,868          16,879          340,797
          2009           397,330                6,745              8,849          15,823          365,913
          2010           414,421                6,872              7,781          13,616          386,152
          2011           449,040                6,877              6,328          12,365          423,470
          2012            462,423               6,917              5,868          11,654          437,984
          2013            477,204               6,915              4,597           8,388          457,304
          2014            476,196               6,674              4,432           8,598          456,492
          2015            489,606               6,706              4,120           7,432          471,348
          2016            521,466               7,152              4,506           7,415          502,393

                                                           2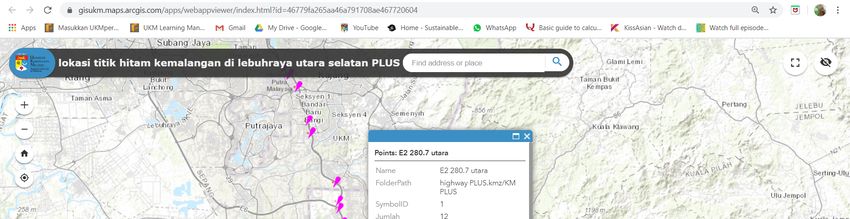
ISCEE 2020 IOP Publishing
IOP Conf. Series: Materials Science and Engineering 1144 (2021) 012083 doi:10.1088/1757-899X/1144/1/012083
521,466
600,000
489,606
Total Road crashes Road Deaths Serious Injury Slight Injury Damage
477,204
476,196
462,423
449,040
414,421
397,330
500,000
373,071
363,319
341,252
328,264
326,815
298,653
Number of accidents
400,000
279,711
265,175
250,429
223,166
215,632
211,037
300,000
200,000
100,000
0
YEARS
Figure 1. Accident statistics in Malaysia.
600,000 20,000
548,598
550,000 533,875 18,000
521,466
489,606
500,000 477,204 476,196 16,000
Total accidents
14,532 14,384
14,210
450,000 13,269 14,000
12,108
400,000 11,052 12,000
350,000 10,000
300,000 8,000
2013 2014 2015 2016
Year 2017 2018
Malaysia PLUS
Figure 2. Accident statistics in Malaysia and NSE.
Accident blackspot or blackspot area is a place with high concentration of accident historical. Wen
Cheng and Simon [5] defined the blackspot as a problematic location of the transport system and
impacted by the frequency of accidents related elsewhere. In other words, accidents can be observed in
both places that are safe and unsafe. In Malaysia, the introduction of blackspots has been practiced
since the early 1990s. The identification process was simplified in 1992 when the Royal Malaysian
Police (PDRM) began using a standard form called POL 27 to collect accident information. In 1998,
guidelines for identifying blackspots and road safety measures were introduced by the Malaysian Road
3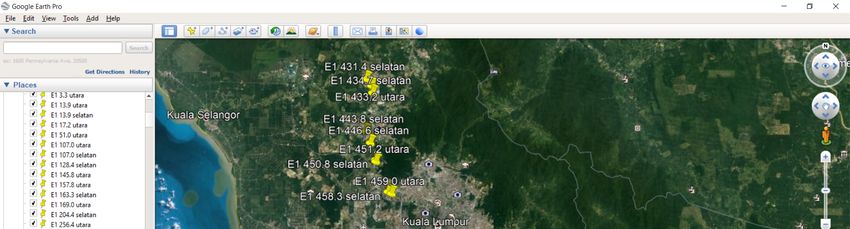
ISCEE 2020                                                                                      IOP Publishing
IOP Conf. Series: Materials Science and Engineering   1144 (2021) 012083   doi:10.1088/1757-899X/1144/1/012083

Engineering Association (REAM) and the Department of Public Works [6]. The guidelines state that
blackspots can be a site, street section or phenomenon throughout the area. The traditional approach
for identifying blackspot locations is to identify sites with higher than average accidents [7].
Therefore, an advisory system has been put in place to facilitate the expressway users. To perform this
advisory system to locate blackspots area along the NSE, researcher using Geographical Information
System (GIS). GIS is a technology for the creation, representation, management, search, analysis and
sharing of geospatial information. GIS manages data in movies called layers. Layers consist of
position information and attribute information.

2. Methodology
The North-South Expressway is divided into two sections E1 and E2 where E1 refers to the northern
route while E2 refers to the southern route [8]. The E1 expressway begins at the Bukit Kayu Hitam
checkpoint in Kedah and ends at Bukit Lanjan in Selangor while the E2 expressway begins at Sungai
Besi checkpoint in Kuala Lumpur and ends at Pandan in Johor Bahru for kilometre Zero (also written
KM 0). The NSE route map of E1 and E2 are shown in figure 3.

                                    Figure 3. North-South Expressway route.

   The Malaysian Highway Authority has given the accident data for all type of vehicles with their
accident severity that is fatalities, severe injuries, minor injuries, and damage only. As such, the data
obtained has been processed in Microsoft Excel and applying ranking by accident point to identify the
location of the blackspots area. According to the Malaysian Highway Authority's annual report in

                                                         4
ISCEE 2020                                                                                      IOP Publishing
IOP Conf. Series: Materials Science and Engineering   1144 (2021) 012083   doi:10.1088/1757-899X/1144/1/012083

2018, blackspots area can be identified by the type of accident in table 2. The total weightage points
above 15 points will be defined as accidents blackspots area.

                           Table 2. Total weightage according to type of accident.

                                  Type of accident                 Point
                                  Fatalities                        6
                                  Severe injuries                   4
                                  Minor injuries                    2
                                  Damage only                       1

    This procedure that required information to provide decision makers in order to prevent and reduce
road accidents. The process by which data obtained from Microsoft Excel is summarized as a point for
all accidental blackspot locations within the Google Earth Pro application based on latitude and
longitude. At this stage, data management is very important because if there is a slight error it will
affect the results of the data. The data will be stored in the file '.kmz' before transferring the data into
the system.
    Google Earth Pro software is created by google company which is a map showing application that
can identify the location directly. The feature of this software is generating live location points and the
image are rasterized in high resolution. From this software, researchers can create files offline and
secure way to share information with other users. Using this software, researchers were able to plot
blackspot accident locations along the NSE. Figure 4 shows display of study area which is located at
North-South Expressway (NSE).

                       Figure 4. The visualization of study area by Google Earth Pro.

   Output and rendering are the ultimate GIS function that enables data to be displayed for reporting
and visualization purposes [9]. Researchers used ArcGIS online where the resulting data can be
displayed in their respective device. ArcGIS software is one of the software developed by the
Environment Science & Research Institute (ESRI) which is a collection of several functions and
various GIS software such as GIS desktop, GIS server, and GIS basicWEB [10]. ArcGIS has 4
application bases namely ArcMap whose function is to map structured maps to create, display, select,
edit, shape, and publish. ArcCatalog is for organizing or organizing analysis data. In addition,

                                                         5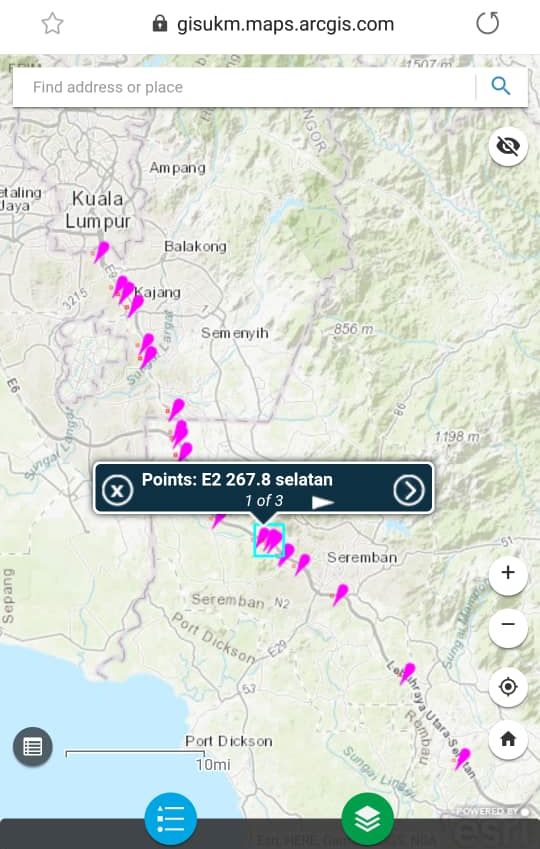
ISCEE 2020                                                                                      IOP Publishing
IOP Conf. Series: Materials Science and Engineering   1144 (2021) 012083   doi:10.1088/1757-899X/1144/1/012083

ArcGlobe is to show 3D maps to the world that can connect to the internet. Next, ArcScene is capable
of processing and displaying maps in 3D. The last application is ArcToolbox, which is a collection of
various tools for analyzing space.
   Using ArcGIS software researchers can arrange the location of the data in this software based on
data provided by the Malaysian Highway Authority. Figure 5 shows display of study area in ArcMap.

                                   Figure 5. Display of study area in ArcMap.

3. Results and discussion
This study only uses blackspot area data to show the historically concentrated of prone areas. The
accident data given by Malaysian Highway Authority are occurred in North-South Expressway from
2017 to 2019. The total number of weightage points for blackspot area for these three years was 2161.
Of these, fatal accidents accounted for 186 points, equivalent to 8.6%, 856 (39.6%) were from serious
accidents, 342 (15.8%) were from minor accidents and 777 (36.0%) were from broken or damage
accidents. The objective of the researcher has been achieved by plotting accident data showing the
blackspot location along the NSE.
    Based on the total number of weightage points from 2017 to 2019, E1 area has the highest total
number of weightage points at kilometres 257 (KM 257.0) to kilometres 443.8 (KM 443.8) for
northwards and at kilometres 399.4 (KM 399.4) to kilometres 460 (KM 460.0) for southwards. At E2,
the highest total number of weightage points at kilometres 250 (KM 250.0) to kilometres 310.1 (KM
310.1) in both directions. This shows highway users to be more careful when dealing with this
blackspot locations route.
    Figure 6 shows the total number of points across three years from 2017 to 2019. For northwards, it
is found that 467 points (21.61%) percent are in E1 and 586 points (27.12%) percent are in E2. While
for southwards, 654 points (30.26%) percent are in the E1 and 454 (21.01%) percent are in the E2.
Thus, the bar chart illustrates that the southward has highest weightage for E1, but it is different for E2
because the highest weightage is northward.

                                                         6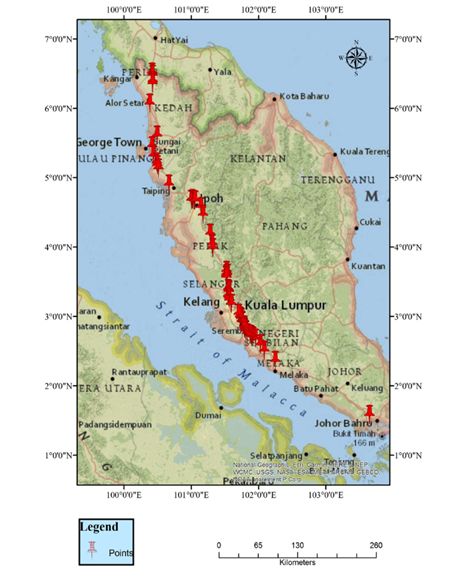
ISCEE 2020                                                                                      IOP Publishing
IOP Conf. Series: Materials Science and Engineering   1144 (2021) 012083   doi:10.1088/1757-899X/1144/1/012083

                                 Figure 6. Total weightage from 2017 to 2019.

                                     Figure 7. Total weightage points at E1.

   Figure 7 shows the total number of weightage points from 2017 to 2019 in kilometre post on the E1
section of the North-South Expressway. It shows that the highest point on the northwards was
KM443.8 (46) points while the number of points on the southwards was KM446.5 (60) points. This
result is in line with Shariff et al [11], where the highest frequency of accidents of E1 section happen
between Tanjung Malim (KM 400) to Bukit Lanjan (KM 460) with highest number of blackspot
locations. This shows that number of accidents influence in number of blackspot locations.
   Figure 8 shows the total number of weightage points based on the years from 2017 to 2019 in
kilometre post on the E2 section of the North-South Expressway. It was found that the highest point on
the northwards was KM296.5 (96) points while the number of points on the southwards was KM267.2
(80) points. This finding also matched with Manap et al [8], where the highest number of accidents
between this locations which normally occurred at interchange, exit ramp, slip road, rest area or lay by
area.

                                                         7
ISCEE 2020 IOP Publishing
IOP Conf. Series: Materials Science and Engineering 1144 (2021) 012083 doi:10.1088/1757-899X/1144/1/012083
Figure 8. Total weightage points at E2.
Table 3. Total weightage at North-South Expressway.
Total weightage Fatal Severe Injury Slightly Injury Broken/damage
2161 186 856 342 777
As shown in table 3, the NSE obtained accident data of 2017 to 2019 has the highest point of
weightage for severe injury of 856 points, followed by 777 points, 342 points and 186 points with
damage, slightly injury and fatal, respectively. Therefore, the severe injury types have the effect of the
density of total weightage points of the NSE.
The figure 9 shows that the findings of this study, where the total number of accidents blackspot
location was 82 locations with 2161 of weightage points. This data has covered up a total of 1194
accidents. The closer the distance of each point showing the critical area of accidents location with the
highest tendency for accidents to happen at the locations.
Output and rendering are the ultimate GIS function that enables data to be displayed for reporting
and visualization purposes. Based on Dereli and Erdogan [12], GIS also used as provision of road
safety especially in determine blackspot of accidents, road defects, and the necessary road
improvements. Researchers use ArcGIS online where the resulting data can be displayed in their
respective device.
This advisory system was created using the ArcGIS online website. The mapping data within
ArcMap must be shared first before it can be uploaded to the ArcGIS online website. After doing some
editing, the maps that researchers produce can be shared with the public. Figure 10 shows the QR code
generated and accessible to the public with a mobile device and other device. Besides, figure 11 and
figure 12 show the displays feature by using monitor and device.
In addition to generating the QR code, researchers also provided a link to display a map of the
blackspot locations of the North-South expressway.
https://gisukm.maps.arcgis.com/apps/webappviewer/index.html?id=46779fa265aa46a791708ae46772
0604
8ISCEE 2020 IOP Publishing
IOP Conf. Series: Materials Science and Engineering 1144 (2021) 012083 doi:10.1088/1757-899X/1144/1/012083
Figure 9. Map of blackspots location.
Figure 10. QR code.
Figure 11. The displays on monitor.
9ISCEE 2020 IOP Publishing
IOP Conf. Series: Materials Science and Engineering 1144 (2021) 012083 doi:10.1088/1757-899X/1144/1/012083
Figure 12. The displays on device
The public can view the accident data and the amount of weightage points by pressing the accident
location. The advisory system can be in ̶ vehicle warning system that improves driver behaviour over
time [13]. Thus, this advisory system helps in facilitate the users for trip planning base on the accident
status locations as a precautionary measure and initiative to reduce the rate of road accident in
expressway.
The organized identification, analysis, and precaution of hazardous blackspot locations are the best
answer in reducing road accident and fatality rates in Malaysia. In order to create a sustainable
transportation system, Malaysia must low in rates and causes due to traffic accidents and fatalities
especially from motor vehicle accidents [14]. Research has shown that identification hazardous road or
blackspot locations by means of the GIS and advisory system approach gives more reliable results for
expressway users.
4. Conclusion
In this study, the GIS system was used to mark the location of the accidents blackspots area along the
North-South Expressway with a length of 772 kilometres. Once the mapping is ready in ArcMap then
the advisory system can be launched through the online ArcGIS website. This advisory system is
accessible to everyone who owns a mobile device and also other device. Therefore, the expressway
users can identify accident blackspot locations.
In addition, the result was found the total number of accident blackspot locations was 82 locations
and a total of 2161 weightage points. This data has a total number of 1194 of accidents. This study
also conclude that the higher frequency of traffic accident is not that mean that area labelled as
blackspots area without considering the accident weightage. Further analysis can be done to determine
the factor that affected accident at blackspots area with labelling the area by density of accidents
weightage.
5. References
[1] Razuhanafi M, Yazid M and Ladim M A 2015 Urban Design and Active-Transport Int. J. Eng.
Adv. Technol. 4 132–5
[2] Soehodho S 2017 Public transportation development and traffic accident prevention in
Indonesia IATSS Res. 40 76–80
[3] JKJR 2019 Road Safety Statistic Book (Malaysia: Road Safety Department of Malaysia) pp 1-34
10ISCEE 2020 IOP Publishing
IOP Conf. Series: Materials Science and Engineering 1144 (2021) 012083 doi:10.1088/1757-899X/1144/1/012083
[4] Shafabakhsh G A, Famili A and Bahadori M S 2017 GIS-based spatial analysis of urban traffic
accidents: Case study in Mashhad, Iran J. Traffic Transp. Eng. (English Ed.) 4 290–9
[5] Cheng W and Washington S P 2005 Experimental evaluation of hotspot identification methods
Accid. Anal. Prev. 37 870–81
[6] Rahim S A S, Marjan J M and Voon W S 2013 Guideline on Accident-Prone Area Identification
for Automated Enforcement System (AES) (Malaysia: Malaysian Institute of Road Safety
Research) pp 1–31
[7] Elvik R 2006 New approach to accident analysis for hazardous road locations, Transp. Res.
Rec. 1953(1) 50–5
[8] Manap N, Borhan M N, Razuhanafi M and Yazid M 2019 Determining spatial patterns of road
accidents at expressway by applying Getis-Ord Gi* spatial statistic Int. J. Recent Technol.
Eng. 8 345–50
[9] Mohammed A, Polys N F and Farrah D 2018 Visualize This: Lessons from the Front-lines of
High Performance Visualization Proc. of PEARC, Pittsburgh,PA USA 1281–4
[10] ESRI 2008 What is ArcGIS 9.3? ArcGIS User's Manual (Redlands California: ESRI Press) pp
130
[11] Shariff S S R, Maad H A, Halim N N A and Derasit Z 2018 Determining hotspots of road
accidents using spatial analysis, Indones. J. Electr. Eng. Comput. Sci. 9 146–51
[12] Dereli M A and Erdogan S 2017 A new model for determining the traffic accident black spots
using GIS-aided spatial statistical methods, Transp. Res. Part A: Policy and Pract. 103 106–
17
[13] Ryder B, Gahr B, Egolf P, Dahlinger A and Wortmann F 2017 Preventing traffic accidents with
in-vehicle decision support systems - The impact of accident hotspot warnings on driver
behaviour, Decis. Support Syst. 99 64–74
[14] Razuhanafi M, Ismail R and Atiq R 2011 The use of non-motorized for sustainable
transportation in Malaysia, Procedia Eng. 20 125–34
Acknowledgement
The authors would like to thank the Malaysian Highway Authority for providing the accident data and
Universiti Kebangsaan Malaysia for their financial support under the grant
FRGS/1/2019/TK08/UKM/02/1.
11You can also read