Cross Section Intervals of Flood Intervals of Flood Inundation Mapping at Ungauged Area
←
→
Page content transcription
If your browser does not render page correctly, please read the page content below
IOP Conference Series: Earth and Environmental Science

PAPER • OPEN ACCESS

Cross Section Intervals of Flood Intervals of Flood Inundation Mapping
at Ungauged Area
To cite this article: Suhaila Hashim et al 2021 IOP Conf. Ser.: Earth Environ. Sci. 620 012003

View the article online for updates and enhancements.

 This content was downloaded from IP address 158.46.185.149 on 11/01/2021 at 01:08
Advanced Geospatial and Surveying Conference IOP Publishing
IOP Conf. Series: Earth and Environmental Science 620 (2021) 012003 doi:10.1088/1755-1315/620/1/012003

Cross Section Intervals of Flood Intervals of Flood Inundation
Mapping at Ungauged Area

 Suhaila Hashim1*, Ernieza Suhana Mokhtar1, Ahmad Ikhwan Abdul Halim1, Wan
 Mohd Naim Wan Mohd2, Nor Aizam Adnan2, Biswajeet Pradhan3

 1
 Faculty of Architecture, Planning & Surveying, Universiti Teknologi MARA, Perlis
 Branch, Arau Campus, 02600 Arau, Perlis, Malaysia
 2
 Faculty of Architecture, Planning & Surveying, Universiti Teknologi MARA, 40450
 Shah Alam, Malaysia
 3
 Centre for Advanced Modelling and Geospatial Information Systems (CAMGIS),
 Faculty of Engineering and IT, University of Technology Sydney, NSW 2007,
 Australia.

 E-mail: suhaila.hashim@gmail.com

 Abstract. Digital Elevation Models (DEMs) are essential to present the continuous surface
 elevation and is used for flood mapping. The use of different cross-section intervals obtained
 from the various spatial resolution of DEMs will affect the flood depth and inundation area
 estimation. Therefore, a comparison study is carried out to investigate the effect of cross-section
 intervals on flood expansion and flood depth which is simulated using one dimensional (1D)
 HEC-RAS model at Padang Terap River, Malaysia. Two digital elevation models (DEMs)
 imageries, Interferometry Synthetic Aperture Radar (IFSAR) and Shuttle Radar Topography
 Mission (SRTM) are used in this study. The result was evaluated using likelihood measures (F-
 statistics, root mean square error (RMSE), and mean absolute error). The findings reveal the
 IFSAR DEM with cross-section interval 50 m has higher F-statistics of 70% on flood inundation
 estimation. By proposing the methodology, flood mapping can be provided accurately by
 considering the error that exist in the Geographical Information System (GIS) spatial context.

1. Introduction
Flood inundation is an overflow of water onto dry land and flood inundation mapping is the area that
would be flooded by a particular flood event [1]. Flood inundation maps serve as an important tool in
decision making related to minimizing losses from flooding. Although the conventional method based
on a ground survey is proved as an accurate approach, this method only covers a small area and consume
high cost and time in data collection and processing phases [2], [3].
 Hydraulic models are used to determine the flood extent at several cross-sections along the river
reach assuming that the estimated extreme flood occurs in the area of interests [4], [5]. Hydraulic models
that are popularly used to forecast river behavior such as Infowork MIKE-11, Soil and Water
Assessment Tool (SWAT) and Hydrologic Engineering Center and River Analysis System (HEC-RAS)
[6]–[9]. Several studies [4], [10], [11] have been implemented by integrating the Geographical
Information System (GIS) and hydraulic modelling, and it is enabled to visualise the flood depth and
 Content from this work may be used under the terms of the Creative Commons Attribution 3.0 licence. Any further distribution
 of this work must maintain attribution to the author(s) and the title of the work, journal citation and DOI.
Published under licence by IOP Publishing Ltd 1
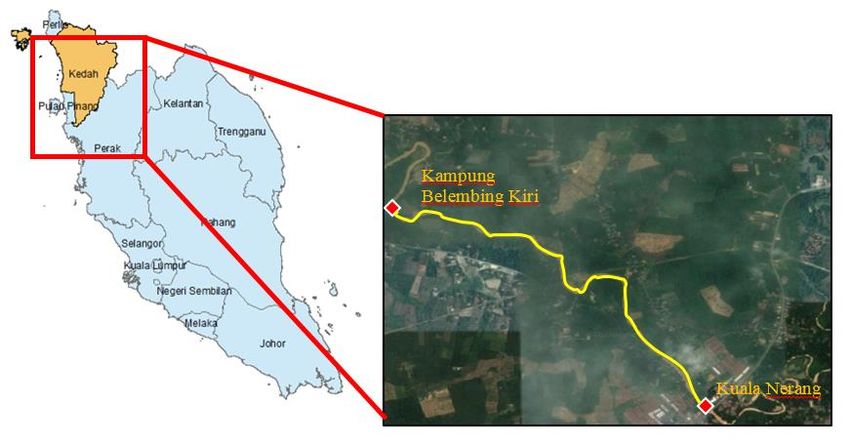
Advanced Geospatial and Surveying Conference IOP Publishing
IOP Conf. Series: Earth and Environmental Science 620 (2021) 012003 doi:10.1088/1755-1315/620/1/012003

water extent by obtaining the relationships between the flood discharge, elevations, and extents with
reasonable accuracy if the process is repeated for numerous flood events [12]. However, data resolution
and accuracy of elevation can affect the hydraulic and hydrologic modelling results [13].
 Cross-section with several intervals is part of the data input for hydraulic modelling, which is
generated from DEM. The cross-section interval of the 1D model have a significant impact on the final
prediction of flood inundation mapping. Earlier research suggested that surveys based on stream cross-
section should have small spacing between cross-sections to provide reliable information for river
channel studies [14]. However, having cross‐section data at finer spacing or at every river meander
(i.e.river bend) and at upstream/downstream of structures (e.g. bridges) will increase the cost of the
topographical surveys. Even though the cross-section is generated from the best available DEM datasets
to identify flood inundation areas, they have varying levels of uncertainties [15]. Among these various
uncertain sources, topography has been reported to be one of the major contributors [16]. A 1-D model
such as HEC-RAS provides water surface elevations only along the individual cross-section. Therefore,
uncertainty can arise in this approach when the water surface elevations at cross-section are interpolated
to create a flood inundation map, because of that it is crucial to determine the suitable cross-section
intervals for hydraulic modelling
 Therefore, the purpose of this research is to determine the suitable cross-section intervals for flood
inundation mapping using low-medium resolution imagery, IFSAR, and Shuttle Radar Topography
Mission (SRTM). This is an essential study to improve the accuracy of flood hazard maps by
determining suitable cross-section intervals on different satellite imageries especially in the ungauged
area.

2. Study Area
The study is focused on the flooded area at Padang Terap River starting from Kuala Nerang Town to
Belimbing Kiri Village with an estimated length of four (4) kilometers with an average elevation of 29
meters (Figure 1). This river consists of water level stations located near to the river at Kuala Nerang
Town. This area is selected due to the overflow water banks from the upstream part, Kuala Nerang to
the downstream area in 2010 and the availability of observed hydraulic parameters that can be applied
for discharge estimation. The flood happened in between October and November 2010 and the
destruction of property and infrastructure that cost of almost RM 17.81 billion [17].

 Figure 1. Location of Padang Terap River, Kedah, Malaysia

 2
Advanced Geospatial and Surveying Conference IOP Publishing
IOP Conf. Series: Earth and Environmental Science 620 (2021) 012003 doi:10.1088/1755-1315/620/1/012003

3. Methodology

3.1. Data used
The first level classified land-use data that consisted of agriculture, bare land, forest, impervious surface,
and waterbody was acquired from the Federal Department of Town and Country Planning Malaysia
(PLAN Malaysia) on a scale of 1:50 000 in 2009. For presenting the surface elevation in this study, the
SRTM and IFSAR were used with a different spatial resolution of 30 m and 5 m respectively. The SRTM
DEM can be assessed freely from United States Geological Survey (USGS) website
(https://earthexplorer.usgs.gov) while NEXTMap Airborne IFSAR DEM which was acquired in January
2009 with 5 meters ground resolution was obtained from INTERMAP Technologies Malaysia. To verify
the flood extent, TerraSAR-X imagery with 12 meters in resolution provided by Malaysia Remote
Sensing Agency (ARSM) and acquired on November 4, 2010, during the flood disaster happened in
Padang Terap was used to delineate the flood inundation area of Padang Terap.

3.2. Hydraulic data
The water level at the telemetry station during a peak flood event on 2 November 2010 obtained from
the Department of Irrigation of Drainage (DID) and surface roughness (Manning-n) are used to predict
the extent of the floods. The discharge value (951.520 m3/s) was estimated using the equation
established by [18] in equation (1). The normal depth boundary condition is computed as S value by the
equation where different elevations upstream and downstream are divided by the length of the river.

 = 7.22 1.02 1.74 0.35 (1)

 where Q = water discharge value, W = width of the river, Y = water depth, and S = channel slope

Furthermore, the historical flood depth was measured using measuring tape based on resident feedback.
River morphology such as river centerline, riverbank, and cross-section line was digitized in Kertau
rectified skew orthomorphic (RSO) coordinate system. The cross-section is generated on selected DEMs
imageries. In the HEC-RAS model, Manning-n is required to present the surface roughness of the river
and floodplain. Each of the land-use types will be assigned with n value which is depending on water
absorption and water flowing into the river and was assigned to the layer of land-use. Table 1 shows the
manning’s value [19] for land-use in the study area.

 Table 1. Manning’s value
 Surface type Manning’ Value
 Cultivated and Brush 0.04
 Bare Land 0.04
 Developed Area 0.176
 Forest 0.15

3.3. Cross-section extraction
HEC-GeoRAS software is used for this purpose. The selection of the cross-section intervals is based on
the try and error process to identify appropriate cross-section interval at the ungauged area. Four
different types of cross-section were extracted on DEMs with interval 5 m (CX5), 50 m (CX50), 100 m
(CX100), and 150 m (CX150) on IFSAR and SRTM DEMs dataset. Figure 2 shows the cross-section
interval used in flood inundation mapping estimation.

3.4. Flood extent and depth verification
The comparison between flood inundation delineated by different cross-section intervals was verified
using TerraSAR imagery. This inundated area can be estimated using F-statistic equation (2) to verify
the estimated value generated by hydraulic models and imagery during the flood event in 2010.

 3
Advanced Geospatial and Surveying Conference IOP Publishing
IOP Conf. Series: Earth and Environmental Science 620 (2021) 012003 doi:10.1088/1755-1315/620/1/012003

 = + + (2)

where A = area both observed and predicted as inundated, B = area of inundation present in model but
absent in observation and C = area of inundation present in observation but absent in model. The flood
depth was verified using four measured history flood depth that measured by tape at affected location
in 2010.

 Figure 2. Cross-Section Extraction with different intervals

4. Comparing Water Extent and Flood Depth using Different Cross-section Intervals on
 IFSAR and SRTM DEMs

4.1. Estimation of water extent using different DEMs dataset and various cross-section intervals
Figure 3 shows the simulated flood extent maps obtained from different cross-section interval of SRTM
and IFSAR DEMs (CX5, CX50, CX100, and CX150). The floodplain was simulated by the HEC-RAS
model and the cross-section was delineated on images of SRTM and IFSAR DEMs with the spatial
resolution is 30 and 5 m respectively. The comparison is based on the F-statistic calculated in between
IFSAR and SRTM DEM. Figure 4 presents IFSAR DEM had the highest value of F-statistic in every
cross-section interval as compared to SRTM DEM. The IFSAR DEM delineate estimated flood extent
much better than SRTM DEM, in which the range is 0.66 – 0.70 and 0.24 – 0.26 respectively. The higher
and lowest F-statistic of flood inundation comparison using IFSAR DEM is CX50 (0.70) and CX5
(0.66).

 4
Advanced Geospatial and Surveying Conference IOP Publishing
IOP Conf. Series: Earth and Environmental Science 620 (2021) 012003 doi:10.1088/1755-1315/620/1/012003

 IFSAR DEM cross-section 5 meter SRTM DEM cross-section 30 meter

 IFSAR DEM cross-section 50 meter SRTM DEM cross-section 50 meter

 IFSAR DEM cross-section 100 meter SRTM DEM cross-section 100 meter

 IFSAR DEM cross-section 150 meter SRTM DEM cross-section 150 meter

 Figure 3. Flood inundation patterns from different cross-section interval between IFSAR and SRTM
 DEMs

 5
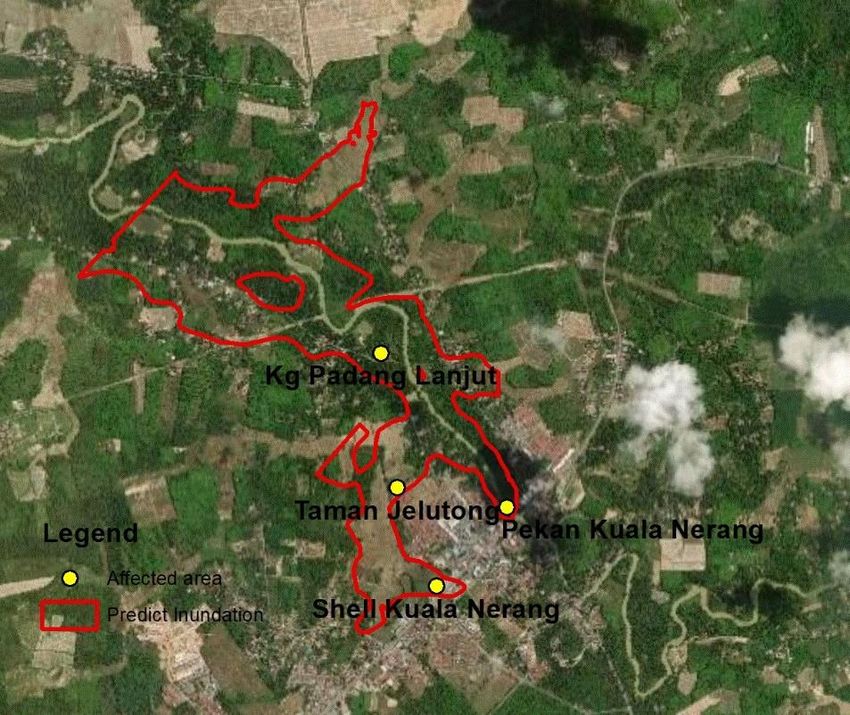
Advanced Geospatial and Surveying Conference IOP Publishing
IOP Conf. Series: Earth and Environmental Science 620 (2021) 012003 doi:10.1088/1755-1315/620/1/012003

 F-Statitic of Flood Extent between IFSAR and SRTM DEMs
 on cross section interval
 0.70 0.68 0.69
 70 0.66

 60

 50
 F-Statistic

 40

 30 0.26 0.25 0.24 0.24
 20

 10

 0
 CX 5 CX 50 CX 100 CX 150
 Cross Section

 IFSAR 5 Meter SRTM 30 Meter

 Figure 4. Comparison F-Statistic Value of Flood Extent between IFSAR and SRTM DEMs

In contradict, the F-statistic using the SRTM DEM is lowest as compared to the IFSAR DEM and was
not well predicted for the flood inundation. Although the value of F statistic low, it is still significant for
the area that medium resolution image is inaccessible. The flood inundation delineated from SRTM
DEM showed rough surface pattern where the predicted flooding area is not smoothly representing the
water body due to the low-resolution dataset (Figure 2).

4.2. Estimation Flood Depth using Different DEMs and Various Cross-Section Interval
4.2.1 IFSAR DEM
Figure 5 shows flood marks of observed flood depth that happened in 2010 which is located at Kampung
Padang Lanjut, Taman Jelutong, Shell Kuala Nerang, and Pekan Kuala Nerang for verification of the
flood depth. Table 2 shows the root mean square error (RMSE) and mean absolute error (MAE) between
water depths estimated by the HEC-RAS model and flood marks measured by tape. The flood marks
that had been selected are located at Kampung Padang Lanjut, Taman Jelutong, Pekan Kuala Nerang,
and Shell Kuala Nerang. The CX5 cross-section interval presents the lowest RMSE and MAE with the
value are 0.251 and 0.131 and the highest value is cross-section interval CX150 with 0.365 (RMSE) and
0.274 (MAE). The result showed that as the cross-section interval spacing increased, the RMSE and
MAE also rises. Therefore, went the cross-spacing is close to each other such as CX5 it would produce
the data more accurately and detail. While went the cross-spacing is interval higher such as CX150, it
would be missing some data in interpolating of water depth that’s make an error.
 The difference between observed and predicted water depth is quite highest at Pekan Kuala Nerang
location for all simulated flood depth in different cross-section interval. The result happened caused by
the sub-tributary river, where two three (3) rivers of Padang Terap, Ahning, and Pedu Rivers were
intersected in the area. To have a better result, the three rivers must be considered in the modeling.

 6
Advanced Geospatial and Surveying Conference IOP Publishing
IOP Conf. Series: Earth and Environmental Science 620 (2021) 012003 doi:10.1088/1755-1315/620/1/012003

 Figure 5. Location of flood marks observe on predict inundation area of IFSAR DEM
 Image Source: ESRI, Digital Globe

Table 2. The difference between water depth observed from flood marks and water depth predicted by
 HEC-RAS using IFSAR DEM

 DEM CX Place Wdo Wdp DIFF RMSE MAE
 IFSAR CX5 Kampung Padang 1.219 1.204 0.015 0.251 0.131
 Lanjut
 Taman Jelutong 1.800 1.792 0.008
 Pekan Kuala Nerang 3.000 2.499 0.501
 Shell Kuala Nerang 1.200 1.199 0.001
 CX50 Kampung Padang 1.219 1.113 0.106 0.305 0.220
 Lanjut
 Taman Jelutong 1.800 1.713 0.087
 Pekan Kuala Nerang 3.000 2.415 0.585
 Shell Kuala Nerang 1.200 1.099 0.101
 CX100 Kampung Padang 1.219 1.091 0.128 0.327 0.240
 Lanjut
 Taman Jelutong 1.800 1.692 0.108
 Pekan Kuala Nerang 3.000 2.377 0.623
 Shell Kuala Nerang 1.200 1.098 0.102
 CX150 Kampung Padang 1.219 1.043 0.177 0.365 0.274
 Lanjut
 Taman Jelutong 1.800 1.672 0.128
 Pekan Kuala Nerang 3.000 2.312 0.689
 Shell Kuala Nerang 1.200 1.097 0.103
Notes: Water depth observation (Wdo), water depth predicted (Wdp)

 7
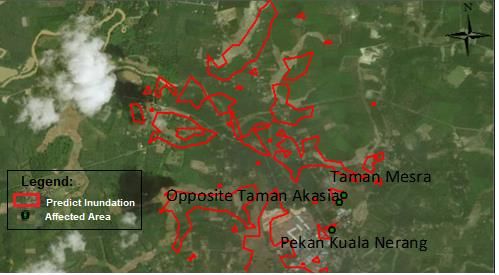
Advanced Geospatial and Surveying Conference IOP Publishing
IOP Conf. Series: Earth and Environmental Science 620 (2021) 012003 doi:10.1088/1755-1315/620/1/012003

4.2.2 SRTM DEM
Figure 6 shows flood marks of observe flood depth that can be compare with flood depth predicted of
SRTM DEM which located at Taman Mesra, Opposite Taman Akasia and Pekan Kuala Nerang.

 Figure 6. Location of flood marks observe on inundation area of SRTM DEM
 Image Source: ESRI, Digital Globe

Table 3 presents the CX5 cross-section interval are the least value of RMSE and MAE are with the value
are 1.065 and 0.887 respectively. The highest value of RMSE and MAE is the cross-section interval is
CX150 with a value of 1.747 and 1.401. From the result, it shows that as the cross-section interval
spacing increase the value of RMSE and MAE also increases. The water depth prediction by SRTM was
underestimated due to the low resolution of the DEM.

Table 3. The difference between water depth observed from flood marks and water depth predicted by
 HEC-RAS using SRTM DEM

 DEM CX Place Wdo Wdp DIFF RMSE MAE
 SRTM CX5 Taman Mesra 0.610 0.229 0.380 1.065 0.877
 Opposite Taman 1.200 0.676 0.524
 Akasia
 Pekan Kuala Nerang 3.000 1.272 1.728
 CX50 Taman Mesra 0.610 0.155 0.455 1.309 1.087
 Opposite Taman 1.200 0.501 0.699
 Akasia
 Pekan Kuala Nerang 3.000 0.892 2.108
 CX100 Taman Mesra 0.610 0.052 0.558 1.421 1.187
 Opposite Taman 1.200 0.487 0.713
 Akasia
 Pekan Kuala Nerang 3.000 0.711 2.289
 CX150 Taman Mesra 0.610 0.031 0.579 1.747 1.401
 Opposite Taman 1.200 0.451 0.749
 Akasia
 Pekan Kuala Nerang 3.000 0.126 2.874
Notes: Water depth observation (Wdo), water depth predicted (Wdp)

 8
Advanced Geospatial and Surveying Conference IOP Publishing
IOP Conf. Series: Earth and Environmental Science 620 (2021) 012003 doi:10.1088/1755-1315/620/1/012003

The CX5 cross-section interval presents lowest the RMSE and MAE from both imageries (IFSAR and
SRTM DEMs). This finding is consistent with [19] who stated that the MAE increase as the spacing
increase. It means that, the CX5 is appropriate for flood depth estimation using integration of hydraulic
modelling and GIS technique. Although the F-statistic of CX5 was underestimated as compared to the
other cross-section interval for inundated area estimation, the result is still acceptable as the value is
almost closest to the other cross-section intervals.

5. Conclusion
This paper shows that increasing the number of cross-section spacing gave a minor difference in terms
of inundated area and flood depth estimation. So, it can be concluded that the smallest interval of cross-
section, the better result can be gained on flood inundation mapping study. When the DEM dataset has
low resolution, the big size of pixels will affect the water surface profile and produce inaccurate flood
inundation. The coarser resolution in cross-section spacing would decrease the efficiency of hydraulic
model in flood inundation [20]. Therefore, a study on optimizing the use of SRTM in flood inundation
mapping needs further research investigation to make sure that it can be well used for ungauged station.
This research suggests CX5 as suitable cross-section spacing for any of the research related to the flood
inundation mapping.

References
[1] J. Sanyal, “Flood Prediction and Mitigation in Data-Sparse Environments,” Durham University,
 2013.
[2] M. Borga, E. N. Anagnostou, G. Blöschl, and J. D. Creutin, “Flash flood forecasting, warning
 and risk management: The HYDRATE project,” Environ. Sci. Policy, vol. 14, no. 7, pp. 834–
 844, 2011, doi: 10.1016/j.envsci.2011.05.017.
[3] J. D. Paine and W. E. Watt, “Flood Risk Mapping in Canada: 2. Compatible Mapping,” Can.
 Water Resour. J., vol. 17, no. 2, pp. 139–148, 1992, doi: 10.4296/cwrj1702139.
[4] B. F. Sanders, “Evaluation of on-line DEMs for flood inundation modeling,” Adv. Water Resour.,
 vol. 30, no. 8, pp. 1831–1843, Aug. 2007, doi: 10.1016/j.advwatres.2007.02.005.
[5] R. Tripathi, S. Krishnan, A. Patra, H. Chang, and I. W. Jung, “Climate change, urban
 development, and community perception of an extreme flood: A case study of Vernonia,
 Oregon, USA,” Appl. Geogr., vol. 46, pp. 137–146, 2014, doi: 10.1016/j.apgeog.2013.11.007.
[6] T. J. Baker and S. N. Miller, “Using the Soil and Water Assessment Tool (SWAT) to assess land
 use impact on water resources in an East African watershed,” J. Hydrol., vol. 486, pp. 100–
 111, 2013, doi: 10.1016/j.jhydrol.2013.01.041.
[7] G. S. Getahun YS, “Flood Hazard Assessment and Mapping of Flood Inundation Area of the
 Awash River Basin in Ethiopia using GIS and HEC-GeoRAS/HEC-RAS Model,” J. Civ.
 Environ. Eng., vol. 05, no. 04, 2015, doi: 10.4172/2165-784X.1000179.
[8] M. H. Hussin, “Flood Estimation and River Analysis,” Flood Estim. River Anal. Sungai Isap,
 Kuantan, no. November, p. 24, 2010.
[9] L. Reuterwall and H. Thorén, “Identification of flood risk areas in an open storm- water system
 with MIKE URBAN – Senai Town, Malaysia,” 2009.
[10] W. Wang, X. Yang, and T. Yao, “Evaluation of ASTER GDEM and SRTM and their suitability
 in hydraulic modelling of a glacial lake outburst flood in southeast Tibet,” Hydrol. Process.,
 vol. 26, no. 2, pp. 213–225, 2012, doi: 10.1002/hyp.8127.
[11] S. J. Baishya and D. Sahariah, “Application of Remote Sensing and GIS for Flood Hazard
 Mapping : A Case Study at Baralia-Nona River Basin ,” vol. 5, no. 3, pp. 58–70, 2017.
[12] M. K. Mersel, L. C. Smith, K. M. Andreadis, and M. T. Durand, “Estimation of river depth from
 remotely sensed hydraulic relationships,” Water Resour. Res., vol. 49, no. 6, pp. 3165–3179,
 2013, doi: 10.1002/wrcr.20176.
[13] S. Saksena and V. Merwade, “Incorporating the effect of DEM resolution and accuracy for
 improved flood inundation mapping,” J. Hydrol., vol. 530, pp. 180–194, 2015, doi:

 9
Advanced Geospatial and Surveying Conference IOP Publishing
IOP Conf. Series: Earth and Environmental Science 620 (2021) 012003 doi:10.1088/1755-1315/620/1/012003

 10.1016/j.jhydrol.2015.09.069.
[14] J. A. Milne and D. A. Sear, “Modelling river channel topography using GIS,” Int. J. Geogr. Inf.
 Sci., vol. 11, no. 5, pp. 499–519, 1997, doi: 10.1080/136588197242275.
[15] M. Vojtek, A. Petroselli, J. Vojteková, and S. Asgharinia, “Flood inundation mapping in small
 and ungauged basins: sensitivity analysis using the EBA4SUB and HEC-RAS modeling
 approach Matej Vojtek, Andrea Petroselli, Jana Vojteková and Shahla Asgharinia,” Hydrol.
 Res., vol. 50, no. 9, pp. 1002–1019, 2019, doi: 10.2166/nh.2019.163.
[16] A. Cook and V. Merwade, “Effect of topographic data, geometric configuration and modeling
 approach on flood inundation mapping,” J. Hydrol., vol. 377, no. 1–2, pp. 131–142, Oct. 2009,
 doi: 10.1016/j.jhydrol.2009.08.015.
[17] DID, “Ringkasan Laporan Banjir Tahunan Bagi Tahun 2011/2012,” Malaysia, 2012.
[18] D. M. Bjerklie, “Estimating the bankfull velocity and discharge for rivers using remotely sensed
 river morphology information,” J. Hydrol., vol. 341, no. 3–4, pp. 144–155, 2007, doi:
 10.1016/j.jhydrol.2007.04.011.
[19] A. Castellarin, G. Di Baldassarre, P. D. Bates, and A. Brath, “Optimal Cross-Sectional Spacing
 in Preissmann Scheme 1D Hydrodynamic Models,” J. Hydraul. Eng., vol. 135, no. 2, pp. 96–
 105, 2009, doi: 10.1061/(ASCE)0733-9429(2009)135:2(96).
[20] F. Geravand, S. M. Hosseini, and B. Ataie-Ashtiani, “Influence of river cross-section data
 resolution on flood inundation modeling: Case study of Kashkan river basin in western Iran,”
 J. Hydrol., vol. 584, no. December 2019, p. 124743, 2020, doi:
 10.1016/j.jhydrol.2020.124743.

 10
You can also read