CHELTENHAM FLOODING - THE NEXT STEP IN AN INTEGRATED APPROACH
←
→
Page content transcription
If your browser does not render page correctly, please read the page content below

CHELTENHAM FLOODING – THE NEXT STEP IN AN INTEGRATED
                   APPROACH

                                   Jack Pickering and Richard Allitt
                       Richard Allitt Associates Ltd, Haywards Heath, West Sussex, UK
                          Jack.pickering@raaltd.co.uk; Richard.allitt@raaltd.co.uk

                                                   Abstract
This is a case study setting out our experiences of using the latest commercially available software (InfoWorks
ICM) for fully integrated coupled 1D-2D hydraulic modelling of all the flooding mechanisms in a large, complex
catchment. The July 2007 flooding in Cheltenham presents a complex flooding scenario, exploiting the majority
of the ICM modelling tools. There are 3 Main Rivers including the largest, the River Chelt flowing within the
urban catchment and the river reaches are made up of culverted and open channel sections. Extensive fluvial,
pluvial and sewer flooding occurred due to two successive storms, with ~1 in 80yr and 1 in 125yr return periods
respectively. This paper will examine how all the different aspects in the catchment have been modelled, with
particular emphasis on how the interfaces between the major (rivers) and minor (below ground) systems have
been modelled, and how 1D and 2D elements have been coupled. The paper will conclude with a summary of
our experiences with InfoWorks ICM.

Keywords
Hydraulic Modelling, 1D-2D coupling, integrated modelling

1. INTRODUCTION
Cheltenham is situated between the Cotswolds and the River Severn (Figure 1). The urban area covers
approximately 47 km2 and has relatively flat topography, with gentle slopes adjacent to either side of the Main
Rivers. The 3 Main Rivers (the Wymans Brook, the Hatherley Brook, the River Chelt) and several tributaries
flow through the urban area. The topography of the tributaries and the upper reaches of the rivers is much steeper
flowing from the escarpment of the Cotswold Hills. Approximately 2 km upstream of the urban boundary, the
Environment Agency owned Dowdeswell Reservoir provides flood storage with active control of the discharge
into the River Chelt.

Figure 1. Map illustrating Cheltenham region. Rivers are marked in blue, red outline indicates the catchment.

In June and July 2007, two large flood events occurred in Cheltenham with 82.6 mm and 129.6 mm rainfall
respectively (approximately 1 in 80 year and 1 in 125 year return periods). The July event caused 677 properties
to experience significant internal and external flooding.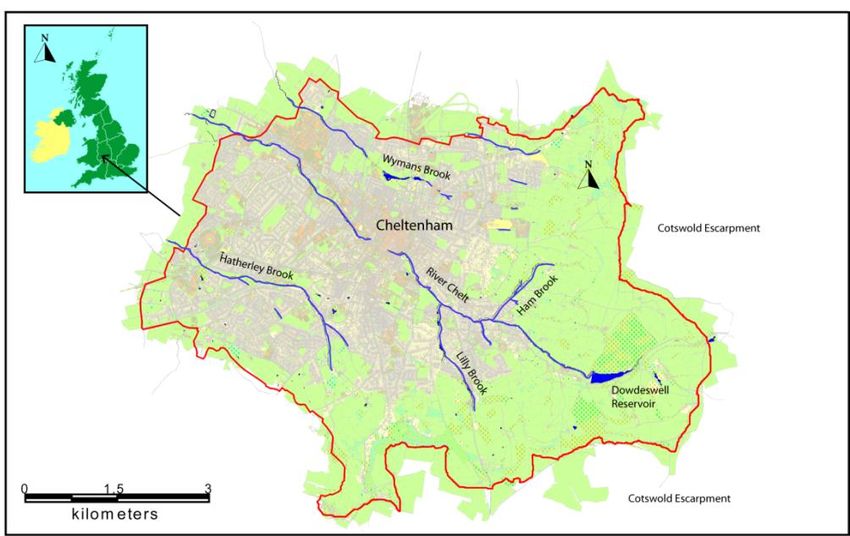
In line with recent legislation changes, Gloucestershire County Council has become the Lead Local Flood
Authority, with a responsibility for the management of local flood risk (e.g. from surface runoff, ordinary
watercourses and groundwater). In order to identify and better understand all the flooding mechanisms they
commissioned a Surface Water Management Plan (SWMP) in Cheltenham, which has been identified as an area
in Gloucestershire which is highly vulnerable to surface water flooding. In the past the modelling would have
been done by using a variety of modelling software to separately model the rivers, the sewers and any pluvial
runoff. There have previously been programs available which could model up to two of these aspects well but
none which could model all 3 aspects, and especially not in a fully coupled manner. The InfoWorks ICM
program has enabled for the first time all of these aspects to be modelled in a fully integrated manner.

This paper will examine how all of the different aspects have been modelled with particular emphasis on how the
interfaces between the Major (rivers) and Minor (below ground) systems have been modelled, and how the 1D
elements have been coupled with the 2D elements. The different hydrological inputs to the model will also be
explained.

2. THE SURFACE WATER MANAGEMENT PLAN
Sir Michael Pitt’s review of the 2007 floods [1] recommended that SWMP’s should be adopted, particularly in
high-risk areas. Recommendation 18 states: “Local Surface Water Management Plans, as set out in PPS25 and
coordinated by local authorities, should provide the basis for managing all local flood risk”. Recent government
policy development has promoted the production of surface water management plans (SWMPs) in response to
the Pitt Review [2]. The main role of SWMPs is to identify causes of flooding in urban areas, where mechanisms
are complex and unclear, and to inform planning decisions for new development, for flood alleviation and
residential/commercial development. SWMP development is complex and requires using both sewer networks
and surface water networks in developing a model.

SWMPs are led by the Lead Local Flood Authority in partnership with other key stakeholders such as the
sewerage undertakers and the Environment Agency. Modelling is an important component in the development of
an SWMP, and historically it has been approached in a couple of ways.

3. HISTORICAL MODELLING
Hydraulic modelling relies heavily on accuracy as being of paramount importance, as historical events are often
required to be recreated to verify the model so that a catchments response can be analysed. Both 1D and 2D
elements exist simultaneously, as water can been seen to flow along a channel or through a pipe (1D) and over
the surface (2D). There has been much development and there continues to be more as the interaction between
1D and 2D elements is becoming increasingly more sophisticated within hydraulic modelling.

In the past, this 1D-2D interaction or ‘coupling’ has been represented differently in sewer models and river
models. In sewer models the manholes are modelled as nodes which can be used to couple the 1D flows in the
pipes to the 2D flows on the surface. This therefore represents ‘point’ coupling. River models by contrast use a
‘linear’ coupling at the top of the bank with the in-channel flows modelled in 1D coupled to the 2D flows across
the flood plain.

There are also important differences in terms of hydrology; in sewer models the hydrology has a strong urban
bias with the different surface types within individual sub-catchments used to create the flows into most
manholes within the modelled network. This may result in several thousand individual inputs into a large sewer
model. River models have historically been predominantly used in rural areas with a very limited number of
inputs at locations selected by the modeller and frequently even very long river models have only had a small
number of hydrological inputs. This has been recognised as a significant problem when using river models to
model urban rivers which have direct inflows as well as numerous inflows from surface water sewers
discharging into the rivers.

Therefore in the past there has been no ideal method of modelling complex urban catchments such as
Cheltenham. River models could not adequately simulate the sewer network or the hydrological inputs from the
sewer networks. Sewer models could satisfactorily model the sewer networks but would struggle with modelling
the rivers adequately.
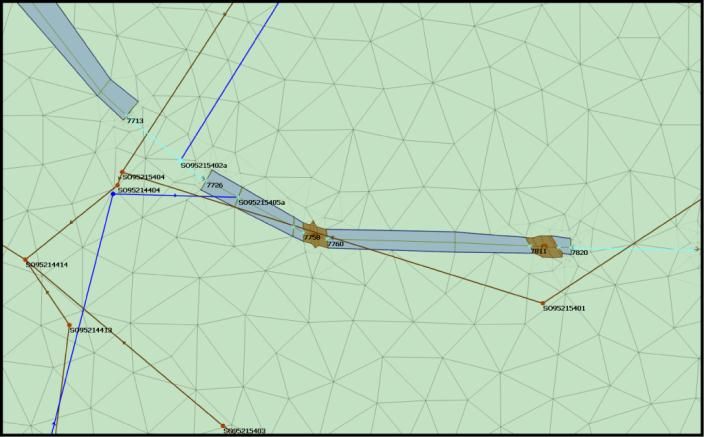
4. INNOVATIVE MODELLING
InfoWorks ICM, developed by Innovyze, takes the best parts of sewer modelling programs and the best parts of
river modelling programs and combines them into a single modelling program. InfoWorks ICM can model the
sewer network as well as or better than most sewer modelling programs and can also model the rivers and
hydraulic structures along the rivers. InfoWorks ICM can either be used in 1D mode or in fully coupled 1D-2D
mode with both ‘point’ coupling at manholes and ‘linear’ coupling along the left and right river banks.

The hydrological inputs for InfoWorks ICM can be the same as those for a sewer model or for a river model with
the added advantage that direct rainfall runoff from the 2D surface can add a third dimension to the hydrology.

The 2D mesh created in InfoWorks is an irregular triangular mesh which has significant advantages in dense
urban areas and when coupling with urban watercourses. The 2D mesh is composed of triangles, each possessing
3 points of elevation. The triangle then represents the average elevation between the 3 points. When a 2D mesh
covers an area, the elevation changes are represented, so water can then flow over and follow the topographically
lowest route through the mesh. The irregular nature of the mesh allows creation around complex building shapes
and along narrow passages between buildings. The 2D mesh abuts the river reaches allowing full coupling
between the 1D channel and the 2D surface and effectively the river banks are sub-divided into a series of short
sections corresponding to the individual triangles. This method takes a completely integrated approach, by using
a 1D-2D coupling mechanism to link surface watercourses and below ground water systems. InfoWorks ICM
therefore represents a step change in hydraulic modelling in urban areas.

Figure 2. illustrates the 2D mesh made up of triangles. The river reach is displayed in blue, bridges in brown and
culverts as a light blue line. The blue line represents the storm sewer network, the brown line the foul sewers.

5. ADVANTAGES OF INTEGRATED URBAN DRAINAGE
Integrated Urban Drainage (IUD) modelling combines all conveyance systems within an urban area (sewers,
watercourses, buildings, bridges, culverts etc), and incorporates them into a single model which interactively
simulates conveyance between all components. The main advantage of the integrated approach that InfoWorks
ICM can provide is the ability to simulate all of the hydrological and hydraulic processes (fluvial, pluvial, sewer,
groundwater) in a single model, and have the ability to run very large fully integrated models. Because this
approach simulates all the processes, it is now possible to understand the dominant flooding mechanism at any
location and once the mechanism is known, the risk of flooding can be established and flood alleviation solutions
can be tailored to the flooding mechanism. The other advantage of IUD modelling is that when potential
solutions to alleviate flooding are modelled the model simulations will reveal whether the solutions create any
other unintended consequences which may be caused by allowing other flooding mechanisms to become
dominant.
6. INTEGRATED MODELLING IN CHELTENHAM
The InfoWorks ICM package was used by Richard Allitt Associates Ltd (as sub-consultants to Halcrow) to
complete the modelling for the Cheltenham SWMP for Gloucestershire County Council. Previous ISIS models
of some of the ‘Main Rivers’ in Cheltenham were used as the starting point for the InfoWorks ICM model and
were added to by incorporation of a verified InfoWorks CS model of the sewer networks. The main difficulty
with the ISIS models is that they had a simplified representation of the river reaches with relatively infrequent
cross-sections and straight lines in between. However, in practice the rivers meandered considerably with many
houses built close to the river banks and it was necessary to add considerably more cross-sections to the
modelled rivers in order to adequately model the alignment of the rivers. The other difficulty was that the way in
which bridges are modelled in ISIS is different from the way in which they are modelled in InfoWorks ICM;
therefore all of the bridges needed to be re-entered into the model.

Some bridges and culverts (especially on the Ordinary watercourses) had not previously been modelled and these
were built into the model from survey data. Also some surface water sewers had not been previously modelled
and these were added to the model using data supplied by Severn Trent Water. In order to connect the sewers
with the watercourses (where surface water sewers or CSO’s discharge into the watercourses) break nodes were
added which divided the river reaches and computationally connected the sewers to the river reaches to allow
full interaction. The Cheltenham model was at the time (and remains at the time of publication) the largest ICM
model built. It contains 12,290 manholes, 534 km of sewers, 324 river reaches, 699 break nodes, 147 surface
water sewer outfalls connecting to river reaches, 114 culverts, 62 bridges and 3,166 ha of 2D simulation zone.

6.1 Catchment Modelling
The base (intermediate) model was built to run the historical rainfall events of June and July 2007. This was
done by using recorded rainfall data as the rainfall input in the simulation. This was also combined with an
inflow event group. The inflow event group represented the rural runoff from the catchments draining into the
rivers at the boundaries of the urban area. In order to produce the most accurate representation that matched
observed level data in the rivers, a Flood Estimation Handbook (FEH) inflow was used. This was done by
generating inflow hydrographs in InfoWorks RS, a piece of software designed for river modelling only (Figure
3). Inflow hydrographs are generated from the observed rainfall data, using a number of coefficients, the most
important being the SPRHOST factor (Percentage Runoff), which determines the saturation of the catchments
before rainfall is applied.

Figure 3. The graph shows an example inflow hydrograph calculated in InfoWorks RS and imported into
InfoWorks ICM.

The inflow hydrographs are assigned to a node at the head of each river system, at the urban boundary. These
nodes are usually immediately outside of the 2D boundary. The 2D boundary was defined at the beginning of the
study and within this boundary (with the exception of the area of the river reaches) 2D modelling was
undertaken. To create the pluvial runoff from large permeable areas within the urban area such as school playing
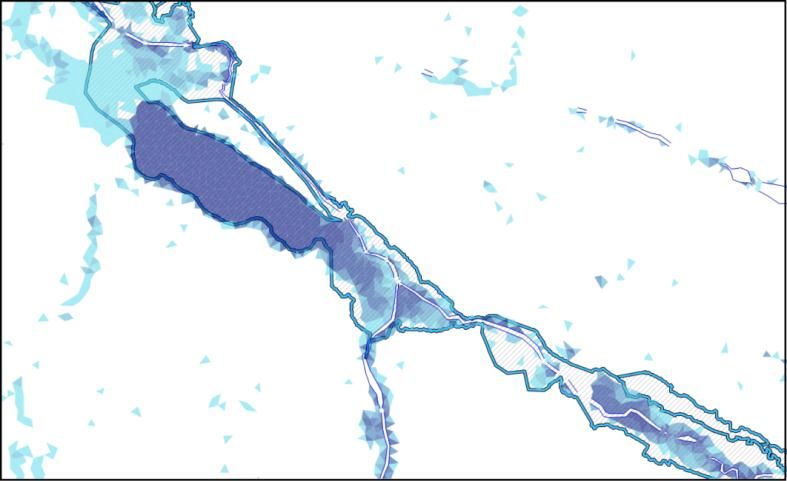
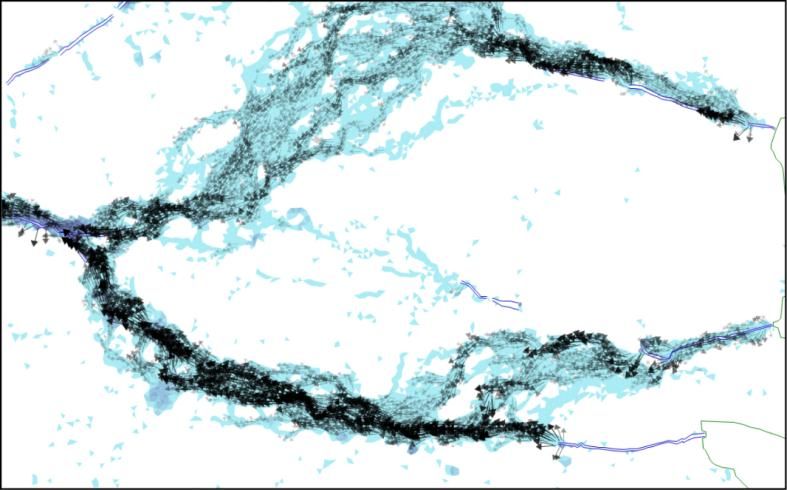
fields, rainfall was applied to the 2D mesh; this required a special rainfall profile which was factored down to
allow for the SPRHOST values of these areas.

When the intermediate model had been run, the results were compared to historical data. There was a limited
amount of depth gauging records for some rivers but the main source of historical information was the flooding
records and the Environment Agency’s recorded WRAC marks (a boundary marked by the extent that debris was
moved to by flood waters). This comparison was used to ‘verify’ the model (see Fig 4) in order to achieve
confidence that the model was satisfactorily simulating all of the hydrological and hydraulic processes. Once the
intermediate model had been verified a series of synthetic design storms were simulated and a review of the
results identified a number of higher risk areas; these areas were then taken forward for detailed modelling.

Fig 4. Image illustrates the simulated flooding results compared with the blue WRAC mark lines. Light blue
represent -0.01 – 0.1 m, with progressively darker blue indicating deeper water 1 m+.

6.2 Detailed Modelling

Areas were identified to be taken forward for detailed modelling when features such as kerbs, buildings, garden
walls, fences were introduced as they could have a significant effect in diverting or constraining flows. This
detail could not be included in the intermediate model as simulation times would have become unfeasible. Figure
5 shows the simulation results for one detailed modelling area with flow direction arrows increasing in size and
strength with higher velocities; the relatively shallow and slow flooding spread over a large area (a recreation
ground) could be compared with the constrained flows along a road when higher velocities occurred.

Figure 5. Image illustrates the flow velocity of the surface water flowing E-W, spilling out of bank at culverts. A
larger arrow represents a higher velocity of flow.
Detailed modelling consisted of 4 models which covered areas that were required to be modelled in greater
detail. This consisted of building mesh zones that cover the roads in the model area. These mesh zones were used
to lower the DTM by 0.125 m, the height of a standard kerb. Walls and garden fences were also added into the
detailed models to give a more realistic 2D modelling approach by representing obstructions flowing water
might encounter (Figure 6).

Figure 6. Image illustrates the porous walls added to the model to increase the accuracy of representation of the
fences and walls. The blue areas represent the mesh zones that were used to lower the roads thereby representing
the kerbs.

7. CONCLUSIONS
The introduction of the InfoWorks ICM program is a step change in hydraulic modelling in the UK and
worldwide and it now enables the ultimate goal of fully Integrated Urban Drainage modelling to be realised. It
can be considered akin to the introduction of finite element analysis to structural design.

The fully Integrated Urban Drainage modelling which was achieved at Cheltenham could be achieved for any
other urban catchment and the results of such modelling can be used to produce more accurate flood risk maps,
for spatial and emergency planning purposes and the effective identification of higher risk areas. In the higher
risk areas, increased detail can be added into the model so that the model can be used as an efficient design tool
by firstly illustrating the dominant flooding mechanism and then providing a tool to test and analyse alternative
flood alleviation options. In Cheltenham the InfoWorks ICM model has been used to test a number of flood
alleviation options in different areas including source control, flood storage, improved conveyance and the
design of satisfactory ‘exceedance’ pathways. The features within InfoWorks to replay results in plan view or in
3D have been especially useful in public meetings and to provide explanations to non-technical stakeholders.

SWMP’s are now gaining acceptance in local and central government as the most appropriate way in which to
develop a local flood risk strategy. Many parties consider that the use of river modelling programs is suitable for
SWMP’s but this case study has clearly illustrated that the more advanced modelling which is achieved with
InfoWorks ICM, is essential to the efficient identification of flooding mechanisms and the development of
solutions.

                                                  References
[1] The Pitt Review (2008). Lessons Learnt from the 2007 Floods.
[2] Defra (2008). The Government’s response to Sir Michael Pitt’s Review of the Summer 2007 floods.

N.B All maps include information based upon Ordinance Survey’s 1:1250 maps with the permission of Her
Majesty’s Stationary Office © Crown Copyright. Licence No. 100019134.
You can also read