Performance Evaluation of DSSAT CERES Wheat Model under Different Thermal and Irrigation Regimes at Prayagraj
←
→
Page content transcription
If your browser does not render page correctly, please read the page content below
International Journal of Environment and Climate Change

                            11(8): 132-140, 2021; Article no.IJECC.69663
                            ISSN: 2581-8627
                            (Past name: British Journal of Environment & Climate Change, Past ISSN: 2231–4784)

          Performance Evaluation of DSSAT CERES Wheat
              Model under Different Thermal and Irrigation
                                     Regimes at Prayagraj
                       Lakshmi Prasanna Aggile1*, Shradhha Rawat1, Shweta Gautam1
                                                      and Lakshmi Prasanna Aggile1
      1
       Department of Environmental Sciences and Natural Resource Management, Sam Higginbottom
        University of Agriculture, Technology and Sciences, Prayagraj, 211007, Uttar Pradesh, India.

                                                                                             Authors’ contributions

         This work was carried out in collaboration among all authors. Author LPA designed the study,
   performed the statistical analysis, wrote the protocol, and wrote the first draft of the manuscript. SR
  and SG managed the analyses of the study. Author SG managed the literature searches. All authors
                                                                read and approved the final manuscript.

                                                                                                  Article Information

                                                                                    DOI: 10.9734/IJECC/2021/v11i830465
                                                                                                                  Editor(s):
                                                                       (1) Arjun B. Chhetri, Dalhousie University, Canada.
                                                                                                                Reviewers:
                                                         (1) Sowmyalatha, B. S, University of Agricultural Sciences, India.
                                                            (2) Shubhashree K.S, University of Agricultural sciences, India
                                                         (3) Branislav R. Tanasic, University of the People Sabac, Serbia.
                                            Complete Peer review History: https://www.sdiarticle4.com/review-history/69663

                                                                                          Received 20 April 2021
   Original Research Article                                                              Accepted 28 June 2021
                                                                                    Published 30 September 2021

ABSTRACT
 The present study was planned to determine the phenology and heat unit requirement of promising
 wheat varieties under different crop growing environment of Prayagraj, India. Delay in sowing of
 wheat results into reduction in the grain yield as the crop exposes to high temperature at
 phenological stages. A field experiment on wheat (variety PBW-502) was conducted at the farm
 nursery, College of Forestry, SHUATS, Prayagraj during rabi seasons of 2018-19 and 2019-20.
 The experiment was conducted in factorial randomized block design and replicated thrice with
 three dates of sowing and five irrigation levels. The yield attributes (grain and biological yield) were
 significantly influenced by sowing dates and irrigation levels. The significantly highest grain and
                                                        th
 biological yield were recorded in crop sown on 17 November as compared to other dates of
 sowing. Among different irrigation levels, grain and biological yield were significantly more in I5
 (CRI+ tillering + jointing + anthesis + maturity) treatment over the other irrigation levels. DSSAT
 CERES-Wheat model suggests good model performance at optimum irrigation at Prayagraj under
 stress condition.
_____________________________________________________________________________________________________

*Corresponding author: E-mail: apranathireddy@gmail.com
Aggile et al.; IJECC, 11(8): 132-140, 2021; Article no.IJECC.69663
Keywords: Crop growing environment; DSSAT; Irrigations, Triticum aestivum; weather parameters
1. INTRODUCTION approaches, climate changes, and irrigation
management [7] & [8]. Wheat maturity was
The second most significant cereal crop in the accelerated in North Indian conditions by a
world is wheat (Triticum aestivum L.). Globally, it steady rise in ambient temperature due to
is a thermo-sensitive, long-day crop. Wheat delayed planting. As a result, knowing the
productivity and growth are influenced by a duration of phenological stages in a certain crop-
variety of meteorological conditions, primarily growing environment and their impact on crop
temperature [1]. It necessitates mild yield becomes absolutely necessary. In order to
temperatures during the vegetative stage and find out the phenology and heat unit
high temperatures during the maturation stage. requirements of promising wheat variety grown in
Heat units are critical for crop development, and Prayagraj conditions with various crop
these can be created using increasing degree environments, an experiment was designed.
days (GDD). Increased temperature throughout
the phenological stages of grain development will 2. MATERIALS AND METHODS
lead to lower yield due to delay in wheat sowing.
When the temperature and heat units are above 2.1 Experimental Details
the base temperature, growth occurs. When the
units are below the base temperature, no growth A field experiment on wheat (PBW-502) was
happens [1]. conducted at the farm nursery of College of
Forestry, SHUATS, Prayagraj during the rabi
Wheat sowing time is an essential
seasons of 2018-19 and 2019-20. The
aspect that impacts crop phenology and the
experiment was conducted in factorial
efficiency with which biomass is converted into
randomized block design with three dates of
economic output. Compared to late sowing, th nd
sowing (D1=17 November, D2=02 December
normal sowing has a longer growth duration and, th
and D3=17 December) with five irrigation levels
as a result, allows for the accumulation of greater
(I1 = CRI, I2 = CRI + tillering, I3 = CRI + tillering
biomass, which is represented in higher grain
+jointing, I4 = CRI+ tillering + jointing + anthesis
production [2]. A larger yield can be achieved by
and I5= CRI+ tillering + jointing + anthesis +
increasing irrigation, which is vital for growth and
maturity). A recommended common fertilizer
development [3]. When temperatures rise during -1
dose of 120, 60 and 40 kg ha of N, P and K,
the reproductive stage of a newly seeded crop,
respectively was applied during both the
water stress can occur, reducing output. The
experimental years.
late-planted wheat crop necessitates more water
than the early-planted wheat crop. The lack of
water for irrigation supplies has become an issue 2.2 Agrometeorological Indices
in many regions. Farmers must maximize water
availability, which demands knowledge of The Agrometeorological observatory SHUATS,
irrigation. Wheat crop output and its components Prayagraj, recorded daily meteorological data,
are heavily reliant on irrigation management, including maximum and minimum temperatures
according to numerous studies. Providing (°C), rainfall (mm), relative humidity (percent),
irrigation at important stages of crop growth (CRI, sunshine duration (hours), wind speed (km/hr)
Tilllering, Jointing, Anthesis and Maturity) results and other variables. Following formulae were
in the highest crop output [4]. According to used to construct agrometeorological indices like
research, phenological stages can be completed Growing Degree Days (GDD), Phenol-Thermal
in less time when crops are exposed to moisture Index (PTI), and Heat Use Efficiency for both
stress [5]. biological (HUEBY) and grain yields (HUEGY):
In order to assess the growth, In order to compute the growing degree days,
development, yield, irrigation, and N uptake of daily mean temperatures and the base
numerous crop species, the Decision Support temperature of the crop being considered are
System for Agro-technology Transfer (DSSAT) is used together.
the most extensively used model package [6].
Globally, the DSSAT model has been widely The growing degree days are calculated with
used to model crops in a variety of environmental daily mean temperature and base temperature of
situations, including diverse management considered crop.
133Aggile et al.; IJECC, 11(8): 132-140, 2021; Article no.IJECC.69663
o
Growing degree days ( C days) = 3. RESULT AND DISCUSSION
Tmax/2−Tb
3.1 Crop Phenological Stages
Where,
o Temperature has a significant impact on plant
Tmin = Daily minimum temperature ( C), growth and phenological stages, thus it's
o important to pay attention to it. Wheat is grown in
Tmax = Daily maximum temperature ( C) rabi season, these crops are prone to high
temperature at reproductive stages under varied
And environmental circumstances. Table 2 shows the
o days leading up to various phenological stages of
Tb = Base temperature for wheat crop (5 C). the wheat crop, depending on when it was sown
and how much irrigations was applied. In
Heat use efficiency were calculated as comparison to alternative sowing dates, the
th
timely sown crop (17 November) required fewer
HUEGY= days to achieve CRI and tillering stages. In the
th
timely sown crop (17 November), temperatures
HUEBy= were higher at CRI and tillering stages than at
other sowing dates. While the other phenophase
i.e. jointing to physiological maturity took more
Pheno-thermal index is the ratio of degree days number of days to attain in normal date of
nd th
to the number of days between two phenological sowing, followed by 02 December and 17
stages, and was calculated as: December grown crop. Crops sowed on
th nd
November 17 , December 02 , and December
th
PTI = 17 required 120 days, 113 days, and 109 days,
respectively, to reach physiological maturity.
Analyses of irrigation data showed that it had
Statistical analysis has been done by using the little effect on CRI stage. The days needed to
pooled data for two seasons (2018-19 & 2019- reach physiological maturity were 113 days in
20) for different phenological stages, irrigation level I1, 114 days in irrigation levels 2
agrometeorological indices, yield & biomass with and 3 (I2 & I3), and 115 days in irrigation levels
help of OPSTAT software [9]. four and five (I4&I5). Observed similar results for
varied dates of sowing and irrigation methods [3].
.
2.3 CERES-wheat Model
3.2 Growing Degree Days (GDD)
The Decision Support System for
Agrotechnology Transfer (DSSAT) has an inbuilt The GDD was calculated from CRI stage to
application programme called the CERES-Wheat physiological maturity. Table 3 has shown the
model, which is a simulation model. Plant impact of date of sowing and irrigation on GDD. It
development and yield are simulated in response has been observed that there was a direct
to various environmental conditions (soils, relation of temperature on plant growth
weather and management). Adjusting crop development. With the exception of physiological
parameters to account for phenological maturity, the GDD declined as the planting date
characteristics and yield using experimental was postponed (Table 3). It may be because
fields in 2018-2019 allowed for accurate there were less growing days in a late-planted
0 0
calibration of CERES wheat model. Table 1 crop. GDD was 1527.6 C, 1476.6 C, and
0 th
shows the calculated crop genetic coefficients. 1526.4 C for crops sown on November 17 ,
nd th
As an added measure of model utility, the December 2 and December 17 respectively,
CERES-wheat model was verified using field from the time of sowing until maturity. Similar
data from the wheat crop in 2019-20, which results of heat units under delayed sowing were
compared the actual results to those predicted reported by [10] as well. From the tillering stage
using various sowing dates and irrigation times. until anthesis, irrigation treatments were crucial.
MSE, RMSE, Model Efficiency, and the When compared to alternative planting dates, an
Agreement Index were used to gauge the early wheat crop exhibited sufficient heat unit
model's correctness. requirements.
134Aggile et al.; IJECC, 11(8): 132-140, 2021; Article no.IJECC.69663
3.3 Yield and Heat Use Efficiency (HUE) crop). The fifth irrigation treatment (I5) exhibited
significantly greatest HUE for grain production
Sowing dates and irrigation levels had a (3.5 kg ha-1°C days) as well as biological yield
considerable impact on grain and biological yield (9.8 kg ha-1°C days) among different irrigation
characteristics (Table 4). Crops sown on treatments. As a result, HUE found that in both
November 17 had significantly higher at grain years, grain and biomass yields were best in
and biological yields than late sown crop. Grain well-irrigated techniques and lowest in water
and biological yields were considerably higher in stress situations [10] & [11].
(I5), where five irrigations were given at different
standard stages than other irrigation levels 3.4 Pheno-thermal Index (PTI)
among different irrigation treatment.
The PTI is expressed as growing degree days
Heat use efficiency measures how quickly a plant per growth days. It uses thermal units to
can reach the dry matter harvesting stage for represent phenological behaviour. The early
every unit of heat input. Different dates of sowing sowed crop had the highest PTI, measuring
0
and irrigation levels were used to calculate HUE 17.6 C at maturity (Table 5). The findings
for grain and biological yield. Heat use efficiency revealed some differences in PTI across the
decreased in late-planted crops, as measured by phenological life cycle. Tillering and anthesis are
grain and biological yield. In terms of grain and the two stages where Pheno Thermal Index
biological yield, the maximum HUE i.e. 2.29 kg decreased. The results of the statistical study
ha-1°C days and 8.73 kg ha-1°C days showed that the date of sowing has a
respectively were found in crops sown on the considerable impact. There was no discernible
th
17 of November, while the lowest HUE values difference in CRI or anthesis phases based on
th
were found in late-planted crops (17 December irrigation amounts [3,10,12].
Table 1. Calibrated genetic coefficients of wheat cultivar
Code Parameters PBW -502
P1V Days at optimum vernalizing temperature required to complete 15
vernalization.
P1D Percentage reduction in development rate in a photoperiod 10 hour 100
shorter than the threshold relative to that at the threshold.
o
P5 Grain filling (excluding lag) phase duration ( C. d) 999
G1 Kernel number per unit canopy weight at anthesis (#/g) 50
G2 Standard kernel size under optimum conditions (mg) 60
G3 Standard, non-stressed dry weight (total, including 3.5
grain) of a single tiller at maturity (g)
o
PHINT Interval between successive leaf tip appearances ( C. d) 150
Table 2. No. of days to achieve crop phenological stages of wheat on different date of sowing
and irrigation levels (Pooled data of 2018-19 and 2019-20)
Treatments CRI TILLERING JOINTING ANTHESIS MATURITY
Sowing Time
17 Nov 23 43. 66 82 120
02 Dec 24 45 65 80 113
17 Dec 25 45 64 77 109
CD at 5% 0.48 0.409 0.49 0.53 1.46
Irrigation Levels
I1 24 45 66 80 113
I2 24 45 65 80 114
I3 24 44 65 80 114
I4 24 44 65 79 115
I5 24 44 64 79 115
CD at 5% N/A 0.52 0.64 0.69 N/A
135Aggile et al.; IJECC, 11(8): 132-140, 2021; Article no.IJECC.69663
Table 3. Accumulated heat units (°C day) of wheat on different date of sowing and irrigation
levels (Pooled data of 2018-19 and 2019-20)
Treatments CRI TILLERING JOINTING ANTHESIS MATURITY
Sowing Time
17 Nov 398.4 683.3 924.7 1118.8 1527.6
02 Dec 375.2 611.2 848.3 1019.3 1476.6
17 Dec 335.6 565.2 843.7 1006.1 1526.4
CD at 5% 6.7 5.3 6.5 8.7 20.9
Irrigation Levels
I1 369.2 630.4 880.0 1057.0 1472.8
I2 372.6 623.7 875.5 1054.3 1523.8
I3 367.8 620.0 872.4 1048.2 1514.0
I4 366.8 612.8 869.6 1040.5 1520.6
I5 372.4 612.7 863.7 1040.4 1519.4
CD at 5% N/A 6.9 8.4 11.2 27.0
Table 4. Yield and heat use efficiency (HUE) of wheat on different date of sowing and irrigation
levels (Pooled data of 2018-19 and 2019-20)
Treatments Yield Heat Use Efficiency
Grain Biomass HUE on grain yield HUE on biological
(t/ha) (t/ha) basis yield basis
-1 -1 -1 -1
(kg ha °C day ) (kg ha °C day )
Sowing Time
17 Nov 3.7 13.8 2.29 8.73
02 Dec 3.4 13.0 2.27 8.49
17 Dec 3.2 12.5 2.10 8.44
CD at 5% 0.09 0.8 0.06 0.12
Irrigation Levels
I1 1.42 11.3 0.9 7.3
I2 2.68 12.2 1.7 7.8
I3 3.49 13.4 2.2 8.6
I4 4.33 14.1 2.7 9.1
I5 5.54 14.6 3.5 9.8
CD at 5% 0.12 1.09 0.08 0.16
Table 5. Pheno thermal index (PTI) of wheat on different date of sowing and irrigation levels
(Pooled data of 2018-19 and 2019-20)
Treatments CRI TILLERING JOINTING ANTHESIS MATURITY
Sowing Time
17 Nov 17.6 10.8 15.5 16.5 17.6
02 Dec 15.0 8.46 14.5 144 13.7
17 Dec 12.5 8.41 14.4 13.4 16.3
CD at 5% 0.2 0.2 0.4 0.9 0.7
Irrigation Levels
I1 14.9 8.8 14.5 15.6 16.8
I2 15.2 9.16 14.9 15.4 15.2
I3 15.1 9.14 14.7 14.7 15.3
I4 15.2 9.4 14.4 14.1 14.8
I5 14.9 9.6 15.4 14.1 17.2
CD at 5% N/A 0.3 0.6 N/A 0.9
136Aggile et al.; IJECC, 11(8): 132-140, 2021; Article no.IJECC.69663
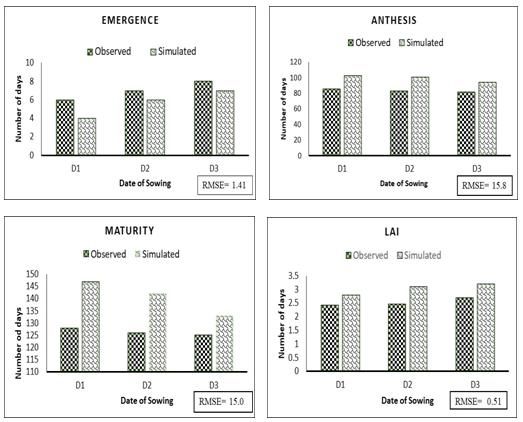
3.5 Calibration of CERES-wheat Model 2020. The minimum wheat yield was
observed at single irrigation and highest
The calibration was done for phenological yield was recorded at maximum irrigation
parameters like days to emergence, anthesis, levels at critical stages of wheat (Table 7).
maturity and leaf area index for the period 2018- The accuracy of DSSAT model results
2019 of wheat crop (Figure 1). The RMSE was were checked by different statistical
found less between observed and simulated parameters. The MSE, RMSE, Model
phenophases of wheat crop. Table 6 shows that Efficiency & Agreement Index values has
model is able to simulate the grain yield for most been shown in the table 7. The highest
of the treatments. The highest simulated grain error was found in the I1 treatment for
yield by DSSAT was observed at maximum different sowings. The minimum wheat
irrigation levels. For this study, DSSAT model yield was observed at single irrigation and
underestimated yield of wheat crop for three highest yield was recorded at maximum
different sowing time (Table 6). Similar findings irrigation levels at critical stages of wheat.
were found at [13,14,15]. According to [15] the validation showed
3.6 Validation of Model at Irrigation better results under optimum irrigation with
early date of sowing compared to late
Scheduling on Yield
sowing and stress treatments with less
The calibrated genetic coefficients are used irrigations.
to validate the model for the period 2019-
Fig 1. Comparison of observed and simulated phenological characteristics of wheat
137Aggile et al.; IJECC, 11(8): 132-140, 2021; Article no.IJECC.69663
Table6. DSSAT-CERES model for different irrigation scheduling at different date of sowing in
wheat for 2018-2019 at Prayagraj conditions. (Calibration of the model)
Treatments Observed Simulated
17/11/2018
I1 1720 1467
I2 2756 2848
I3 3653 3777
I4 4553 4731
I5 5916 5465
RMSE 254
Model Efficiency 6.9
Agreement Index 0.01
02/12/2018
I1 1370 1177
I2 2513 2439
I3 3490 3586
I4 4390 4450
I5 5406 5107
RMSE 170.2
Model Efficiency 1.56
Agreement Index 0.0005
17/12/2018
I1 1230 1281
I2 2390 2100
I3 3176 3420
I4 4196 4189
I5 5136 4958
RMSE 171
Model Efficiency 1.37
Agreement Index 0.0005
Table 7. DSSAT-CERES model for different irrigation scheduling at different date of sowing in
wheat for 2019-2020 at Prayagraj conditions. (Validation of the model)
Treatments Observed Simulated
17/11/2019
I1 1813 938
I2 2720 2534
I3 3657 3576
I4 4417 4554
I5 5853 5571
RMSE 425.4
Model Efficiency 1.53
Agreement Index 0.002
02/12/2019
I1 1260 827
I2 2713 2474
I3 3457 3412
I4 4277 4162
I5 5540 5251
RMSE 262
Model Efficiency 7.7
Agreement Index 0.001
17/12/2019
I1 1163 945
I2 2360 2113
138Aggile et al.; IJECC, 11(8): 132-140, 2021; Article no.IJECC.69663
Treatments Observed Simulated
I3 3317 3379
I4 4153 4244
I5 5373 5103
RMSE 196.7
Model Efficiency 1.74
Agreement Index 0.0007
4. CONCLUSION of Global Biosciences. 2015;4(2):1327-
1334.
From the experiment it was concluded that 5. Ihsan MZ, El-Nakhlawy FS, Ismail SM,
substantial relationship was found between Fahad S, Daur I. Wheat phenological
different irrigation levels and the date of sowing. development and growth studies as
It was observed that an early date of sowing has affected by drought and late season high
shown better results to reach the various temperature stress under arid
phenological stages, as well as sufficient heating environment. Front. Plant Sci. 2016;7:1-
unit requirements and efficient heat usage. At 14.
various phases of growth, the agrometeorological 6. Hoogenboom G, Porter CH, Shelia V, B
indices show the impact of temperature and oote KJ, Singh U, White JW, Hunt LA, Og
photoperiod on crops' phenological behavior, as oshi R, Lizaso JI, Koo J, Asseng S,
well as the efficiency with which heat is used. In Singels A, Moreno LP, Jones
order to improve yield, farmers are advised to JW. Decision support system for
use the above findings on wheat crop treatment agrotechnology transfer (DSSAT) version
combinations and heat unit requirements under 4.7 DSSAT foundation, gainesville, florida,
th USA; 2017.
Prayagraj circumstances, for normal (17 Nov)
date of sowing. Weather conditions throughout 7. Rasse DP, Ritchie JT, Wilhelm W, Wei J,
the flowering stage was critical, and they might Martin EC. Simulating inbred-maize yields
have an impact on grain yield for Prayagraj. with CERES-IM. Agron. J. 2000;92:672-
DSSAT CERES-Wheat model predicts good 678.
model performance under stress conditions. 8. Kadiyala MDM, Jones JW, Mylavarapu RS,
Li YC, Reddy MD. Identifying irrigation and
nitrogen best management practices for
COMPETING INTERESTS aerobic rice–maize cropping system for
semi-arid tropics using CERES-rice and
Authors have declared that no competing maize models. Agric. Water Manage.
interests exist. 2015;149:23-32.
9. Sheoran OP, Tonk DS, Kaushik LS, Hasija
REFERENCES RC, Pannu RS. Statistical software
package for agricultural research workers.
1. Prajapat AL, Saxena R. Thermal Recent advances in information theory,
requirements of wheat (Triticum aestivum statistics and computer applications by DS.
L .) cultivars under different growing Hooda and RC; 1998.
environments. International Journal of 10. Gill KK, Babuta R, Kaur N, Kaur P,
Chemical Studies. 2018;6(5):17–22. Sandhu SS. Thermal requirement of wheat
2. Singh S, Pal M. Growth, yield and crop in different agroclimatic regions of
phonological response of wheat cultivars to Punjab under climate change scenarios.
delayed sowing. Indian J. Plant Physiol. Mausam. 2014;65(3):417–424.
2003;8:277-287. 11. Dar, Eajaz Ahmad, Brar AS, Yousuf A.
3. Bisht H, Singh DK, Mishra SAK, Sarangi Growing degree days and heat use
A, Prajapati VK, Singh M, Krishnan P. efficiency of wheat as influenced by
Heat unit requirement of wheat (Triticum thermal and moisture
aestivum L.) under different thermal and regimes. J. Agrometeorol. 2018;20(2):168-
moisture regimes. Journal of 170.
Agrometeorology. 2019;21(1):36–41. 12. Ram H, Singh G, Mavi GS, Sofia VS.
4. Zare M, Parvizi H, Sharafzadeh S, Accumulated heat unit requirement and
Azarpanah A. Evaluation of wheat yield of irrigatedwheat (Triticum aestivum
cultivars under various irrigation. Journal L.) varieties under differentcrop growing
139Aggile et al.; IJECC, 11(8): 132-140, 2021; Article no.IJECC.69663
environment in central Punjab. J. Evaluation of CERES-Rice model for
Agrometeorol. 2012;14(2):147-153. Upper Brahmaputra Valley Zone of
13. Patel C, Nema AK, Singh RS, Yadav MK, Assam. J. Agrometeorol. 2017;19(3):270-
Singh SK, Singh SM. Evaluation of 273.
DSSAT-CERES model for irrigation 15. Patel HR, Patel GG, Shroff JC, Pandey V,
scheduling of wheat crop in Varanasi Shek AM, Vadodaria RP, Bhatt BK.
region of Uttar Pradesh. J. Agrometeorol. Calibration and validation of CERES-wheat
2017;19(2):120-124. model for wheat in middle
14. Medhi K, Neog P, Goswami B, Deka RL, Gujarat region. J. Agrometeorol.
Kurmi K, Sarmah K, Khanikar PG. 2010;12(1):114-117.
© 2021 Aggile et al.; This is an Open Access article distributed under the terms of the Creative Commons Attribution License
(http://creativecommons.org/licenses/by/4.0), which permits unrestricted use, distribution, and reproduction in any medium,
provided the original work is properly cited.
Peer-review history:
The Peer review history for this paper can be accessed here:
https://www.sdiarticle4.com/review-history/69663
140You can also read