Houston air quality assessment in response to Coronavirus social distancing measures
←
→
Page content transcription
If your browser does not render page correctly, please read the page content below
Houston air quality assessment in response to Coronavirus social distancing measures
Gunnar W. Schade, Atmospheric Sciences Department, Texas A&M University, College Station, TX

10 April 2020

(peer review provided by Drs. Sarah Brooks, TAMU, and Don Collins, UC Riverside)

20 April 2020 UPDATE

Summary

A limited analysis of state air quality data in Houston was conducted with a focus on nitrogen oxides and
fine particulate matter. Publically available data from three weeks before and up to four weeks after
social distancing orders indicate that NOx levels have dropped non-uniformly across Harris County.
Highest reductions have occurred next to a major traffic axis, while lower reductions occurred at sites
not directly next to such axes; for example, no significant reductions were observed in Deer Park. In
turn, large fine particulate matter increases were observed at the Deer Park site, and smaller increases
at two other sites, and neither can be explained by different weather conditions during the two periods
investigated. A closer analysis of possible source changes suggests that long-range transport of smoke
from Latin American fires may have caused uniform PM2.5 increases, which in combination with non-
uniform decreases of the traffic source of PM2.5 might explain the ambient observations.

1. Introduction

Throughout the world, social distancing measures have been put in place to slow down the spread of
SARS-CoV-2, also known as coronavirus. As a result of both voluntary and mandated measures of
“shelter-in-place” or “stay-at-home” orders, or less drastic measures such as canceling large events and
limiting gatherings to no more than 10 people, the sources of air pollutants attributable to car traffic
and industrial processes have been reduced. Fewer people and goods travel long or short distances,
reducing mobile source emissions, and lower amounts of production activities may also lead to lower
stationary source pollutant emissions as the economy has slowed down. This has led to remarkable
improvements of air quality in many cities and countries, and has been detectable from space using
routine satellite data analysis (NASA Earth Observatory, NYTimes). Interestingly, Texas cites have not yet
featured in any associated analyses, despite the fact that there are three metropolitan areas in Texas,
Houston, Dallas/Ft. Worth, and San Antonio, that deal with significant air quality issues. For historical
reasons, Houston has among the densest air quality monitor networks in the nation, and is dealing with
significant ozone and fine particulate matter levels.

In response to the growing spread of the coronavirus in Texas, on March 19 Governor Abbot announced
the closing of bars, restaurants and schools (Texas Tribune) by end of Friday, 20 March, which was
followed a few days later, 24 March, by a local stay-at-home order from Harris County Judge Hidalgo.

In this report, I have summarized the development of two common pollutants, nitrogen oxides (NOx)
and fine particulate matter (PM2.5) since 1 March 2020 at selected Harris County air quality monitors, to
evaluate whether these state and local orders caused a significant change in Houston air quality. NO2,
typically the dominant component of NOx, and PM2.5 are known to cause significant health effects. NO2
can aggravate respiratory diseases, particularly asthma, and causes respiratory symptoms such as
coughing, wheezing or difficulty breathing. It may also contribute to the development of asthma at
longer exposures to elevated concentrations. At-risk populations include people with asthma, children
and the elderly (EPA). Exposure to PM2.5 can affect both the respiratory and cardiovascular systems.
High PM2.5 concentrations can cause premature death in people with heart or lung disease, nonfatal
heart attacks, irregular heartbeat, aggravated asthma, decreased lung function, increased respiratory
symptoms, such as irritation of the airways, coughing or difficulty breathing. Similar to NO2, at-risk
populations include people with pre-existing lung diseases, children, and older adults (EPA).

Sources of NOx include internal combustion (major), industrial combustion processes and natural
emissions from soils (minor). Diesel engines tend to contribute more NOx than gasoline engines, often
making big-rig trucks and other large diesel engine vehicle the major NOx sources in urban areas.

Sources of fine particulate matter include both direct formation in combustion plumes/exhaust, and
indirect formation from gas-phase pollutants, both man-made and natural, oxidized in the atmosphere.
Previous, detailed studies in Houston by Texas researchers showed that PM2.5 mass tends to be spatially
and temporally near uniform, with only slight increases during rush-hour and during spring time.
Sources include both local and regional primary emissions, and secondary production. A large fraction of
PM2.5 is organic carbon (OC), and the associated ratio between organic and elemental carbon (soot, EC)
shows that OC consist dominantly of secondary organic aerosol (SOA). Recent NSF funded work
including Rice University scientists showed that most of the OC in PM2.5 in east Houston stems from both
primary and secondary fossil fuel emissions, including industrial emissions.

The traffic contribution to PM2.5 is comparatively small. UT and TCEQ scientists estimated the traffic
source to be around 20% ten years ago, and more recent work by scientists at Texas A&M showed a
similar contribution around 23%.

2. Methodology

I used public access to State of Texas air quality monitoring data through TCEQ’s website at
https://www.tceq.texas.gov/cgi-bin/compliance/monops/select_year.pl

Air quality and precipitation data was downloaded from monitors circled in Figure 1 for all of 2020 so
far, up to and including 8 April 2020. The data was reordered into a continuous timeline for analysis
purposes. No other sub-selection was performed, no detailed analysis was carried out to determine
individual pollutant sources, or the detailed influences of local weather on the data. The focus was on
determining whether there are detectable and significant differences in ambient pollutant levels of
nitrogen oxides (NOx) and fine particulate matter (PM2.5) during the three weeks prior to, compared to
the three weeks after, the state and local social distancing orders. Data selection was limited to three to
four weeks each to minimize possible biases in the comparison resulting from different period lengths
and the effect of seasonal changes during spring time. Additional comparisons are of course possible,
but were deferred to a later point in time.
3. Results

3.1 Nitrogen Oxides

Nitrogen oxides at most AQ monitors dropped after social distancing began, likely due to reduced traffic
on Houston’s roads, because car traffic is a known, dominant contributor to nitrogen oxide emissions in
urban areas. Figure 2 shows an example timeline through March into April from the monitor at Bayland
Park in Houston’s western region. In this case, a drop in NOx is obvious only for high hourly values during
the morning and evening rush hours. Thus, average NOx, driven by these values, was 22% lower after the
social distancing order, but midpoint (median) NOx levels were slightly higher post-order.

This analysis shows that any effects of reduced traffic should not be expected to be necessarily uniform.
In the case of Bayland Park, a largely residential area, rush hour NOx levels were significantly reduced,
but median NOx levels were not.

To have a closer look at traffic NOx emissions, data from the Houston North Loop monitor are useful
since the monitor is located close to a busy, major traffic axis, Interstate 610. Figure 3 shows the diurnal
medians and pre-order variability of NOx at CAMS 1052. At this site, significantly higher NOx levels are
recorded due to its nearness to I-610, and all post-order hourly medians are below the pre-order hourly
medians, demonstrating a strong effect from NOx emission reductions due to lower traffic densities. In
this case median reductions were of order 50% between the periods.

At two other urban monitoring site, CAMS 8 in Aldine, and CAMS 403 at Clinton Dr.., reductions were
similar to the North Loop site but with average levels 46% lower in Aldine, and 35% lower at Clinton Dr.,
as compared to the three weeks prior to the Governor’s social distancing order.

The picture is different at the Deer Park site, where nearby industrial sources other than traffic may
contribute to local NOx abundances, and there are no major traffic axes close-by. Figure 4 shows diurnal
nitrogen oxides levels at the Deer Park monitor. In this case, pre- and post-order levels were not
significantly different. While NOx averages were slightly larger pre-order, medians were slightly larger
post-order. This suggests that outside of small reductions during rush-hour, no drop in NOx levels
occurred in an area where traffic emissions are not the dominant contributor to ambient NOx pollution.

3.2 Fine particulate matter, PM2.5

Not all the sites analyzed for NOx also maintain PM2.5 measurements. Measurements at the Aldine,
Clinton Dr., and Deer Park sites show that concentrations of PM2.5 did not drop after the social
distancing order. At the Aldine site, PM2.5 levels slightly increased after 20 March, by a statistically
significant amount of 14%. The respective increases at the industrial emissions impacted Clinton Dr. and
Deer Park sites were 12% and 52%, both statistically significant. Figure 5 shows the pre- and post-order
diurnal cycle of PM2.5 at Deer Park, showing that fine particulate matter levels increased at all hours.

4. Discussion

Despite widespread social distancing in the US, the effects of this on air quality are apparently not
uniform. In Houston, maybe contrary to expectations, NOx air quality has seen limited improvement,
and fine particulate matter pollution arguably worsened. In places where car traffic emissions are the
dominant contributor to ambient nitrogen oxide concentrations, NOx levels have declined significantly
more since the governor’s social distancing order as compared to sites with less direct traffic impacts,
exemplified by the CAMS 1052 next to Interstate 610 north of downtown. However, reductions have
been somewhat smaller than expected considering the usually dominant NOx source from traffic,
suggesting that traffic may have been reduced less than in other urban areas such as Los Angeles or New
York. Traffic counts in different parts of Houston should be compared between pre- and post-order
periods, especially with respect to heavy duty vehicles which tend to contribute the bulk of NOx
emissions from their diesel engines. Meaning, while NOx reductions may have come dominantly from
reduced commuter traffic, this part of the traffic source does not dominate NOx emissions, wherefore
NOx reductions are not expected to scale 1:1 with traffic reductions. In addition, the effects of weather
conditions would need to be studied in more detail to evaluate possible effects on ambient NOx levels
from changing boundary layer depths and dispersion characteristics.

Somewhat surprisingly, fine particulate matter levels have increased, not decreased, since the social
distancing measures were put in place. This cannot be straightforwardly explained by conditions of
increased precipitation removing more PM prior to the social distancing orders, as both periods
contained a similar amount of rainy days. Instead, this suggests that the sources of PM2.5 in Houston
may be more active since the social distancing orders were enacted. The most likely candidates are long-
range transport, local primary emissions, and local secondary production. Long-range transport at this
time of year is typically related to biomass burning in Latin America, bringing smoke to the central US
Gulf Coast, which contributes to local PM2.5. This was recently evaluated by scientists at the University of
Houston, showing that during at least 10% of all days during April and May, smoke affects PM2.5 levels
along the Texas Gulf Coast by 3-5 µg m−3. Since spring 2020 arrived early, this source was active early,
demonstrably visible on satellite atmospheric aerosol measurements. Impacts on the Gulf Coast were
forecasted to be fluctuating, and of order 10 µg m−3.

PM2.5 level increases were higher at the Deer Park monitor than either at the Clinton Dr. or Aldine
monitors. The non-uniform increase at first appears incompatible with contributions to PM2.5 from long-
range smoke transport from Central American sources. However, this could be related to a combination
of effects. If we assume, based on the lack of NOx changes, that PM2.5 contributions from traffic to PM2.5
at the Deer Park site are negligible, then the observed median changes at that site may be assigned
100% to smoke from long-range transport. If, at the same time, we assume traffic reductions to have
reduced PM2.5 levels at the other sites by 20-25%, based on the established traffic contributions to
PM2.5 mass, this might explain lower net increases at those sites. These assumptions and associated
calculations are summarized in Table 1.

Table 1: Rough PM2.5 mass balance assuming only two effects, a reduction from less car traffic (assumed
to be 100%) plus an addition from long-range transport of smoke. Other effects were presumed to be
negligible. All values in µg m−3. CAMS 35 used as baseline *.

 Site      Median pre-      Presumed traffic    Presumed         Net post-order      Observed post-
 CAMS#     order PM2.5      impact              smoke impact     median PM2.5        order median PM2.5
 35             6.0                −0                +3.2              9.2*                  9.2
 8              8.3           −1.7 (−20%)            +3.2              9.8                   9.7
 403            8.7           −2.2 (−25%)            +3.2              9.7                   9.2
This rough estimation shows that the forwarded explanation is reasonable, though would have to be
investigated in more detail. Especially the assumptions of a 100% reduction of PM2.5 impacts from traffic
at the Aldine and Clinton Drive sites, as well as the assumption of negligible other impacts, are
somewhat questionable in this respect.

Some more insight into this will be gained via watching the smoke impact forecasts. While impacts were
present over nearly the entire post-order period, they may be dropping from 20 April forward, which
should then materialize in lower PM2.5 values at all monitors if the hypothesis of long-range transport
smoke impacts is correct.

Insights into the assumption of negligible other impacts may be gained by looking at other pollutant
change that may have occurred. For instance, slightly higher SO2 values were measured at the Clinton
Drive site (data not shown), which, however, also require careful data quality assurance.

Additional, pending analyses will look into isoprene as a marker of biogenic emissions that contribute to
local SOA formation, and other hydrocarbons as marker for industrial emissions that may have
contributed primary or secondary pollutants to PM2.5 formation.

5. Conclusions

A brief analysis of Houston NOx and PM2.5 air quality across different monitors in Houston’s west, north,
east, and southeast, representing residential, traffic dominated, and mixed use areas, reveals that air
quality may not have improved overall as much as preliminary analyses of recent satellite data
depictions for urban areas such as Seattle, Los Angeles and New York indicated (the satellite NO2
measurements over Texas occur in the early afternoon). While the published satellite data focused on
NO2 abundances, which are typically driven by car traffic emissions in urban areas, this analysis includes
fine particulate matter data. It shows that PM2.5 levels have not improved similar to NOx. On the
contrary, the observed PM2.5 level increases since social distancing measures were enacted may point to
changes in non-traffic sources counteracting traffic related reductions. Long-range transport of smoke
from Central America may be a significant source present in much of April 2020, as indicated by satellite
data and smoke transport analyses. This does not exclude other possible changes to industrial emissions
or atmospheric chemistry as contributors to observed PM2.5 increases, but they might currently be less
relevant. Data analyses thus continues.

Figures
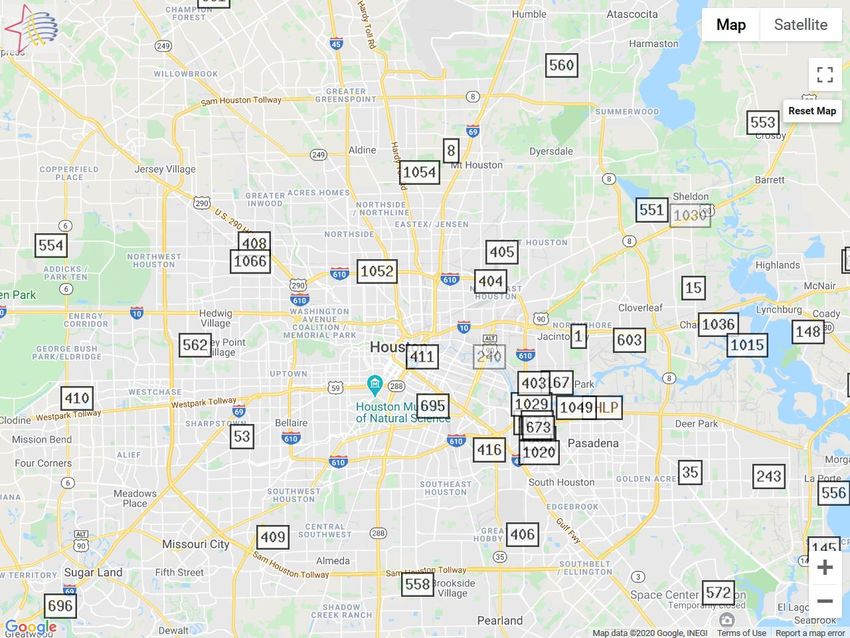
Figure 1: Houston air quality Continuous Air Monitoring Station (CAMS) map. The circled numbers
identify the currently analyzed locations: CAMS 8 – Aldine, CAMS 1052 – Houston North Loop, CAMS 53
– Bayland Park, CAMS 403 –Clinton Dr., and CAMS 35 – Deer Park.
Figure 2: Hourly NOx abundance at CAMS 53, a residential area, in March/April 2020. The vertical
dashed line demarcates the state social distancing order in effect after Friday, March 20 (the last day in
this data set is Friday, April 18, 2020).
Figure 3: Boxplot of CAMS 1052, next to I-610, diurnal NOx data prior to the 20 March cutoff compared
to median (midpoint values) NOx levels after the social distancing order (red bars). Horizontal bars are
medians, boxes are interquartile ranges (the center 50% of the data), whiskers represent 95%
confidence levels, and individual data points show extreme hourly values outside the central 90% of the
data.
Figure 4: Same as Figure 3 but for the Deer Park site, CAMS 35, in southeast Harris County. Note low
overall NOx levels at this site, which is located further away from major traffic axes.
Figure 5: Deer Park PM2.5 diurnal changes pre- and post-social distancing orders effective 21 March
2020. Horizontal bars are medians (midpoint values), boxes are interquartile ranges (the center 50% of
the data), whiskers represent 95% confidence levels, and individual data points show extreme hourly
values outside the central 90% of the data. Red bars indicate hourly medians from 21 March to 18 April.
You can also read