Alameda County Board of Supervisors COVID-19 Update - May 25, 2021
←
→
Page content transcription
If your browser does not render page correctly, please read the page content below
Alameda County
Board of Supervisors

 COVID-19 Update

     May 25, 2021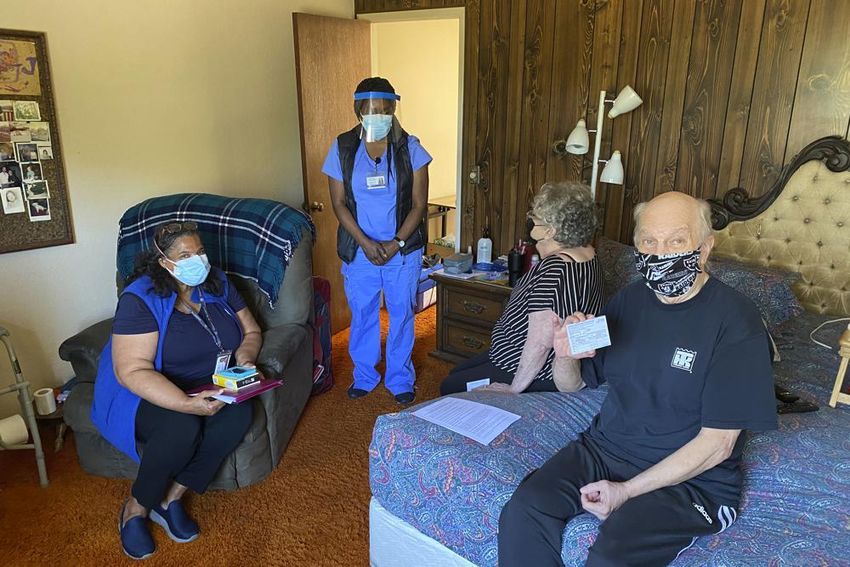
Agenda

1. Data
2. Re-opening/Blueprint
3. Vaccine Updates
4. Outreach & Communications

                               2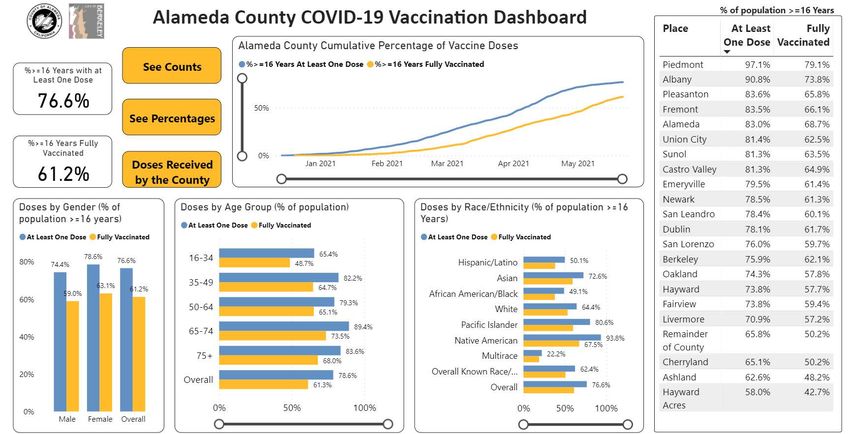
1. Data

          3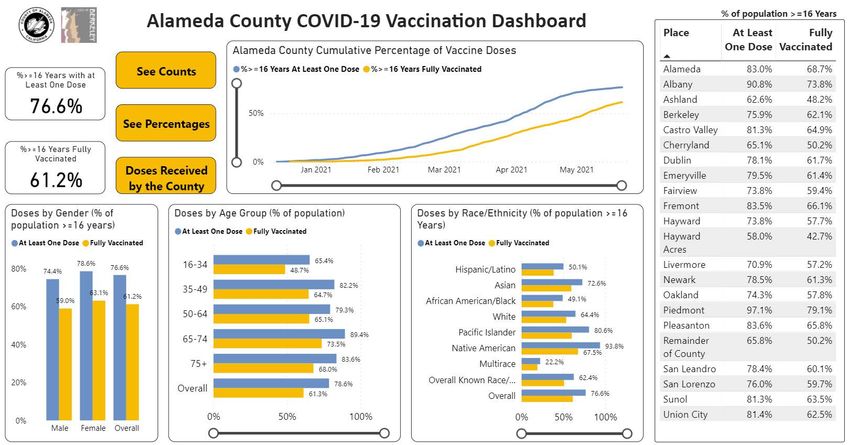
Epidemic Data Key Points

• Daily case rate is 2.9 per 100,000
  • Adjusted Case Rate is 2.1
  • Between 25 and 70 cases reported daily
  • 25 B.1.617 cases
• Test positivity is 1%
  • 1.5% in lowest HPI quartile
• Hospitalized COVID cases 58; ICU 15
• Testing 7,600 per day and falling
• Low and improving rates; some other large counties ahead of us
  • Still seeing some household, workplace and youth sports clusters

                                                                       4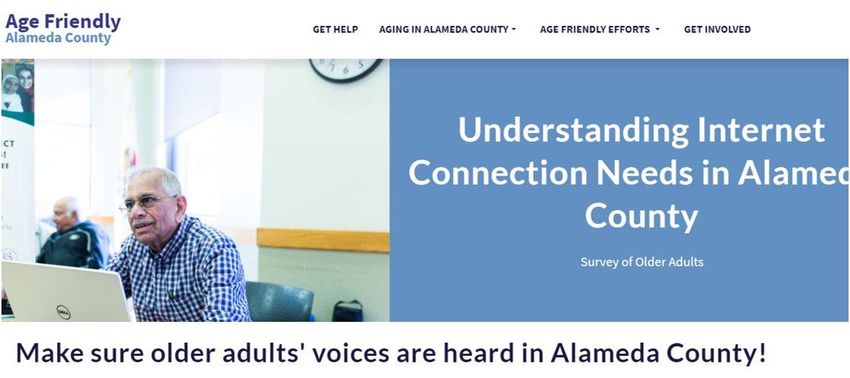
Future of the Pandemic

• COVID vaccines are proving highly effective in real world
  • Data on vaccines and variants reassuring
  • Risk of health care surges much reduced
• COVID-19 will continue to circulate among unvaccinated persons
  •   May see increased transmission rates in Fall/Winter
  •   Declining mask use will accelerate transmission
  •   Herd immunity – in which very little transmission occurs – is far away
  •   Boosters may be needed at some point
• Unvaccinated people will likely be infected, sooner or later

                                                                               5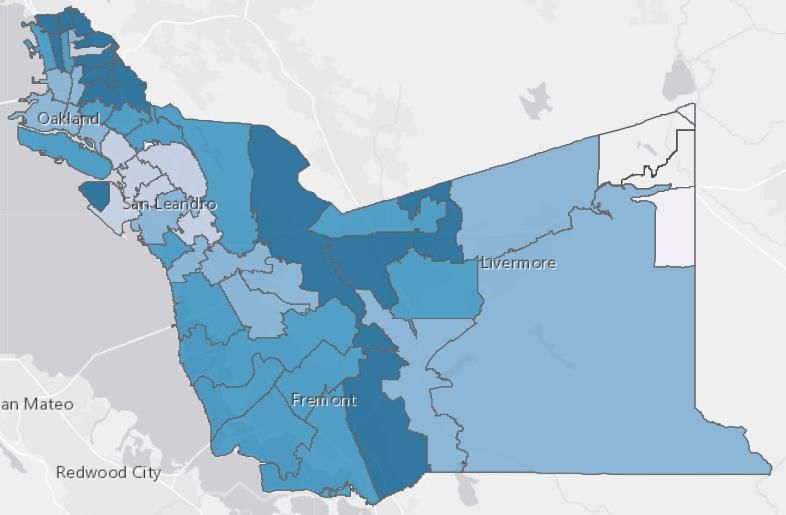
2. Reopening/Blueprint

                         6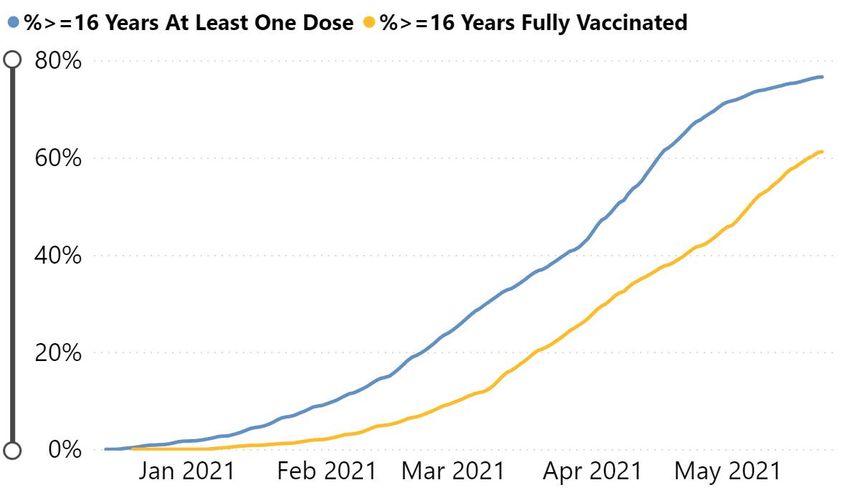
Blueprint Update

• AC in Orange Tier for now
  • May not reach Yellow Tier (expanded capacity limits)
• “Beyond the Blueprint” guidance released 5/21
  • COVID-19 restrictions will be removed for most sectors 6/15
  • Mega-Events subject to ongoing restrictions through 10/1/21
    • > 5,000 attendees if indoors, > 10,000 attendees if outdoors
  • Expecting additional guidance for 3 sectors:
    • Health care, schools/youth activities and high-risk congregate settings
  • CalOSHA Emergency Temporary Standards being revised

                                                                                7
Beyond the Blueprint Key Changes
Restrictions Applying to Indoor & Outdoor Settings
Vaccine Verification / Required for Indoor mega events
Negative Testing Recommended for Outdoor mega events
Capacity Limitations No restrictions
Physical Distancing No restrictions for attendees, customers and guests
Masking Follow current CDPH Guidance for Face Coverings
Travelers Follow CDC recommendations and CDPH Travel Advisory
83. Vaccine Updates
9Alameda County Percentage of Vaccinated Residents 16+, May 23, 2021
10What are Vaccination Rates by Race/Ethnicity?
Vaccination Rates by Race/Ethnicity
(% of 16+ Population with at least one dose and fully vaccinated):
Cumulative (thru 5/14/21)
% of Pop 16+ % of Pop 16+
with at least 1 dose fully vaccinated
(cumulative) (cumulative)
100%
87%
% of 16+ Pop by Race/Ethnicity
90%
80% 76%
69%
70% 63%
60% 58%
53% 52% 49%
50% 47% 46%
40% 34% 31%
30%
20%
10%
0%
Native American Pacific Islander Asian White African Hispanic/Latino
American/Black
Note: Rates by race/ethnicity only reflect vaccinated residents with known RE.
Does not reflect residents with unknown RE who got at least 1 dose (30%) or were fully vaccinated (20%).
11
Source: ACPHD, with CAIR data through 5.14.21Fully Vaccinated by Zip Code (% of 16+ Population)
12Doses Administered by Zip Code of Residence
@Alameda County PODS through 5.24.21
among 90% who are AC residents; orange = high priority zip codes
Doses Administered by County of Residence 8.6%
@ Alameda County PODs through 5.24.21
7.6%
Out of 7.1%
Jursidiction,
10%
5.9%
4.0%
3.8%
3.6%3.7%
3.4%
3.2%3.2%
3.1%
3.1%
3.0%
2.7%
2.6%
2.4%
Alameda 2.2%
2.0%2.0%
County, 90% 1.6%1.8%1.8%
1.4%
1.3%1.3%1.3%1.3%1.3%1.4%
1.1%
1.0%
0.6%
0.6% 0.7%
0.7%
0.3%
0.2%
0.2% 0.3%0.4%0.4%0.5%
0.3%
0.3%
0.2%
0.1%
0.0%0.0%0.0%0.0%0.1%0.1%
94720
94514
94613
94586
94505
94710
94709
95391
95377
94704
94708
94702
94707
94703
94705
94706
94618
94502
94609
94612
94608
94610
94552
94542
94611
94551
94607
94588
94619
94579
94602
94550
94555
94566
94560
94568
94501
94580
94605
94539
94546
94538
94545
94578
94606
94603
94577
94536
94621
94587
94541
94601
94544
13Community Stationary POD Sites This Week
Day of Week Fremont High Hayward Adult Allen Temple Union City-Old Decoto
3-7pm 3-7pm 3-7pm
Thursday 5/27 J&J & Pfizer J&J & Pfizer J&J & Pfizer CLOSED
FAMILY NIGHT FAMILY NIGHT FAMILY NIGHT
8am-4pm 11am-7pm 3-7pm 4:30-7:30pm
Friday 5/28 Moderna 1st and 2nd Moderna 1st and 2nd Moderna 1st (and 2nd J&J & Pfizer
doses doses doses drop-in) FAMILY NIGHT
8am-4pm 8am-4pm 9am-1pm 1-4pm
Saturday 5/29 Moderna 1st and 2nd Moderna 1st and 2nd Moderna 1st (and 2nd Moderna 1st (and 2nd
doses doses doses drop-in) doses drop-in)
1-4pm
Sunday 5/30 CLOSED CLOSED CLOSED Moderna 1st
(and 2nd doses drop-in)
14Myocarditis Reports
• CDC is evaluating rare reports of myocarditis following COVID vaccination
• Myocarditis is inflammation of the heart muscle
• So far, rate in vax safety systems is similar to expected background rate
• Case characteristics
• Predominantly adolescents and young adults
• More often males than females
• More often following dose 2
• Typically within 4 days of vaccination
• Most cases appear mild
• Myocarditis is often caused by viral infection, incl. COVID-19
154. Outreach & Communications
16Taking vaccine to homebound people
ACPHD Mobile Vaccination Teams
• Medical Reserve Corp and PHNs
• Local Fire Departments
75 homebound individuals vaccinated
50 others scheduled
Connecting with IHSS and Adult Protective Services to get
data to send texts to their recipients.
If you know of a homebound individual that needs to be
John McFarland, 70, shows his vaccination card after receiving the COVID-19
vaccinated, please call the ACPHD Vaccine Helpline at
vaccine inside his bedroom in Hayward, Calif., May 6, 2021. Alameda County nurses
Patricia Calloway, left, and Devette Laflore chat with his wife, Patti Amaral, 73,
(510) 208-4VAX
while they waited to make sure there were no vaccine side effects. (AP Photo/Terry
Chea)
SAN FRANCISCO (AP) — For months, Victoria McAllister searched online to make a vaccination appointment. Unlike other people who can hop into a
car, though, she has ruptured discs that could slice her spinal cord if she hits a pothole or her wheelchair bumps floor molding. So McAllister, 64, was
over the moon when her local county health department in Hayward, California, called offering to inoculate her against COVID-19 at home. Two
paramedics with Hayward Fire came last month, jabbed her arm with the one-dose Johnson & Johnson vaccine and stuck around to make sure she
was alright. “Absolutely blessed,” she said of how she felt after receiving her vaccination. As soon as they left, she called her doctors and passed along
the county phone number with this message: “Call this number and get all your homebound patients to call this number.”
https://apnews.com/article/coronavirus-pandemic-health-9ee0f57e25295b3127cf5af2a6041220
17Digital Inclusion Survey Toolkit
Online toolkit: visit agefriendly.acgov.org
18Messages of the Week
• Alameda County offers family days and drop in access for priority neighborhoods. Vaccine will be offered
through county and state partners, health care providers, pediatricians, and pop-up clinics at schools and youth and family
serving organizations.
o Vaccine will be available at some providers immediately and will become available soon at others. Visit our Where to
get a Vaccine page to see a regularly updated list of community, state, and health care providers who are offering
vaccines.
o Visit our youth vaccination facts page for more information.
• You have a choice – get vaccinated or get COVID-19. The longer you wait to get vaccinated, the greater the risk of
contracting COVID-19 and becoming seriously ill or spreading it to a friend, loved one or co-worker.
o Visit our website for more information on all three currently approved vaccines.
• Your mask protects everyone, your vaccine protects you. Still not sure about vaccine or worried about things you
may have heard? Visit Greater Than COVID to view videos by Black and Latinx health care workers who answer questions
about COVID-19 vaccines including toolkits and playlists.
• Doctors, nurses, researchers and promotoras provide facts and dispel misinformation about the COVID-19 vaccines in The
Conversation/La Conversacion, an FAQ video series from the Kaiser Family Foundation with the Black Coalition Against
COVID and UnidosUS.
Join the conversation >
Follow us @Dare2BWell
19Messages of the Week
• Get ready for June 15 by getting vaccinated and wearing masks until more Alameda County residents are
protected from COVID-19. If you have questions about which vaccine is right for you, we encourage you to speak with a
health care provider.
o While the benefits of getting vaccinated far outweigh potential risks, people should become familiar with how
vaccines may impact them.
• Get tested if you are sick – whether you are vaccinated. Even after getting the #COVID19 vaccine, it’s important to
get tested if you have symptoms or have been exposed to someone with COVID-19, or if your job requires that you get
tested.
o If you’re vaccinated and have been exposed to the virus, you may spread it to others, even though you are protected.
Find a testing site near you.
• California’s Beyond the Blueprint Guidance reminds us that highly-effective and safe COVD-19 vaccines are
making it safer for us to reopen. We remind residents and businesses to continue to wear a mask, keep your distance
and operate under the State’s restrictions for Orange Tier counties per the Blueprint for a Safer Economy, which remains in
place until June 15.
o If you aren’t vaccinated yet or haven’t completed your vaccination series, we strongly encourage you to drop in our
community-based sites or make an appointment to protect yourself from COVID-19.
Join the conversation >
Follow us @Dare2BWell
20Thank you
Questions
21Extra Slides
22How Fully &
Equitably are
We Vaccinating
our Alameda County
Population?Some Key Vaccine Equity Measures
1) Vaccination Rates in 16+ Population:
Overall, by Race/Ethnicity, by Zip Code
2) Percentage Distribution of Vaccinations
by Race/Ethnicity vs.
County Population, Cases, & Deaths
24Progress in Vaccination & Vaccine Equity
25
Source: County Vaccination dashboard, 5.24.2126
Alameda County PODs
•   148,031 first doses administered                           Doses Administered by Age Group
    through 5.24.21 at the following sites:                  @Alameda County PODS through 5.24.21
                                                                               23.2%
• St. Rose Hospital
• Lake Merritt BART                                                    17.7%
• Castro Valley Library                              16.2%     16.3%
• Fremont High School, Oakland
• Alameda County Fairgrounds                                                           9.5%
• Fire Pop-Ups                                                                                 7.5%
    • Tiburcio Vasquez (South
                                                                                                       3.4%    3.5%
       Hayward, Union City, San               2.7%

       Leandro/Cherryland)
    • La Clinica (Fruitvale)
Doses Administered by Race/Ethnicity
@Alameda County PODs through 5.24.21
Doses Administered by Gender
@Alameda County PODs through 5.24.21 NHPI, 1.3%
Latino/Hispanic, 0.3%
33.6%
34% Unknown, 5.3%
Unknown/Nonbinary/ 1%
Other, 1.4%
Male, 46.2%
Af.Amer/Black, 5.9%
10%
Asian, 30.9%
White 22.3%
Female, 52.4% 32%
20%
Orange = % of County population over age 16
28What are Vaccination Rates by Race/Ethnicity?
Vaccination Rates by Race/Ethnicity
(% of 16+ Population with at least one dose and fully vaccinated):
Cumulative (thru 5/14/21)
% of Pop 16+ % of Pop 16+
with at least 1 dose fully vaccinated
(cumulative) (cumulative)
100%
87%
% of 16+ Pop by Race/Ethnicity
90%
80% 76%
69%
70% 63%
60% 58%
53% 52% 49%
50% 47% 46%
40% 34% 31%
30%
20%
10%
0%
Native American Pacific Islander Asian White African Hispanic/Latino
American/Black
Note: Rates by race/ethnicity only reflect vaccinated residents with known RE.
29
Does not reflect residents with unknown RE who got at least 1 dose (30%) or were fully vaccinated (20%). Source: ACPHD, with CAIR data through 5.14.21Vaccination Rates by Race/Ethnicity
(% of 16+ Population with at least one dose and fully vaccinated):
In Last Week (5/2-5/8/21)
% of Pop 16+ % of Pop 16+
with at least 1 dose fully vaccinated
(last wk) (last wk)
12%
% of 16+ Pop by Race/Ethnicity
10% 9.5%
8.9%
8.4%
8% 7.3%
6.4%
5.8% 5.9% 5.9% 5.5%
6% 5.2%
4.2%
4% 3.0%
2%
0%
Native American Pacific Islander Asian White African Hispanic/Latino
American/Black
Note: Rates by race/ethnicity only reflect vaccinated residents with known RE.
30
Does not reflect residents with unknown RE who got at least 1 dose (20%) or were fully vaccinated (13%). Source: ACPHD, with CAIR data from 5.2.21-5.8.21Compared to County population & disease/death burden,
how equitably are we vaccinating Alameda County residents?
Racial/Ethnic Distribution of County Population, Cases, & Deaths
vs. Alameda County Residents with at Least One Dose
100%
8% 6% AfrAmer/Black
90% 10% 10%
% of residents by race/ethnicity
80% 18% 16% 17% Latino/Hispanic
20%
70%
60% 50% 23%
38% 46%
50% 32% Asian
40% 20%
30%
16%
20% 36%
34% 30% 30%
10% 17% White
0%
County Pop 16+ Cumulative Cases Cumulative Deaths Residents with Residents with
at least 1 dose at least 1 dose
(cumulative) (last week)
Note: Racial/ethnic percentage (%) distributions only reflect residents with known RE. Does not reflect
31
cases (21%), deaths (6%), or at least 1 dose cumulative (30%) and last week (20%) with unknown RE. Source: ACPHD, with CAIR data through 5.14.21 and County Cases & Deaths Dashboard through 5.19.21Racial/Ethnic Distribution of Alameda County Residents Fully Vaccinated
vs. County Population, Cases, & Deaths
100% AfrAmer/Black
8% 5%
90% 10% 10% Latino/Hispanic
% of residents by race/ethnicity
14% 15%
80% 18%
20%
70%
60% 50% 23%
38% 47% Asian
50% 32%
40% 20%
30%
16%
20% 38%
34% 30% 31%
10% 17% White
0%
County Pop 16+ Cumulative Cases Cumulative Deaths Residents Residents
fully vaccinated fully vaccinated
(cumulative) (last week)
Note: Racial/ethnic percentage (%) distributions only reflect residents with known RE. Does not reflect
32
cases (21%), deaths (6%), or fully vaccinated cumulative (20%) and last week (13%) with unknown RE. Source: ACPHD, with CAIR data through 5.14.21 and County Cases & Deaths Dashboard through 5.19.21Who is vaccinating our Alameda County population?
Cumulative Doses (thru 5/14/21) Given to
Alameda County Residents by Type of Vaccine Provider
Health Care System Partner
10%
Large Pharmacy/Store
2%
4% Coliseum/Pedestrian Village/FEMA Mobile
4% 35%
Community Health Center
7% ≈1.62 Million
Alameda County
Doses
8% Curative
Other County Health Dept - Bay Area
14% 16%
Mobile Pharmacy
Other
Source: ACPHD, with CAIR data through 5.14.21Doses in Last Week (5/2-5/8/21) Given to
Alameda County Residents by Type of Vaccine Provider
Health Care System Partner
Large Pharmacy/Store
10% Coliseum/Pedestrian Village/FEMA Mobile
2%
4% 30% Community Health Center
4%
3% Alameda County
≈110,000
6% Doses
Curative
Other County Health Dept - Bay Area
20% 20%
Mobile Pharmacy
Other
34
Source: ACPHD, with CAIR data for 5.2-5.8.21Who are the largest vaccine providers for Alameda County residents?
Cumulative (thru 5.14.21) Last Week (5.2-5.8.21)
Doses % Doses %
Given of County Total Given of County Total
County Total 1,615,959 109,599
Healthcare System Partners 570,773 35% 33,045 30%
Kaiser 361,894 22.4% 22,349 20.4%
Stanford 77,746 4.8% 5,858 5.3%
Washington Hospital 50,703 3.1% 3,091 2.8%
Sutter 19,424 1.2% 167 0.2%
Alameda Health System 19,946 1.2% 936 0.9%
UCSF-CHO 14,717 0.9% 148 0.1%
Palo Alto Medical Foundation 11,183 0.7% 151 0.1%
John Muir Health 5,625 0.3% 158 0.1%
Dialysis Centers 3,277 0.2% 62 0.1%
One Medical 2,615 0.2% 0 0.0%
Senior Centers 2,131 0.1% 72 0.1%
Santa Rita Jail - Wellpath 747 0.0% 51 0.0%
Fremont Hospital 405 0.0% 0 0.0%
Kindred Hospital 279 0.0% 0 0.0%
Brown & Toland 81 0.0% 2 0.0%
35
Source: ACPHD, with CAIR data through 5.14.21Cumulative (thru 5.14.21) Last Week (5.2-5.8.21)
Doses % Doses %
Given of County Total Given of County Total
County Total 1,615,959 109,599
Large Pharmacy/Store 260,018 16% 22,387 20%
CVS 121,737 7.5% 8,895 8.1%
Walgreens 78,574 4.9% 7,362 6.7%
Safeway, Vons, Pavillions 30,513 1.9% 2,914 2.7%
Rite Aid 20,569 1.3% 2,114 1.9%
Other Large Pharmacy/Store 8,625 0.5% 1,102 1.0%
36
Source: ACPHD, with CAIR data through 5.14.21Cumulative (thru 5.14.21) Last Week (5.2-5.8.21)
Doses % Doses %
Given of County Total Given of County Total
County Total 1,615,959 109,599
Community Health Centers 128,693 8% 6,068 6%
Tiburcio Vasquez Health Center 48,662 3.0% 2,162 2.0%
Bay Area Community Health 23,023 1.4% 1,527 1.4%
Asian Health Services 15,145 0.9% 6 0.0%
Lifelong Medical Care 14,146 0.9% 755 0.7%
Axis Community Health 8,525 0.5% 591 0.5%
Davis Street Clinic 5,654 0.3% 237 0.2%
Native American Health Center 4,184 0.3% 290 0.3%
La Clinica 2,772 0.2% 1 0.0%
Roots Community Health Center 2,493 0.2% 30 0.0%
La Familia 2,371 0.1% 360 0.3%
West Oakland Health 1,718 0.1% 109 0.1%
37
Source: ACPHD, with CAIR data through 5.14.21Cumulative (thru 5.14.21) Last Week (5.2-5.8.21)
Doses % Doses %
Given of County Total Given of County Total
County Total 1,615,959 109,599
Alameda County 112,034 7% 3,371 3%
County/Community PODs 99,028 6.1% 332 0.3%
Healthcare for Homeless 9,463 0.6% 2,630 2.4%
ACPHD Other 3,517 0.2% 408 0.4%
County Other 26 0.0% 1 0.0%
38
Source: ACPHD, with CAIR data through 5.14.21How equitably are our largest vaccinators reaching our County population?
What is working and where can we improve to advance vaccine equity?
Total # with % of Racial/ethnic distribution (%) of people with at least 1 dose (with known RE)
Unknown
at least one County AfrAmer/ Hispanic/ Native Pacific
race/eth Asian Multirace White
dose Total Black Latino American Islander
Overall County Total 1,092,356 30% 8% 38% 16% 1% 0.4% 1.0% 36%
Health Care System Partner 390,880 36% 36% 9% 38% 8% 1% 0.4% 1.0% 43%
Kaiser 256,478 43% 10% 36% 6% 1% 0.5% 1.1% 46%
Stanford 52,172 26% 5% 38% 10% 2% 0.2% 0.9% 45%
Washington Hospital 31,583 21% 3% 54% 11% 2% 0.2% 0.6% 29%
Sutter 11,306 10% 8% 30% 10% 3% 0.2% 1.2% 49%
Large Pharmacy/Store 190,415 17% 33% 6% 44% 12% 2% 0.4% 1.0% 35%
CVS 87,462 31% 6% 45% 12% 2% 0.3% 1.1% 34%
Walgreens 56,391 36% 6% 44% 11% 2% 0.7% 1.1% 34%
39
Source: ACPHD, with CAIR data through 5.14.21Total # with % of Racial/ethnic distribution (%) of people with at least 1 dose (with known RE)
Unknown
at least one County AfrAmer/ Hispanic/ Native Pacific
race/eth Asian Multirace White
dose Total Black Latino American Islander
Overall County Total 1,092,356 30% 8% 38% 16% 1% 0.4% 1.0% 36%
Coliseum/Pedestrian Village/FEMA Mobile 160,189 15% 25% 9% 35% 19% 1% 0.4% 0.8% 36%
Community Health Center 86,803 8% 19% 9% 42% 28% 1% 0.5% 1.1% 18%
Tiburcio Vasquez Health Center 31,796 17% 4% 34% 36% 1% 0.4% 1.5% 23%
Bay Area Community Health 16,050 26% 2% 65% 16% 2% 0.4% 1.0% 14%
Asian Health Services 10,506 9% 1% 97% 1% 0% 0.0% 0.1% 1%
Lifelong Medical Care 8,881 20% 37% 10% 22% 2% 0.4% 0.7% 28%
Axis Community Health 5,663 24% 2% 29% 42% 1% 0.3% 0.7% 24%
Davis Street Clinic 3,973 24% 28% 14% 23% 3% 0.4% 0.8% 32%
Native American Health Center 3,055 13% 10% 13% 56% 3% 5.8% 1.8% 10%
La Clinica 2,118 6% 6% 6% 79% 1% 0.2% 0.5% 8%
Roots Community Health Center 1,673 33% 39% 21% 27% 1% 0.2% 0.9% 11%
La Familia 1,787 29% 4% 15% 64% 1% 0.2% 4.1% 11%
West Oakland Health 1,301 12% 59% 3% 25% 3% 0.1% 1.2% 8%
40
Source: ACPHD, with CAIR data through 5.14.21Total # with % of Racial/ethnic distribution (%) of people with at least 1 dose (with known RE)
Unknown
at least one County AfrAmer/ Hispanic/ Native Pacific
race/eth Asian Multirace White
dose Total Black Latino American Islander
Overall County Total 1,092,356 30% 8% 38% 16% 1% 0.4% 1.0% 36%
Alameda County 78,500 7% 12% 8% 33% 30% 1% 0.4% 1.2% 26%
County/Community PODs 66,643 11% 8% 35% 27% 1% 0.4% 1.2% 27%
Healthcare for Homeless 9,157 14% 9% 17% 59% 1% 0.9% 1.3% 12%
ACPHD Other 2,683 14% 17% 20% 26% 2% 0.4% 0.7% 34%
Other County Health Dept - Bay Area 48,804 4% 30% 7% 44% 14% 1% 0.3% 1.0% 33%
Curative 46,523 4% 21% 5% 24% 13% 1% 0.1% 0.5% 57%
Mobile Pharmacy 23,016 2% 27% 6% 51% 14% 2% 0.3% 1.0% 26%
Other 67,226 6% 38% 3% 37% 21% 1% 0.4% 0.7% 35%
41
Source: ACPHD, with CAIR data through 5.14.21Who are We Reaching & Not Reaching by Zip Code?
4243
Who is Vaccinating our Priority Zips in Alameda County?

                                          % of Residents Vaccinated
                                                in Priority Zips      % of Priority County Total
Community Health Center                               42%                        13%
Alameda County                                        37%                        10%
Coliseum/Pedestrian Village/FEMA Mobile               30%                        17%
Large Pharmacy/Store                                  22%                        15%
Health Care System Partner                            22%                        30%
Other County Health Dept - Bay Area                   18%                         3%
Mobile Pharmacy                                       17%                         1%
Curative                                              11%                         2%

                                                                                                                         44
                                                                                Source: ACPHD, with CAIR data through 5.14.21
Residents Vaccinated with at Least One Dose in Priority Zips
by Type of Vaccine Provider
Health Care System Partner
3%2%1% Coliseum/Pedestrian Village/FEMA Mobile
10%
30% Large Pharmacy/Store
10% Community Health Center
≈285,200
Residents
Alameda County
in Priority Zips
Other
13%
17%
Other County Health Dept - Bay Area
15% Curative
Mobile Pharmacy
45
Source: ACPHD, with CAIR data through 5.14.21Some Ideas & Recommendations to Advance Vaccine Equity
in Alameda County
➢ Establish vaccine equity goals or targets for County vaccine providers by race/ethnicity and for priority
zips.
➢ Obtain and require more complete race/ethnicity data from Kaiser, the County’s largest vaccinator.
➢ Opportunities for systems-level strategizing? Leverage data to inform and strategize with large
healthcare system and pharmacy/store partners on how to increase reach and vaccination of Black/AA
and Latino/Hispanic residents.
➢ Pediatric pop and equity overall
➢ Until Coliseum site closes, any opportunities to tailor/target vaccination efforts in this last stretch?
➢ Mobile-focused strategies?
➢ Establish certain days focused on priority pops?
➢ Extended hours?
➢ Provide opportunity for CHCs to discuss data, share best practices amongst themselves, and strategize
on increasing reach to priority pops/zips (e.g., Latinx and Black/AA, deep/central East Oakland).
46➢ Touch base on best practices/strategies amongst Alameda County sites (e.g., Healthcare for the
Homeless, Community PODs) that are successfully reaching Black/AA and Latino/Hispanic residents.
➢ Ensure Allen Temple POD is staffed and set up in ways that are welcoming to Black/AA and
Latino/Hispanic residents in deep/central East Oakland.
➢ Leverage EO community partners to support POD outreach and staffing (as needed).
➢ Continue and expand mobile strategies reaching priority pops/zips.
➢ Reach out to EO community partners to identify strategic mobile destinations (e.g., schools,
barber shops, churches, multi-unit complexes).
➢ Can utilize vaccination maps at CT level to hyper-focus and expand reach to “cold spots”.
➢ Consider hyper-focused targeted strategies (e.g., workplace, age + race, family-based)
➢ CBO/Vaccine RFQ and opportunities to distribute funds intentionally/equitably
47You can also read