Response to Referee #2 of our manuscript entitled Coastal Impacts of Storm Gloria (January 2020) over the Northwestern Mediterranean ...
←
→
Page content transcription
If your browser does not render page correctly, please read the page content below
Response to Referee #2 of our manuscript entitled
  Coastal Impacts of Storm Gloria (January
 2020) over the Northwestern Mediterranean
  [nhess-2020-75] submitted to Natural Hazards and
               Earth System Sciences.
   Angel Amores, Marta Marcos, Diego S. Carrió, and Lluı́s Gómez-Pujol
                                          May 21, 2020

   Author’s response: We would like to thank the Reviewer for the assessment on our
manuscript and for the comments provided. We have responded to all the concerns raised
below, with indication of the changes in the manuscript:

    Suitability. The subject of the paper, i.e. the study of the Coastal Impacts of Storm Gloria
(January 2020) over the Northwestern Mediterranean falls within the fields covered by NHESS.
    Summary. The paper objective it twofold, concentrating on the shorelines of the eastern Spanish
coasts and the Balearic Islands: (1) quantify at a regional scale the physical mechanisms at play
along the different coastal areas in the basin, including the storm surges and the effect of waves,
and discuss their differences, (2) at a more local scale (Ebro Delta and cliff of the eastern Mal-
lorca Island), simulate the impacts of the storm, accounting for the storm surge and wave setup.
The paper provides key results on the significant contribution of wind-induced storm surge at the
regional scale along the mainland, and wave overtopping at Mallorca cliff site. It also provides
flood modeling results on the Ebro delta. General comment.While the manuscript is very clear, well
written and provides interesting insights in the knowledge of the Gloria storm marine forcings, the
manuscript has some weaknesses which deserve to be tackled before publication: discussion (or
integration?) on neglected marine forcing especially for the local flood investigation and for the
regional model validation (tide, water level fluctuations induced by 3D circulations), the method
used to validate the storm surge model, the validity of regional model to properly estimate wave
setup with a grid resolution of 1-2km. In addition, the manuscript would benefit from a bit more
physical interpretation of the results.
    Major remarks:
    1.Role of neglected processes? 3D Mediterranean circulation induce seasonal water level fluctu-
ations of several centimeters to tens centimeters [Bouffard and Pascual; Larnicol et al., 1995]. For
example, Larnicol et al. [1995] indicate variations of +/- 10 cm at the scale of the whole Mediter-
ranean Sea and of each of the two basins. Such fluctuation is far to be negligible for flood issues in
micro-tidal areas as the study sites. A bit of discussion on this water level contribution during the
Gloria storm would be useful and could reinforce the confidence in the results, if, for instance, this
contribution contributed for almost zero during Gloria storm.

                                                  1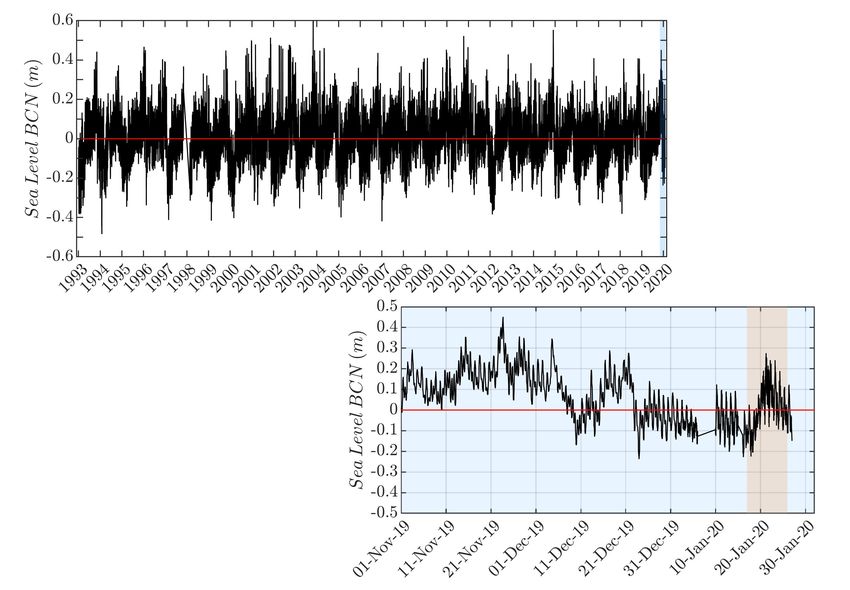
Author’s response: Seasonal sea level changes in the Mediterranean Sea range be-
tween 4 and 8 cm for the annual and 2 and 4 cm for the semi-annual signals, on average
[Marcos and Tsimplis, 2007], in agreement with the magnitude pointed out by the reviewer.
We have explored this baroclinic signal as illustrated in the figure below, corresponding to
the tide gauge record in Barcelona. The time series has been demeaned and detrended.
According to Marcos and Tsimplis [2007], in the western Mediterranean basin the sea level
seasonal cycle peaks between September-November, and decreases afterwards. This is ob-
served in the figure (lower panel). This panel also shows that mean sea level during Storm
Gloria varies around the zero, which corresponds to the averaged mean sea level during the
tide gauge period. Therefore, we conclude that seasonal mean sea level does not add any
further effect that amplified or reduced the impacts of the storm.

Figure 1: Sea level time series at Barcelona tide gauge (upper panel) and zoom of the most
recent period (lower panel)
    In addition, all the modeling experiment seem to neglect the tide. The authors should make more
explicit that they neglect the tide and discuss the implications on the results for the flood investiga-
tions (Ebro Delta and Balearic rocky cliff). Indeed, for instance, the maximum tidal range seems far
to be negligible (0.85 m in Barcelona after http://www.portdebarcelona.cat/en/web/el-port/101#2)
in front of the Gloria storm surge. But what was the tide during Gloria storm?

   Author’s response: There seems to be an error in the tidal range at the site referenced
by the reviewer. The tides in Barcelona, as in most of the Mediterranean Sea are much
smaller. This is observed in the figure above of the previous response. Also, please check

                                                Page 2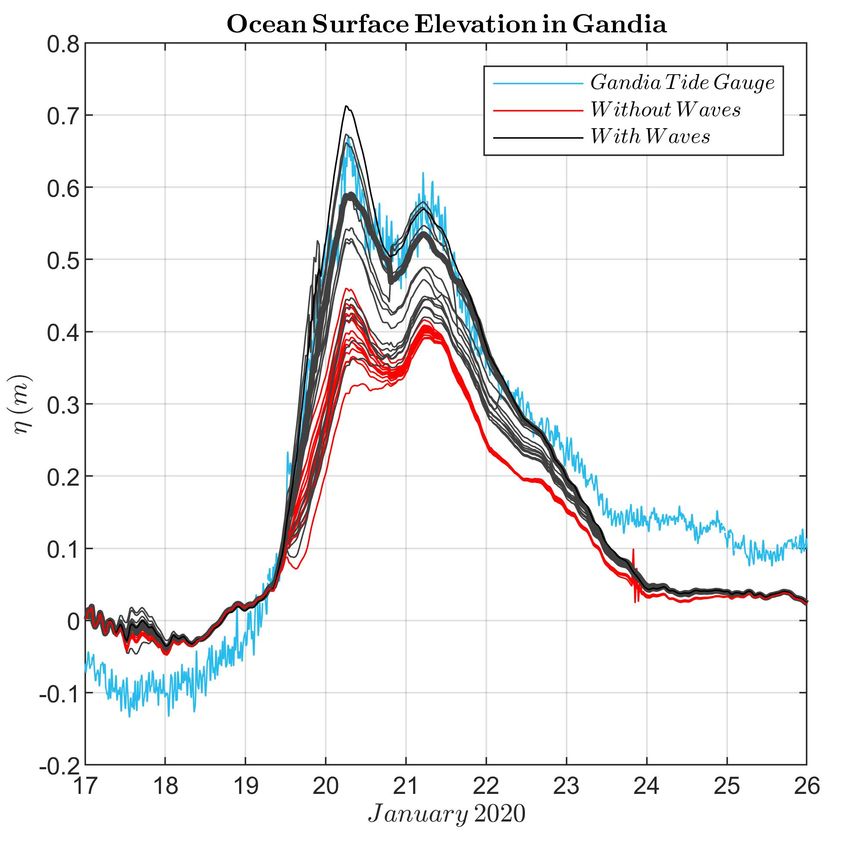
the table below, that has been extracted from the website of the Spanish Port Authority
for the same tide gauge. It lists the tidal harmonics in Barcelona computed for the time
period 1993-2018 (http://www.puertos.es/en-us/oceanografia/Pages/portus.aspx).
The largest tidal constituent is the M2 with 4.60 cm of amplitude. Summation of all tidal
constituents results in a total amplitude of 17.28 cm what makes a maximum tidal range
of 34.56 cm, value that is far from the 85 cm stated by the authorities of the Barcelona
harbour in which seems to be a typo.
    In our simulation we did not consider the tides for the reason outlined above and also
because the storm lasted 3 days and included all tidal phases. We have now specified this
in the text. We have added a sentence in the manuscript indicating that the tides are not
taken into account in the simulation (2nd paragraph in section 2.2).

    2.Model resolution for the wave setup quantification Without more justification, a coastal reso-
lution of 1-2km is probably too coarse to capture the local wave set-up contribution. Either I am
wrong, then the authors should prove that this resolution is enough for their study site. Or I am
true, and then, I am afraid that the authors should remove the analysis of the wave setup contribu-
tion (at the regional scale). But they could probably discuss it for the Ebro Delta, where the grid
resolution falls to 30 meters (and thus is probably fine enough to capture the wave setup).

    Author’s response: We would like to highlight that the comparison between modelled
and observed sea level as measured by tide gauges (Figure 4 in the manuscript) shows a good
agreement, suggesting that our simulation correctly captures the most relevant processes
that are taking place during Storm Gloria. In order to prove this, we are going to focus
our response in the two sites where the wave setup has significantly contributed most to
the total water level modelled along the Mediterranean coast of the Iberian Peninsula, i.e.
the northern side of the Ebro Delta and the region around Denia (see Figure 6 of the
Manuscript). Since the high grid resolution of the Ebro Delta could explain by itself the
good agreement, we are discussing here the results and comparison between model and
observations at Gandia tide gauge which is the closest one to Denia (Figure 4). In the
figure below we show the same comparison as in Figure 4 for Gandia tide gauge, but we

                                              Page 3
have added the ocean surface elevation time series of the simulation without taking into
account the waves (red lines) to the coupled simulation (grey lines). Not accounting for
the wave setup (red lines) underestimates by around 20 cm the observed sea level (blue
line), whereas including the effect of waves (grey lines) decreases this bias. Indeed, the
closest grid point (thick grey line) mimics the amplitude of the observed storm surge. We
thus conclude that the spatial resolution that we are using is enough to, at least partially,
capture the effects of the wave setup.
3.Model validation. First, regarding the wave model results, the manuscript would benefit from
explanations for the Hs underestimation.
Author’s response: This was also a query from Reviewer #1. Possible causes are
a poor quality of the atmospheric forcing, a bad performance of the numerical model or
inaccurate bathymetry. To test the model performance, we repeated the simulation with
the SWAN wave model and obtained the same outputs, so this cause can be discarded. The
atmospheric forcing slightly underestimates the wind during the peak of the storm (see Fig-
ure 1 in S.M), which might have an effect together with the possibly limited representation
of the bathymetry.
We have added a discussion on the possible causes of the underestimation of Hs (section
2.3, 2nd paragraph).
Second, and more importantly, I have some doubts with the method which consists in comparing
the water level model outputs in the 5km radius to the local tide gauge measurements. Indeed,
depending on the grid points, some points may include a part of the wave setup (probably less
Page 4than the reality due to the too coarse resolution of the model, except close to the Ebro delta area),
others not. As illustrated in Figure 4, there is a strong variability in the model outputs in the 5km
radius, which makes not fully convincing the conclusion of a model providing satisfactory prediction
compared to the tide gauge measurements. I would suggest at least to add the model outputs of
the nearest point to the tide gauge (simulation #1 and #2). In theory (if the grid resolution is high
enough to capture the wave setup), the tide gauge measurements should be comprised more or less
between the results of simulation #1 and #2, for the nearest point. If there are discrepancies, the
authors could discuss the location and resolution of the model close to the tide-gauge (with maps)
and also discuss the local knowledge of wave setup contribution to the tide gauge measurements.
To contribute to provide a clearer validation and keep the 5km radius, another idea could be to plot
all the model outputs for simulations #1 (first) but with a colorscale (on the time series of model
outputs) indicating the distance of the model outputs to the tide gauge, and put in thick line the
closest point (together with the tide gauge observation of course). The same figure could be done
with the simulations #2 (together with the tide gauge observation of course). Of course, the authors
are free to follow other ideas, as long as it makes the validation clearer by at least showing results on
the closest point. I think this an important issue. Refining the validation could also help identifying
to which extend the seasonal water level fluctuations induced by 3D circulations are negligible or
not during the Gloria storm.
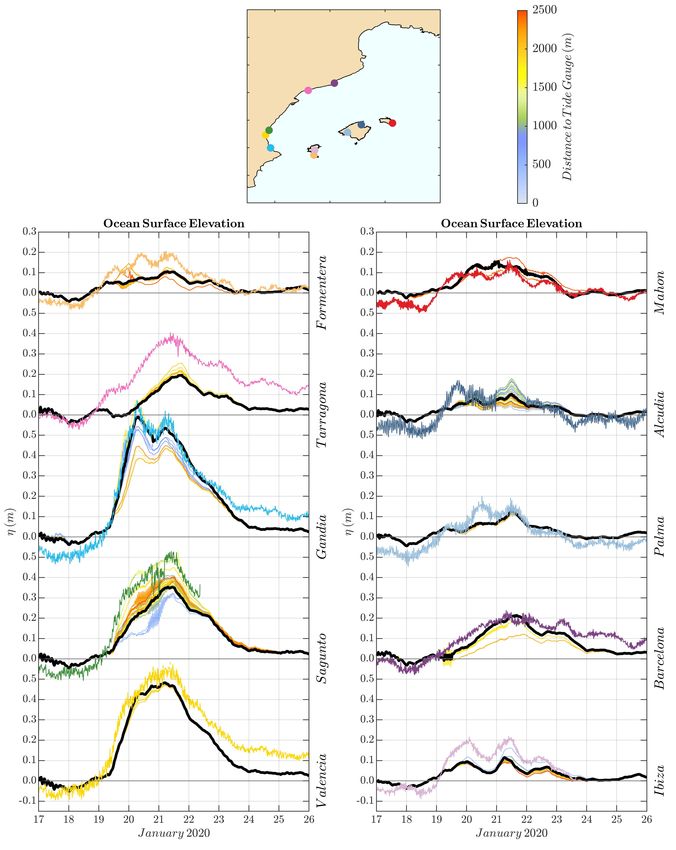
Author’s response: We have explored different options to meet the reviewer require-
ments and we decided that the best one is to represent the time series of the modelled
points within a radius of 2.5 km to the tide gauge location and indicating the closest grid
point with a thicker line (see the new Figure 4).
We also produced alternative figures following reviewer’s recommendations, including a
different color lines depending of the distance for grid point (see the figure below). This
format is, in our opinion, less clear and hinders its interpretation. In addition, we also
produced a figure merging the results of simulations #1 and #2 (not shown here) but
again it looked too messy. We hope that the reviewer’s concern about the ability of the
model in resolving the wave setup was satisfied with the answer to the question #2. The
results showed essentially the same conclusions as in our example for Gandia tide gauge
discussed above.
We hope that the new Figure 4 is more satisfactory for the reviewer.
Page 5“On-line” Remarks:
- Title: for me, the main focus of the paper is not on providing information on coastal impacts,
but more on investigating the relative forcing contributions. I would suggest to modify the title to
better illustrate the paper content.
Author’s response: We have carefully considered reviewer’s criticism regarding the
title of the manuscript. We understand the reluctance to focus on the impacts, since
we interpret that the reviewer associates the term ”impacts” to only our two case studies.
However, to our view, coastal impacts refer to the effects that the storm had on the physical
mechanisms acting along the coast and that included the storm surges and waves. In this
sense, and this was our initial purpose, we want to highlight the marine impacts along the
coasts of the Western Mediterranean of Storm Gloria. We have been trying to figure out
a not too long title that accounts for regional as well as local effects, but without success
(our best approach is the first sentence of the abstract). Among all the alternatives, our
preferred is the current title and we would like to keep it as it is.
- Abstract: The abstract could be a bit more informative regarding the key results.
Page 6Author’s response: We are limited here by the maximum allowed length of the
abstract, between 100 and 200 words. We are currently using 209 words which makes it
impossible to extend without removing some of the major results that are highlighted.
- Line 38: please provide the geographical coordinates of the Mahon buoy.
Author’s response: The coordinates have been introduced in the text.
- Line 72: Figure 4 is called before Figure 3 − > reorder the figures?
Author’s response: Thanks for spotting this error. We have decided to switch the
order of the text instead of the figures (change in 2nd and 3rd paragraph in section 2.3)
- Line 85: “contains” − > “contain”
Author’s response: The whole sentence is: This small region covering the Delta and
its surroundings contains around 75% of the grid nodes.; as the subject is ”This small
region”, the verb should be contains.
- Line 104-107: Test 3 & 4 are done with the 2DH hydrodynamic model or with the coupled
model? If the first case, the authors should make it more explicit, and then in Lines 107-108 stress
that these tests 3 and 4 are used to estimate the contribution of Patm and wind on the atmospheric
storm surge.
Author’s response: The simulations #3 and #4 are done with the 2DH hydrody-
namic model (i.e. uncoupled). It is written in lines 112-113 that the simulation #3 is ”a
hydrodynamic model run forced only by atmospheric pressure” and that the simulation
#4 is ” a hydrodynamic model run forced only by wind”. Moreover, in lines 115-116 it is
indicated that ”the contribution of the atmospheric pressure (wind) was determined with
the run #3 (#4)”.
- Line 110-112: not clear if the 0% and 3% come from theoretical analysis or from the modeling
results. Please clarify.
Author’s response: This values come from the modelling results. We have modified
the text in line 119 to clarify this issue.
- Line 121-132: it seems that steady forcing conditions (for SWASH) are used in terms of wave
spectrum and still water level. More justification/explanation of this choice and its implication
would be welcome.
Author’s response: We have used the steady conditions because we aim at determin-
ing the minimum significant wave height needed to have overtopping on the cliffs. So we
have used a range of values of Hs . This is now explained in the manuscript (last paragraph,
section 2.2).
Page 7- Line 129: “an initial integration time of 0.05 s” − > “an initial computation time step of 0.05
s”.
Author’s response: This change has been introduced.
- Line 131: “0,5 m” − > “0.5 m”
Author’s response: This change has been introduced.
- Line 149: explain/justify why the tide gauge data have been low-pass filtered using a Butter-
worth filter with a cutoff period of 30 minutes. I guess this is due to some local physical reasons,
but some justification would be welcome.
Author’s response: The reviewer is right. We low-pass filtered the time series of the
tide gauges to remove the signal of the resonant modes of the harbours which are usually
less than 30 minutes. We have included a sentence clarifying the reason of this filtering
(last paragraph, section 2.3).
- Line 161: add a subsection title?
Author’s response: We did not add a subsection on purpose. We first describe the
regional results of the model runs and then use subsections only for the two case studies.
- Line 164: not sure the authors can use “ocean” for the Mediterranean Sea − > reformulate?
Author’s response: In this case we use ocean as a synonym of sea, since it is used
very closed to the word sea: ”...together with the ocean responses in sea surface elevation”.
- Line 174-175 / “This pattern is caused by the winds blowing towards the mainland”: I do not
fully agree. Indeed, for me, the results are also strongly influenced by the bathymetry. I remind
that the analysis of the 2DH shallow water equations show that wind-induced storm surges increase
with decreasing water depth (see e.g. Flather [2001]). I think the authors could easily check it using
their simulation results (by having a look on 2D spatial maps of simulation #4). This remark leads
also to the suggestion to add a bathymetric map in the paper. This will support the analysis of the
forcing contributions.
Author’s response: We agree with the reviewer. The shallow waters along the coasts
of the mainland play a role in the magnitude of the storm surges. We have added a line
in this respect to clarify the sentence (2nd paragraph, section 3). We have also followed
reviewer’s recommendation and we have modified Figure 1 to include bathymetric lines that
will facilitate the interpretation of the new sentence.
- Line 207-210: these sentences are not clear to me. Please clarify.
Page 8Author’s response: We have rewritten the sentence, that now reads:”The satellite
image indicates that the extension of the flooding caused by the storm was larger than
that obtained in our simulation. We explain this apparent discrepancy by the fact that we
do not account for the flooding caused by the heavy rains that were reported in the area;
instead, our results identify the extent of the flooding caused solely by the marine hazards.”
- Line 204-214: the comments on the validation/comparison of the model results in terms of
flood are not really clear to me. Indeed, when I compare the Copernicus map and the model results,
the model seems to provide a larger flooded surface, but predict no flood in one of the N-E area,
while there was flood. This this is not clear to me why the authors seem to think that the model
underestimates the flood. The manuscript would probably benefit from quantitatively comparing
the Copernicus map and the model results, for instance with a map showing the following classes:
Copernicus and model predict no flood; Copernicus and model predict flood; Copernicus indicates
flood, but the model predicts no flood; Copernicus indicates no flood, but the model predict flood
; Copernicus and the model predict no flood. If not accessible, the Copernicus map could be
digitized. In addition, at the Ebro scale, this could be interesting and relevant to investigate the
spatial variations relative contribution of wave set-up, pressure induced and wind induced storm
surges (more in details that in figure 6).
Author’s response: We would like to remark that, according to the reports, part of
the flooding in the Ebro Delta during Storm Gloria was caused by heavy rains. These are
not included in our simulation and therefore a direct quantitative comparison would not
make sense. Our purpose here was to estimate as accurately as possible the marine-induced
flooding. We added the comparison to the satellite image to argue that the extension of
the modelled flooding was realistic. In this respect, we feel that we have achieved our goal
with the map we have represented in Figure 7 that shows the areas that, for sure, were
flooded by salty water.
- Legend of Figure 2: “c and c” should be “a and c”?
Author’s response: This change has been introduced.
References
Bouffard, J., and A. Pascual (), A review of altimetry Applications over European Coasts
(invited talk), Second Coastal Altimetry Workshop, Pisa, Italy.
Flather, R. A. (2001), Storm surges, Encyclopedia of Ocean Sciences, edited by: Steele, J.
H., Thorpe, S. A., and Turekian, K. K., p. 2882–2892.
Larnicol, G., P.-Y. Le Traon, N. Ayoub, and P. De Mey (1995), Mean sea level and surface
circulation variability of the Mediterranean Sea from 2 years of TOPEX/POSEIDON
altimetry, Journal of Geophysical Research: Oceans, 100 (C12), 25,163–25,177, doi:10.
1029/95JC01961.
Marcos, M., and M. N. Tsimplis (2007), Variations of the seasonal sea level cycle in southern
Europe, Journal of Geophysical Research: Oceans, 112 (C12), doi:10.1029/2006JC004049.
Page 9You can also read