EFFECT OF GEOMETRY AND OPERATIONAL PARAMETERS OVER THE DEHUMIDIFICATION PERFORMANCE OF A DESICCANT COATED HEAT EXCHANGER - ashrae
←
→
Page content transcription
If your browser does not render page correctly, please read the page content below
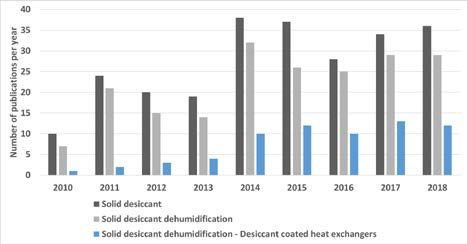
2020 Building Performance Analysis Conference and
 SimBuild co-organized by ASHRAE and IBPSA-USA

 EFFECT OF GEOMETRY AND OPERATIONAL PARAMETERS OVER THE
DEHUMIDIFICATION PERFORMANCE OF A DESICCANT COATED HEAT EXCHANGER
 Ming Qu,1 Thomas Pablo Venegas,1 Kashif Nawaz,2 and Lingshi Wang2
 1Purdue University, West Lafayette, IN
 2Oak Ridge National Laboratory, Oak Ridge, TN

 temperatures, and therefore, a reheat process must follow
 ABSTRACT the undercooling process. This process produces an
 Solid desiccant dehumidification systems are an energy expenditure in undercooling and in reheating,
 alternative to dehumidification systems through with only a fraction of it being used for actual
 condensation. They use solid desiccant materials to dehumidification. Based on this situation, research has
 adsorb the moisture in the process air for space cooling. sought an alternative dehumidification process that does
 There are two configurations of the solid desiccant not rely on the cooling to the dew point of ventilation air.
 dehumidification system: desiccant wheels and desiccant One promising alternative is the use of desiccant
 coated heat exchangers (DCHE). materials, that make use of the affinity of water
 Previous studies focused on the effect on molecules in the air, to remove those molecules to a
 dehumidification performance using different desiccant different medium, and then supply the dehumidified air
 materials on the DCHE. However, the performance of into the occupied rooms (Liu 2019). Among those
 dehumidification remains to be quantified because the technologies, the use of solid desiccant materials has
 geometrical and operational conditions of the DCHE attracted much research interest, and specially, the use of
 also play an essential role in its dehumidification solid desiccant coated heat exchangers has received
 performance for a given desiccant material. Therefore, it increasing attention in the last years, as the results
 is important to evaluate their effects on dehumidification published on Scopus of the number of publications, as
 performance through modeling to assist in component shown in Figure 1.
 design and operation. This paper provides the details of
 a one-dimensional heat and mass transfer model
 developed for this purpose. The model uses an implicit
 finite difference scheme to solve the governing
 equations, which represent the heat and mass balances in
 the control volume. The heat balances are evaluated for
 the airflow, water flow, tube, desiccant, and fin. The fin
 and solid desiccant are considered as having the same
 temperature. The mass balances are evaluated for the
 airside and the solid desiccant material. The outlet
 humidity results for dehumidification and regeneration
 showed a deviation lower than 15% from the experiment Figure 1 Publications on solid desiccant
 for most of the time. Still, the outlet temperature showed dehumidification collected in Scopus, accessed on
 more difference, with results outside the 15% deviation 2019-11-05.
 range. The model temperature results also showed a
 faster change than the experiment. The model developed There are two common configurations of solid desiccant
 can be used to assist in the optimization of component dehumidification systems: desiccant wheels (DW) and
 design and operation for the best dehumidification desiccant coated heat exchangers (DCHE) (Saeed and
 performance. Al-Alili, 2017). In the DW process, air flows through
 desiccant coated channels where air moisture content is
 INTRODUCTION adsorbed. Meanwhile, one angular section of the rotating
 Air dehumidification is a common and important process disk is performing a dehumidification process. Another
 in air conditioning. Air humidity affects human thermal section is being regenerated at the same time by the
 comfort and health (ASHRAE, 2017). The process inflow of hot, dry air. DW mechanical configuration is
 commonly used nowadays for dehumidification on relatively simple and can provide a continuous supply of
 commercial air conditioning systems is the undercooling dehumidified air. However, the use of DW has some
 of process air below its dew point, which produces the drawbacks that limit its application. Because of the
 condensation of the air moisture. However, this process adsorption heat being released during the adsorption
 seriously undercools the air below comfortable supply process, they tend not to be able to thoroughly saturate

 © 2020 ASHRAE (www.ashrae.org) and IBPSA-USA (www.ibpsa.us). 332
 For personal use only. Additional reproduction, distribution, or transmission in either print or digital form is not permitted without
 ASHRAE or IBPSA-USA's prior written permission.
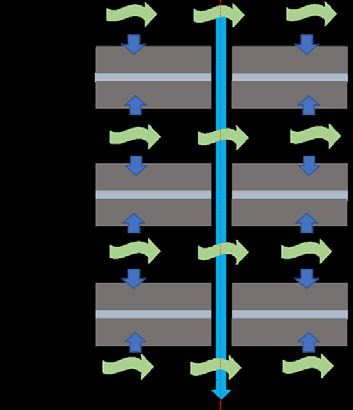
the desiccant material (Vivekh et al. 2018). DW based- assumed. Unlike the other parameters, it was found that
systems require of sensible cooling devices located varying the fin thickness did not produce significant
downstream and in series with the DW (Nie 2017). changes in DCHE performance (Jagirdar et al., 2018).
DCHE presents advantages over DW that explain the These studies show that the design parameters and
interest to study them. By being internally cooled, DCHE operating conditions of the DCHE influence its
can reach higher desiccant saturation. Internal cooling performance. The parametric evaluation of operational
also allows the DCHE to act over the sensible load of the variables shows that for a given DCHE design,
process air, which for specific applications and DCHE optimization of operational parameters is required to
design, may allow dispensing with auxiliary sensible ensure the highest possible moisture removal. Therefore,
cooling devices downstream from the DCHE. However, the adequate selection of desiccant material, design of
this comes at a cost. A DCHE cannot perform heat exchanger, and selection of operational conditions
dehumidification and regeneration at the same time as a are required processes to obtain the highest moisture
single DW unit can. To overcome this limitation, at least removal from a DCHE device. Therefore, it is important
two units of DCHE should be placed in parallel, one to evaluate their effects on dehumidification
performing dehumidification while the other is being performance through modeling to assist in component
regenerated. design and operation.
Previous studies (Zheng et al. 2015, Zheng et al. 2016, In this article, a model to simulate a section of a solid
Xu et al. 2019, Vivekh et al. 2019) evaluated the effect desiccant coated heat exchanger has been developed and
on dehumidification performance of using different compared to an experimental reference for validation.
desiccant materials on the DCHE. Operational The model describes the heat and mass transfer
parameters such as air velocity, water mass flow rate, phenomenon, which takes place inside a representative
and hot and cold water temperatures have been studied control volume of the heat exchanger. Following this
previously for given DCHE geometries and study, the model will be expanded to represent the
configurations (Hu 2015 et al., Xu 2019 et al., Jagirdar complete geometry of the desiccant coated heat
2018 et al., Vivekh 2019 et al.). Decreasing water exchanger. The paper presents the main assumptions,
cooling temperature, and increasing regeneration water governing equations, validation process, and the
temperature was found to increase the amount of performance-prediction of the model, as wells as shows
moisture removal by the DCHE (Hu 2015 et al., Vivekh the capabilities of it as a research and element design
et al. 2019, Xu et al. .2019). The air velocity and water tool.
mass flow rate were also found to have an impact over
DCHE moisture removal, with lower velocity and higher HEAT AND MASS TRANSFER 1-D
water mass flow rates producing more moisture removal MODEL OF DCHE
(Jagirdar et al., 2018). Design parameters such as fin A desiccant coated heat exchanger (DCHE) is similar to
pitch, external tube diameter, fin thickness, and solid a typical finned coil heat exchanger, but with a thin layer
desiccant thickness have been evaluated in previous of solid desiccant coated on the surfaces of fins. Air
works (Ge 2011 et al., Jagirdar 2018 et al., Vivekh et al. crosses the largest face of the DCHE through the
2019). A decrease in fin pitch was found to increase channels formed between the fins. Water flows inside the
moisture removal, although it increases the required fan tube, which crosses the fins perpendicularly, describing
power (Ge 2011 et al., Jagirdar et al., 2018). The effect a folded path with several passes crossing the main face
of the external tube radius was studied (Ge et al. 2011), of the DCHE.
finding that by increasing the outer tube radius, it Therefore, a DCHE can be described as having at least
produced an increase in moisture removal. Different two scales of relevance for dehumidification, one
geometrical configurations of fin and tubes in the DCHE representing the path of the air, and its residence time
were evaluated (one tube row, two staggered tubes rows, between the desiccant coated fins, and the other one for
three staggered tubes rows, and annular fins) (Vivekh et water.
al., 2019). It was found that two staggered tubes and the A diagram of the cross-section of a DCHE, including
use of annular fins produced higher moisture removal several air channels between fins at the dehumidification
than the alternatives. The effect of increasing the stage, is shown in Figure 2. The model for the first scale
desiccant layer thickness over mass transfer was is a 1-D model of the air channel between two fins. By
evaluated (Jagirdar et al., 2018). An increase in the assuming symmetry above for the air channel and below
desiccant layer thickness increased moisture removal. for the half of the metallic fin, this section includes half
However, it was only evaluated for their effect over the of one fin, its desiccant coating layer, and half of the air
mass transfer and not its effect over heat transfer because channel above it, as shown inside of the dashed box in
a uniform fin and desiccant temperature has been Figure 2.

© 2020 ASHRAE (www.ashrae.org) and IBPSA-USA (www.ibpsa.us). 333
For personal use only. Additional reproduction, distribution, or transmission in either print or digital form is not permitted without
ASHRAE or IBPSA-USA's prior written permission.
the 1st scale 1D model can be called, changing the
 temperature conditions of the tube and water for each
 one, according to the energy balances on the elements of
 the 2nd scale.
 There are several assumptions made to represent only the
 relevant factors for dehumidification or regeneration that
 take place in the control volume. The assumptions
 considered are the following:

 1. Uniform distribution of fins and tubes in the
 DCHE.
 2. The desiccant material and the metallic fin are
 at the same temperature.
 3. Neither heat nor mass transfer exists on the Y
 direction for either desiccant or airstream.
 4. The water and tube temperatures are uniform
 for each air channel segment.
 Figure 2 Air channels and fins in DCHE
 5. Adsorption heat is released into the desiccant
The model for this scale represents the actual heat and material only.
mass transfer interactions between the solid desiccant 6. Both water and air move in one direction
and the air. Therefore, it must include the information 7. No binder material is between solid desiccant
regarding the adsorption process itself, such as the and metallic fin.
adsorption isotherm curve of desiccant material, heat of
adsorption, convective heat, and mass transfer between By discretizing the air channel and solid side along the
solid desiccant and air. Between air and the desiccant airflow path axis, two different control volumes are
layer, there is convection heat exchange. Heat is stored presented. The first one represents the unobstructed
on the mass of the DCHE (desiccant layer, metallic fin, section, not in contact with the tube, and at the center of
and water tube) and the moisture adsorbed by the the air channel path, the control volumes would be in
desiccant. Between the exterior surface of the water tube contract with the tube exchanging heat with it.
and the desiccant and metallic fin section in contact with The governing equations for the energy balances of air,
it, there is conduction heat transfer. Between the solid side, tube, and water are following.
desiccant layer and fin elements located in different Equation (1) shows the energy balance for the airflow.
positions along the air channel, there is also conduction The first term on the left-hand side (LHS) represents the
heat transfer. Finally, convection heat transfer takes convective heat exchange between the air and solid
place inside the tubes, which produces heat exchange desiccant, the following term represents the heat
between the water and the interior surface of the tube. exchange present in the central elements between the
The model for the second scale represents the energy exterior surface of the water tube and the air, the third
balance in 1-D for the two main elements of this scale, term represents the temperature gradient along the
the water tube and the water itself. The water can supply airflow direction, and the term on the right-hand side
or receive heat from the tube, while the tube stores part (RHS) of the equation represents the change in
of that heat and transfer the rest by conduction to the fin temperature in time for a given cross-section of the air
elements and the next section of the tube. Therefore, in channel.
this direction, energy balances are calculated for the
water and the tube. The heat transfer mechanism ℎ ∙ ∙ ( − )+ℎ ∙ ∙ ( − ) − ∙ ∙

between the water and the tube is convection. , ∙ ∙ ∙ = ∙ , ∙ ∙ ∙

Meanwhile, the heat transfer mechanism between the (1)
tube and the solid side of the fins is conduction. The Equation (2) shows the energy balance on the solid side
water flow only acts as a heat sink or supply. Therefore (solid desiccant and fin). The first term on the LHS
there are no mass exchanges associated with this phase, represents the heat conduction between elements. The
and water mass is conserved along the vertical direction. second term represents the heat gain due to the release of
Along the main direction of the 2nd scale, a sequence of adsorption heat to the desiccant material. The third term
fins and air channels is found. Then, to model the represents the convective heat exchange between air and
behavior of the DCHE in this scale, several iterations of desiccant, while the fourth term only applies to the center

© 2020 ASHRAE (www.ashrae.org) and IBPSA-USA (www.ibpsa.us). 334
For personal use only. Additional reproduction, distribution, or transmission in either print or digital form is not permitted without
ASHRAE or IBPSA-USA's prior written permission.
elements and represents the conduction heat exchange represent the water adsorption isotherm curve for the
between the solid section (solid desiccant and fin) and specific desiccant material used in the model.
the exterior face of the water tube. On the RHS, the term For the validation procedure, the desiccant material used
stands for the heat storage on the solid desiccant, fin and in the reference (Tu et al. 2017) has been implemented
adsorbed moisture. in the model. On the reference work, an empirical
� ∙ ∙ , + ∙ ∙ , � ∙
 2
 + ℎ , ∙ ∙ ( − expression for the water adsorption isotherm curve is
 2
 +
 provided. Table 1 presents the water adsorption curve for
 ) ∙ ∆ − ℎ ∙ ∙ ( − ) − ( )∙ different ranges of relative humidity, and Table 2

 + presents the relative humidity values for each section.
( ) ∙ ( − ) = � ∙ ∙ , ∙ + ∙ ∙

 , ∙ + ∙ ∙ , ∙ � ∙
 Table 1 Water adsorption isotherm for validation
 SECTION WATER ADSORPTION ISOTHERM
(2) I: −6 2.241
 = 0.133 ∙ (−1.12×10 ∙(− ∙ln( )))
 II: = 0.224 − 0.0004 ∙ ( ∙ ln( ))
In Equation (3), the energy balance for the water tube is
 III: = 2.235 ∙ (−0.472∙(− ∙ln( )))
 0.332
shown. The first term on the LHS represents the
convective heat exchange between water and the interior
surface of the tube while the second term represents the Table 2 Ranges of relative humidity for water
conduction heat exchange between the tube and the adsorption isotherm for validation
central elements of the solid side (solid desiccant and SECTION RELATIVE HUMIDITY RANGE
fin). The term on the RHS represents the heat stored on I: 0% – 3%
the analyzed section of the water tube. II: 3% - 30%

ℎ ∙ ∙ ( − ) − ( ∙ ) ∙ ( ∙ ) ∙ ( − III: > 30%

 ) = ( ∙ ∙ ) ∙ (3) Following, auxiliary equations for terms used in the

 governing equations are shown.
Following the approach by Jagirdar et al. (2018), the The Nusselt number used to calculate the convection
water-energy balance considers that the change of heat transfer coefficient between air and desiccant is
energy in the water flow is equal to the convective heat based on Ge et al. (2011), shown in Equation (7).
transfer between the water and the inner tube surface.
 ℎ = 0.332 1/2 1/3 (7)
 ̇ ∙ ∙ ( − ) = ℎ ∙ ∙ ( − )
(4) Convective heat transfer for the heat exchange between
 the water and air are based on the Nusselt number
On the LHS of Equation (5), the first term shows the provided by Karava and Qu (2018), and shown in
convective mass transfer between solid desiccant and air, Equation (8).
while the second term represents the gradient in moisture
content along the airflow direction. On the RHS of the ℎ = 0.683 0.466 1/3 (8)
equation, the term describes the change in moisture
content in time for a given element. Adsorption heat for the desiccant material used in the
 validation procedure is based on the value provided by
ℎ , ∙ ∙ ( − ) − ∙ ∙ , ∙ ∙ = ∙
 Tu et al. (2017).

 , ∙ ∙ (5)

 ∆ = 2662 [ / ] (9)
Based on Ge et al. 2011, the first term on the RHS in
Equation (6) represents the convective mass transfer The Nusselt number expression used to calculate the
between the solid desiccant and air, while the second convective heat transfer between water and tube is based
term represents the change in adsorbed moisture on the on Karava and Qu (2018), shown in Equation (10).
solid desiccant.

 �8��( −1000) �
ℎ , ∙ ( − ) − , ∙ ∙ = 0 (6) ℎ = (10)
 0.5 2
 1+(12.7)� � � �3 −1�
 8
 −2
An additional equation is required to solve the governing = �(0.79 ∙ log( )) − 1.64� (11)
equations. This equation is the water adsorption isotherm
curve of solid desiccant material. This equation must

© 2020 ASHRAE (www.ashrae.org) and IBPSA-USA (www.ibpsa.us). 335
For personal use only. Additional reproduction, distribution, or transmission in either print or digital form is not permitted without
ASHRAE or IBPSA-USA's prior written permission.
Convection mass transfer coefficient between air and Table 4 DCHE operational characteristics for
solid desiccant is calculated using Equations (12) and validation
(13), by Ge et al. (2011). PARAMET DEHUMIDIFICAT REGENERATI
 ER ION ON
 ∙ ∙
ℎ , = (12) Air inlet 30 30
 4∙
 temperature
 −2
 [C]
 0
 = 0.00002302 � �� � (13) Air inlet 0.01604 0.01604
 101310 256
 absolute
 humidity
An implicit finite difference scheme has been used to
 [kg/kg]
solve the partial differential equations. The main
 Air speed 1.54 1.54
boundary conditions are the inlet temperature and
 [m/s]
absolute humidity conditions of the airflow, which are
 Process time 600 600
constant for the complete time of the simulation. For the [s]
solid energy balance equation, a gradient of zero for heat Initial 0.05 0.55
conduction at the elements of the extremes is the moisture
boundary condition. content on
 desiccant
MODEL VALIDATION
 [kg/kg]
The experimental work published by Tu et al. (2017) has Initial 47 27
been selected for model validation. The authors of the desiccant
reference published their experimental evaluation of a temperature
DCHE along with a detailed spreadsheet of their [C]
experimental measurements of water inlet/outlet
temperatures and air outlet temperature and humidity. The simulation results have compared the outlet
The constructive characteristics of the DCHE of the conditions of the experiment published, including air
experiments in the reference are listed in Table 3. outlet temperature and air outlet absolute humidity.
 In the experiments, both air and water conditions are
 Table 3 DCHE design characteristics for validation measured each at one point both at the inlet and outlet of
 PARAMETER VALUE each fluid into the DCHE. The 1D model of the air path
 Air channel length 0.044 m section represents the complete air channel length, for
 Air channel width 0.00675 m one half of each section between two fins, assuming
 Water-tube radius 0.00476 m symmetry, For the waterside, only one segment is
 Air channel height 0.00105 m included in the current 1D model formulation. The
 Desiccant height 0.0002 m experimental results are measured at only one position
 Fin height 0.00015 m downstream from the DCHE, measuring average
 Desiccant material Composite LiCl 16%w on conditions.
 SG matrix Since the experimental measurements of the reference
 Desiccant density 800 / 3 represent average conditions, the inlet water temperature
 Desiccant specific heat 1200 / for the model has been adapted from the experimental
 Desiccant thermal 5.27 / values. The outlet conditions of a segment located at the
 conductivity center of the cross area of the DCHE are expected to be
 Desiccant max sorption 0.55 / closer to the average measured conditions, than the outlet
 capacity
 conditions of a segment located near either the beginning
 Fins Aluminum
 of or the end of the water tube path. For this center
 Tube Copper
 element, the inlet water temperature is expected to be at
 a value average between measured inlet and outlet
For the validation, the input variables based on the data temperatures. For the current formulation of the first
of the reference are implemented in the model. They scale model, only one water tube segment considered,
include water inlet temperature, the geometric and which represents a small fraction of the water tube
physical properties of the DCHE, and its component inertia. The experimentally measured DCHE contains
materials. The operational conditions of the the equivalent of 7888 modules of the first scale model.
dehumidification process of the reference are in Table 4. Therefore, the heat stored by the tube would be
 underestimated and consequently influence the amount

© 2020 ASHRAE (www.ashrae.org) and IBPSA-USA (www.ibpsa.us). 336
For personal use only. Additional reproduction, distribution, or transmission in either print or digital form is not permitted without
ASHRAE or IBPSA-USA's prior written permission.
of heat transferred from the water. This situation is to a fast increase as the inlet water starts reducing its
described in the analysis of the result of the validation of temperature until reaching the 25 [°C] used for
each cycle. dehumidification from the 50 [°C] used for regeneration,
 and also a faster decrease than the experiment until
Figure 3 and 4 are the comparisons of the results of the reaching temperatures close to 27[°C] after 100 [s]. It
model (continuous line) and the experimentally could be due to the lower thermal capacity present in the
measured values (dashed lines). 1-D model, than what is expected of the complete
 DCHE.
 Figure 5 and 6 show a comparison of the experimental
 and model values by providing a band of +15% to -15%
 deviation as reference for the exactitude of the model, as
 used by Ge et al. (2011).

 Figure 3. Dehumidification, air outlet absolute
 humidity
Figure 3 shows that beyond the initial 100 seconds, the
results of absolute air humidity closely match the
reference values both in absolute values and general
curve behavior. The deviation from the experimental
results for the initial 100 [s] is also present in the Figure 5. Dehumidification, air outlet absolute
temperature results in Figure 4 below. humidity

 Figure 6. Dehumidification, air outlet air temperature
 Figure 4. Dehumidification, air outlet air temperature
 Despite the deviations shown for the initial 100 [s], the
In Figure 4, the temperature results show a larger comparisons using the +15% to -15% deviation band
deviation from the experimental values, until close to show that a significant share of the model results is inside
300 seconds. This deviation suggests a faster thermal that band, providing evidence of the capabilities of the
response from the model than the measured values, due

© 2020 ASHRAE (www.ashrae.org) and IBPSA-USA (www.ibpsa.us). 337
For personal use only. Additional reproduction, distribution, or transmission in either print or digital form is not permitted without
ASHRAE or IBPSA-USA's prior written permission.
model for describing the dehumidification process beginning of the process, and it remains significantly
accurately. higher to the measured values for the complete
Figure 7 and 8 show the results of the model simulation regeneration process, even though the curve behavior is
(continuous line) and the experimentally measured similar to the experimental results.
values (dashed lines) when the DCHE is operated in the Figure 9 and 10 show a comparison of the experimental
regeneration stage. and simulated values for air absolute humidity and
 temperature, but providing a band of +15% to -15%
 deviation as reference for the exactitude of the model.

 Figure 7. Regeneration, air outlet absolute humidity
The regeneration values from modeling results tend to be
further away from the measured values than for the case
of dehumidification. It can be influenced by the smaller Figure 9. Regeneration, absolute outlet humidity
thermal capacity of the model compared to the actual comparison
DCHE, and the larger temperature differences between
water and solid phase that take place during
regeneration, as compared to dehumidification.
However, for absolute humidity, the model results are
close in absolute values and curve behavior to the
measured values, despite showing a lag in the time
response.

 Figure 10. Regeneration, outlet air temperature
 comparison

 As in the case of dehumidification, Figure 9 shows that
 the model results are in general inside the +15% -15%
 range from the experimental values, even though the
 Figure 8. Regeneration, outlet air temperature model curve shows a slower decay of absolute air
In the case of temperature shown in Figure 8, the faster humidity than the experiment. Nevertheless, Figure 10
response of the model to the temperature increase in shows that the temperature values are outside the
water temperature is easily observable from the highlighted deviation range and specifically shows that

© 2020 ASHRAE (www.ashrae.org) and IBPSA-USA (www.ibpsa.us). 338
For personal use only. Additional reproduction, distribution, or transmission in either print or digital form is not permitted without
ASHRAE or IBPSA-USA's prior written permission.
the model values are higher than the experimental values air channel path of a DCHE. The model has been
for a large fraction of the regeneration process, which validated with experimental data from an existing
can be related to the lower thermal capacity of the model reference. The experimental setup of the reference
than the experiment, which may cause that for the same present differences with the model, so certain conditions
heat flux input due to hot water flow, the model reaches are not directly comparable, but for the conditions that
higher temperatures. are more directly relatable (absolute air humidity), the
 results of the model show agreement with the
DISCUSSION AND RESULTS ANALYSIS experimental values. The results of air humidity tend to
The validation shows that the 1D model can accurately have a deviation of less than 15% as compared to the
represent the air humidity at the outlet of the DCHE for experimental values.
both dehumidification and regeneration modes. The However, the validation process shows that only
model can reproduce the general behavior of the change considering one tube segment has an important effect
in time of absolute humidity of process air. The results over air temperature. The model air temperature
for the regeneration process show a larger deviation from response tends to change faster than the measured values
the experimental values, which can be explained by the to the change in inlet water temperature. It is especially
differences between the model assumed average evident for the regeneration case, in which the higher
condition and experimental temperature behavior. temperature differences between the water and the air
However, the analysis of the deviations between and solid phases of the model create larger deviations
experimental and model results for temperature suggests from the experimental results. To address this issue, an
using a small segment of water tube for a significant expansion of the model should include the effect of
effect over temperature. It is especially salient for the several sections of water tube, to increase the thermal
regeneration process, in which the larger temperature capacity of the model, approaching the actual thermal
differences make even more evident this situation, with capacity of the experimental DCHE, even though the
the model values not reaching the experimental values at experimental values are influenced by the thermal inertia
the end of the 600s process, unlike dehumidification. of elements upstream and downstream of both air and
Figure 4 shows this phenomenon clearly for the first 100 water circuits, which are outside of the scope of the
s of dehumidification, during which water starts flowing model.
at 50°C influenced by the system thermal inertia and the
recently finished regeneration process, producing a peak
of the temperature of 49°C shortly after beginning the ACKNOWLEDGMENTS
process, and as the water temperature falls, reaching a NOMENCLATURE
temperature close to the water inlet temperature (27°C )
before 100°C while in the meantime the experimental
results show a slower and steady decrease, reaching : Moisture load in desiccant[ ⁄ ]
27°C only at 400s of the dehumidification process.
Figure 8 shows even more evidence of the influence of : Specific humidity in air [ ⁄ ]
the differences in temperature behavior between the : Specific humidity in the air in desiccant
model and the experiment, showing a faster increase in pores [ ⁄ ]
temperature in the model than what showed in the
reference, and maintaining though the complete : Air temperature [ ]
regeneration process temperatures closer to the water
temperature than what was measured in the experiment. : Solid temperature [ ]
The increase in temperature takes place before 100s, : Tube temperature [ ]
reaching 40°C from the initial 27°C and then
maintaining a slower increase in temperature describing : Water temperature [ ]
a behavior similar to the experiment. It is to be expected
that by including more elements to the water tube while , : Length of control volume on Z direction
performing the second scale modeling, the temperature (air) [ ]
response of the DCHE would be slower, and therefore , : Length of control volume on Z direction
more closely match the experimental temperature values. (desiccant) [ ]
CONCLUSION , : Length of control volume on Z direction
A 1-D finite-difference model has been developed to (fin) [ ]
represent the heat and mass exchange phenomena in an

© 2020 ASHRAE (www.ashrae.org) and IBPSA-USA (www.ibpsa.us). 339
For personal use only. Additional reproduction, distribution, or transmission in either print or digital form is not permitted without
ASHRAE or IBPSA-USA's prior written permission.
 : Length of control volume on Y direction based on a developed mathematical model. Energy
 [ ] Conversion and Management 52(6), 2329-2338.
 Hu, L. M. et al. (2015) Performance study on composite
 : Air velocity [ ⁄ ]
 desiccant material coated fin-tube heat exchangers.
 ∆ : Heat of adsorption [ ⁄ ] International Journal of Heat and Mass Transfer 90,
 109-120.
 : Separation factor [Dimensionless]
 Jagirdar, M. and Lee, P. S. (2018) Mathematical
 ℎ : Convective heat transfer coefficient modeling and performance evaluation of a desiccant
 between air and desiccant [ ⁄ 2 ∙ ] coated fin-tube heat exchanger. Applied Energy
 212, 401-415.
 : Air density [ ⁄ 3 ]
 Karava, P. Qu, M. (2018) Architectural Engineering,
 ℎ , : Mass transfer coefficient [ ⁄ ∙ 2 ] Purdue University, West Lafayette, Indiana, USA.
 : Relative humidity in air stream Liu, L. et al.(2019) Numerical investigation of mass
 [Dimensionless] transfer characteristics for the desiccant coated
 dehumidification wheel in a dehumidification
 , : Air specific heat [ ⁄ ∙ ] process Applied Thermal Engineering 160, 113944.
 : Air thermal conductivity [ ⁄ ∙ ] Nie, J. et al. (2017) Theoretical modeling and
 experimental study of a thermal conditioning
 : Desiccant thermal conductivity process of a heat pump assisted solid desiccant
 [ ⁄ ∙ ] cooling system. Energy and Buildings 153, 31-40.
 : Fin thermal conductivity [ ⁄ ∙ ] Saeed, A. and Al-Alili, A. (2017) A review on desiccant
 coated heat exchangers. Science and Technology for
 , : Metallic fin Specific Heat [ ⁄ ∙ ] the Built Environment 23 (1), 136-150.
 , : Desiccant Specific Heat [ ⁄ ∙ ] Tu, Y. D. et al. (2017) Comfortable, high-efficiency heat
 pump with desiccant-coated, water-sorbing heat
 : The porosity of the desiccant material exchangers. Scientific Reports 7.
 [Dimensionless]
 Tu, Y. D. et al. (2017) Desiccant-coated water-sorbing
 : Mass diffusivity of desiccant material heat exchanger: Weakly-coupled heat and mass
 [ 2 ⁄ ] transfer. International Journal of Heat and Mass
 Transfer 113, 22-31.
 : Water-tube radius [ ]
 Vivekh, P. et al. (2018) Recent developments in solid
 ℎ , : Convective heat transfer coefficient desiccant coated heat exchangers – A review.
 between air and tube [ ⁄ 2 ∙ ] Applied Energy 2018, 778-803.
 : Desiccant density [ ⁄ 3 ] Vivekh, P. et. al. (2019) Theoretical performance
 analysis of silica gel and composite polymer
 : Fin density [ ⁄ 3 ] desiccant coated heat exchangers based on CFD
 approach. Energy Convesions and Management
 : Air kinematic viscosity [ ⁄ ∙ ] 2019 (187) , 423-446.
 Xu, F. et. al. (2019) Analysis on solar energy powered
 cooling system based on desiccant coated heat
REFERENCES exchanger using metal-organic framework. Energy
 2019 (117), 211-221.
 Zhai, C. et al. (2008) Performance modeling of desiccant
ASHRAE (2017). ASHRAE Standard 55 Thermal
 wheels (1): Model development. Proceedings of
 Environmental Conditions for Human Occupancy.
 Energy Sustainability 2008 2, 209-2019.
 Atlanta, USA: American Society of Heating
 Refrigerating and Air-Conditioning Engineers. Zheng, X. et al. (2014) Recent progress in desiccant
 materials for solid desiccant cooling systems.
Ge, T. S. et al. (2011) Performance study of silica gel
 Energy 2014 (74), 280-294.
 coated fin-tube heat exchanger cooling system

© 2020 ASHRAE (www.ashrae.org) and IBPSA-USA (www.ibpsa.us). 340
For personal use only. Additional reproduction, distribution, or transmission in either print or digital form is not permitted without
ASHRAE or IBPSA-USA's prior written permission.
Zheng, X. et al. (2016) Experimental study and
 performance prediction of carbon based composite
 desiccant for desiccant coated heat exchangers.
 International Journal of Refrigeration, 2016 (72),
 124-131.

© 2020 ASHRAE (www.ashrae.org) and IBPSA-USA (www.ibpsa.us). 341
For personal use only. Additional reproduction, distribution, or transmission in either print or digital form is not permitted without
ASHRAE or IBPSA-USA's prior written permission.
You can also read