PowerWorld's Experience Using Real-Time Power System Models
←
→
Page content transcription
If your browser does not render page correctly, please read the page content below
PowerWorld’s Experience
     Using Real-Time Power System Models

        Presented by:
            James Weber, Ph.D.
            Director of Software Development
            February 28, 2018

2001 South First Street             weber@powerworld.com
Champaign, Illinois 61820           http://www.powerworld.com
(217) 384-6330 ext 13
PowerWorld’s History of
Full-Topology Models
• PowerWorld Simulator – 1996
– Planning software focused on Bus-Branch Models
• PowerWorld Retriever – 2000
– Real-time visualization software
– Many pilot projects with this worked by exporting a
bus/branch model from the EMS (RAW file)
• This was not a sustainable model for customers
• PowerWorld Retriever – 2006
– ISO-New England started work on using the data already
managed in their Areva EMS tool
• Cases only initially, but progressed to reading their EMS one-lines
– This was clearly the better approach and other real-time
customers followed
2PowerWorld’s History of
Full-Topology Models
• PowerWorld Simulator Integrated Topology Processing –
2010
– BPA real time operations started using the direct export
from their EMS
• Expanding data imports with Peak Reliability – 2016
• This is all data that was already maintained at Peak so
we are just plugging into their existing processes
– Direct read of the Contingency record
– Direct read of the Remedial Action Scheme definitions
– Direct import of 1000s of maintained substation topology
oneline diagrams
– Direct import of various overview diagrams
– Direct import of 1000s of scheduled outages as well
3Full Topology Models exist today:
EMS System Models
• Industry has spent 30 years building the models
– More importantly: maintaining these models
• Maintained by an existing large staff of engineers (dozens)
• More than just the models
– Oneline diagrams
– Contingency definitions
– Remedial Action Scheme definitions
– SCADA measurements
• Much more frequent updates than power system planners realize
– Often done weekly
– At most every few weeks
• Large financial commitment is already being made to keep these
models up to date
– Staff Staff Staff ($ $ $)
4For Presentation on 2/28/2018, we skip until slide 21, as listeners understand motivation
Our Experience: Four Types of Issues
• Data Definitions
– How are objects uniquely identified
– How is data structured
• Tools to Manage Increased Model Size
– Previously simple concepts getting more complicated
• When is a line open?
• Single Line Contingency
• Human Interaction
– My model is huge
– Data viewing
– Data reporting
• Data Formats
– Need to read information directly from the sources that manage
the full topology models
5Node-Breaker vs. Bus-Branch
Which models are used?
• Depends on the time frame of your analysis
– Past Event Replication Studies
– Real-Time Studies
– “Operations Planning”
• Looking at the next 24 hours
• Looking at outage schedule coordination over the next
several months
– “Long-Term Planning”
• Looking at next several years
6Typical Existing Power Business Stages
“State Mapping”
NOW
PAST FUTURE
Years into
Day – Months
Real-Time the Future
Past Event Operations
Replication Planning Long-term Planning
OperationsOperations
Real-time Planning (Bus/Branch)
(Bus/Branch)
(Node/Breaker)
Auxiliary Data
Model
Exporter Contingency Definitions
System State Replicator System State Replicator Transient Stability Data
• Mostly Manual • Mostly Manual Generator Cost Data
process to replicate Flowgate Definitions
process to replicate
Monitoring Information
the system state the system state
Visualizations
• Full Time Staff ($$$) Dynamic • Full Time Staff ($$$)
• Error-Prone (Bus/Branch) • Error-Prone
7Typical Existing Power Business Stages
“Auxiliary Data Mapping”
NOW
PAST FUTURE
Years into
Day – Months
Real-Time the Future
Past Event Operations
Replication Planning Long-term Planning
OperationsOperations
Real-time Planning (Bus/Branch)
(Bus/Branch)
(Node/Breaker)
Auxiliary Data
Model
Exporter Contingency Definitions
Map Auxiliary Data Map Auxiliary Data Transient Stability Data
• 90% automated, but • 90% automated, but Generator Cost Data
10% manual to map Flowgate Definitions
10% manual to map
Monitoring Information
auxiliary date auxiliary date
Visualizations
• Full Time Staff ($$$) Dynamic • Full Time Staff ($$$)
• Error-Prone (Bus/Branch) • Error-Prone
Auxiliary Data
mapping is slightly
This model is slightly different EVERY time it’s exported different EVERY time 8A Better Choice for
Operations Planning
NOW
PAST FUTURE
Years into
Day – Months
Real-Time the Future
Past Event Operations
Replication Planning Long-term Planning
OperationsOperations
Real-time Planning (Bus/Branch)
(Bus/Branch)
(Node/Breaker)
Auxiliary Data
Model
Copier Contingency Definitions
Map Auxiliary Data Transient Stability Data
• Infrequent updates to Generator Cost Data
Flowgate Definitions
mapping
Monitoring Information
• Only when
Visualizations
Real-time Operations substations are
(Node/Breaker) changed
• Little staff time (¢¢¢) Auxiliary Data mapping
changes infrequently and
incrementally 9Near Real-Time Analysis of
the Power System
• The starting point for this is the system state
stored in an EMS system model
– Or you must match another model to this
– The model with the disturbance state is the full-
topology real-time model
• To use this model for studies, there is a lot
more than just the model to maintain
10“Model” maintenance:
It is more than just the model
• Large amount of Auxiliary Information to maintain
– Contingency Definitions
– Interface/Flowgate/Path/Cutplane definitions
– Limit Monitoring information
• What to monitor, dynamic limits, etc.
– Market cost/bid information
– Transient Stability Models
– Various other groupings
• Injection Groups/Subsystems
• Substations
– Graphical Visualization Descriptions
11Use Alphanumeric Identifiers:
Labels
• Unique identifiers for all power system objects
• Change infrequently or not at all
• Independent of topology changes
– Bus numbers can change with each model export even if the only
change is a breaker status
– System upgrades may change where a line is connected, but its
identifier should not have to change (it might, but should not be
required)
• Can be used with all auxiliary data: contingency definitions,
interfaces, etc.
• Created automatically from Real-Time Model object identifiers
– Typically with a real-time system there will be some unique identifier
Substation$RecordType$EMS_ID
– BrownsFerry$UN$Unit2 Generator
– Johnsville$500$1928 500 kV node
12More about labels
• Even in the EMS model data space we see
inconsistencies with labels
– Labels must be unique across all devices of a type
– But, PowerWorld Simulator allows you to have
multiple labels for each device (unlimited number)
• SCADA information referring to model information using
different naming conventions sometimes
• Different organizations using different naming
(DOE-EIA cost information for example)
• There is no limit to the number of characters in
a label
13Are Labels enough? NO!
Models are Different
• First instinct this is only a “naming” issue
– Just build an “Automated Conversion Tool” that links
the names from the full-topology model to the names
in the planning model
– In other words: Use Labels
• This instinct is not correct. It is more than this.
– The models are different
– Breaker topologies matter
– Can not assume that all breakers are in their normal
status
– Taking a line out of service depends on the present
system state
14Invalid Contingency Simulations
Example 1
15Invalid Contingency Simulations
Example 1
• How is outage of Line A modeled on following
slide?
– Planning Model
• Open Line A
– Actual System
• Open breakers a1, a2, and b1
– Assuming all breakers have same status as original
configuration from which planning case was
created, then this is a correct simulation in
planning case
16Breaker a4 Out for Maintenance
• Now what happens when Line A is taken out of
service?
17Invalid Contingency Simulations
Example 2
• How is outage of Line A modeled along with
open breaker a4?
– Planning Model
• Open Line A
• No other lines are isolated
• Bus split not captured
– Actual System
• Open breakers a1, a2, and b1
• Line D isolated from Line B and Line C
– Modification of planning model is required to
correctly model this condition
18Invalid Contingency Simulations
Example 2
Line D isolated
from Line B and
Line C
19Breaker Failure Outages
Example 3
• Problem
– How to you model a breaker failure if you have
consolidated the breaker in the process of creating
the planning model?
• Solution
– Do not consolidate your data, let the software do
that as needed
– To make contingency definitions more familiar, add
a new action called Open with Breakers
20Can you make an
Automated Conversion Tool?
• Answer: No!
• A bus-branch model is inherently an
“equivalent” representation of the breaker-
node model
– You have lost information by creating the bus-
branch model
– You can’t just convert back to something that’s not
in the model now
21What do you need to do?
• Get the data directly from the EMS
• An enormous amount of staff time is spent
building and maintaining the EMS models
• Read it directly
22PowerWorld’s
Experience with other Data Formats
• EPC and RAW files: Historically represent “bus-
branch” models, though that is evolving
• HDBExport command from Areva EMS
– A lot of experience reading from this EMS data
structure for many customers for a decade
– Data structures are very similar to those used in
Bus/Branch models
– Fundamental object is the Node (ND)
• ABB Spider EMS
– Experience reading full cases for use in running
contingency analysis, but only with 1 customer
• Siemens EMS
– Small amount of experience loading only the topology
definition so that measurements could be mapped
• OpenNet EMS
– Very small amount of experience
23Experience with Areva EMS
• Hdbexport command gives users of this EMS the
ability to export data
– We have 10 years of experience reading the network
model
– Also have experience exporting the Contingency and
RAS definitions using similar methodology
• Oneline diagrams format is also text-based and
links to these case
– We can read these diagrams into PowerWorld as well
– Some work up-front to translate how things are drawn
as this is custom for every Areva customer
24PowerWorld Demonstration
• How to open a full-topology model
– Chose File, Open Case
– Change to the appropriate file type
25Important Data Structure Parts:
Substations
• Substation Definitions
– The fundamental data structure in a real-time
model
– Part of the unique identifier of a device
– You must have this to make interaction with the
full-topology model easier
• Define a list of substations
• Assign each “bus” to a substation
– Natural place to define geography (Latitude,
Longitude)
26Bus Display:
each node from EMS becomes a bus
• Each bus is assigned to a Substation
27No limitation on device counts
No limitation on characters in names
• No limit on number of substations
• No limit on the number of characters in the
name of any device (nor on labels)
• No limit on the Label string length (can also
have multiple labels for each device and no
limit on the number of labels)
• No limit on number of nodes in a substation
• No limit on the devices in a substation
28What do Full Topology Models Look
Like
• More nodes (about 4-6 times more)
• More branches (the switching devices)
• Similar Gens, Load, Shunts,
Transmission Lines
– 6,414 transformer
– 13,189 lines
– 245 series devices
– 529 ZBRs
– 37,316 breakers
– 62,129 disconnects
– 715 load-break disconnect
– 360 fuses
29Important Data Structure Parts:
More Branch Types
• Planning models already have the concept of
distinct types of branches
– Line, Transformer, Series Cap
• BranchDeviceTypes that represent switching
devices that have very little impedance
– At a minimum add Breaker, Load Break Disconnect, and
Disconnect
• Used in “Open or Close with Breakers” features discussed
shortly
• Used in “Derived Status” concepts discussed shortly
– Also add Fuse, Ground Disconnect and ZBR for
informational purposes as well
30BranchDeviceType
31What do Branch Device Types
Physically Represent
• Transformers, Lines, Series Devices
– We know these
• Breakers
– Switching device that can interrupt very high currents
such as during a fault
• Load-Break Disconnect
– Switching device that can be opened during normal
loading conditions, but NOT during a fault
– Often associated with a capacitor bank
• Disconnects
– Switching device can not be opened when under load
32Other BranchDeviceTypes
• ZBR
– Wire that connects two points.
– Might be there so a measurement can be taken
– Might just be a jumper
• Ground Disconnect
– Switching device connects to ground. Some EMS models actually
include nodes that represent the ground and then an associated
disconnect.
– Obviously these should NEVER be closed in for purposes of
planning activities
• System operators however are focused on status and worker safety, so
it is useful for them to know if a line is actually grounded properly
• Fuses
– A fuse
33Example ZBR and Load Break
Disconnect
ZBR probably there so that one
measurement gets flow on line
Load Break
Disconnect
34Model Detail
• To the right is a
redacted detail
of what the
topology of a
500 kV bus
• It’s a Breaker
and a Half
configuration
• This would be a
single bus in a
“planning case”
35Good News:
• Some data definitions go away
– Idea of a “Line Shunt” as compared to a “Bus Shunt” is
unnecessary
• All shunts are modeled with a connection to a bus
• Line vs. Bus Shunt just depends on which side of the line
breaker it is connected
– Idea of a “Multi-Section Line” is unnecessary
• Software can automatically traverse the topology to
determine which branches get isolated by the same set of
breakers
• “Open with Breakers” option discussed next
– Concept of a “Bypassed” series cap goes away
• There will be a separate breaker to model the bypass
36Capacitor/Reactors all the same
Multi-Section Line concept gone
Shunts are all the same.
“LineShunt” just means its
on the other side of the
breakers
Ring Bus
Bypass
Breakers
37Integrated Topology Processing
• Completely integrate the concept of topology
processing inside each software algorithm
• Each algorithm consolidates in a manner
appropriate to it
– Power flow solve directly on the full-topology model
(internally consolidate the power system model as
necessary)
– Contingency analysis (only consolidate as necessary)
– PV Curve and QV Curve behave differently
– MW Linearized Tools (ATC, Sensitivity tools, etc.)
behave differently
38Full-Topology Power Flow Solution
• PowerWorld knows when it needs to make a
consolidated case and takes care of that
• User only interacts with the full-topology
model
– Power Flow Solution returns flows on all devices
– Contingency analysis limit monitoring looks at all
devices including switching devices (assuming
limits are assigned!)
• Option to filter bus voltage reporting so only one node
inside a Superbus reports as a violation
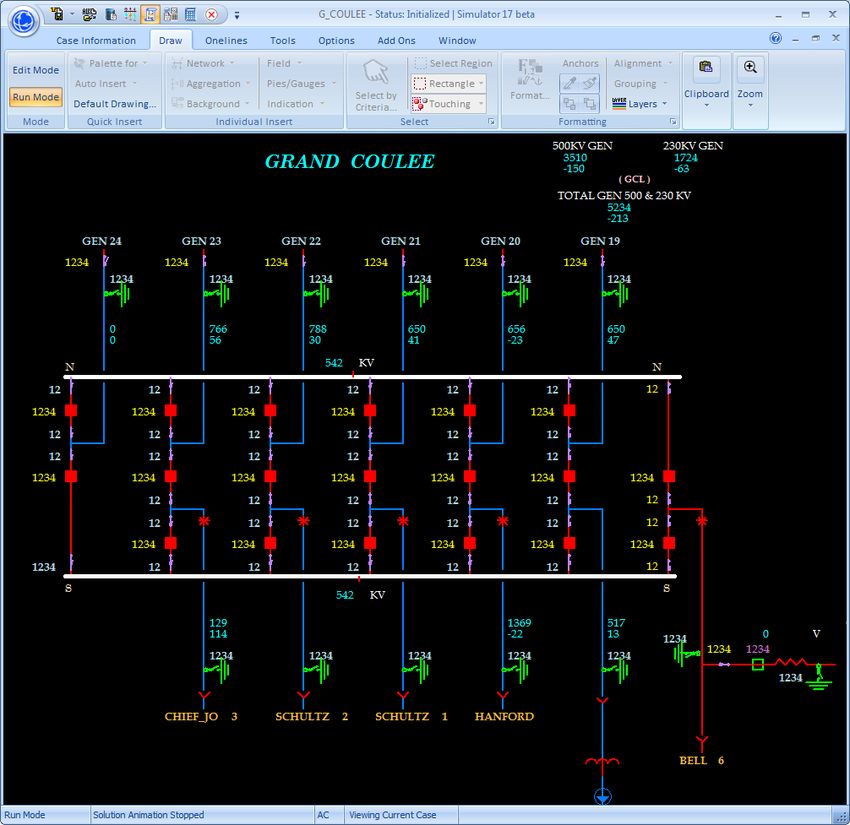
39MW and Mvar flow arrows on all
devices on oneline diagrams
40Table of Breakers showing MW and
Mvar flows
41Limit Monitoring in the Power Flow
42PowerWorld Software Features where
BranchDeviceTypes Matter
• Software has many automated features that
use the BranchDeviceType Information
– Full Topology Automatic Coordinated Switched
Shunt Control
– User Interaction features “Open Breakers to
Isolate” and “Close Breakers to energize”
– Contingency Analysis “Open with Breakers”
• These features will only open the Breakers
43Full Topology Automatic
Coordinated Switched Shunt Control
• PowerWorld automatically detects a group of
Switched Shunts that regulate the voltage at the
same point
– By “point” we mean a group of buses connected by
very low impedance branches
– Don’t have to regulate the exact same node, just be
connected
• Shunt will automatically close breakers and load
break disconnects in series with shunt to perform
shunt control
• No additional input data: PowerWorld just detects
44Full Topology Automatic
Coordinated Switched Shunt Control
• Example: 4 shunts all
regulate “82125”
• Initial solution has
regulate voltage inside
High/Low Range
• Change Volt High to 0.94
45Power Flow Solution automatically
closes in the breaker
Automatically closed in Breaker
(would also close in a Load Break
Disconnect)
46User Interaction features:
Open Breakers to Isolate
47User Interaction features:
Open Breakers to Isolate
• Automatically Finds Breakers
Skip over “ZBR”
48User Interaction features:
Close Breakers to Energize
• Dialog Appears asking you
to pick which breakers to
close
49Model a Breaker Failure
• Perform “Open with
Breakers” on a device
that is a Breaker
– PowerWorld assumes
that you want to find
breakers that surround
the breaker
– Assumption is that the
breaker will not open
(otherwise you’d just
open it!)
Perform Open with
Breakers on this breaker
50Using a Full-Topology Export that
includes out-of-service lines
• Open with breakers always works fine
• Close Breakers to Energize can be troublesome
– Out-of-service line may also have disconnects open
“Close Breakers” won’t work
because the open disconnects 0.0 Mvar
are in the way! 11700
11689
19287
11709 11699 1
9310 19292
11708 11694 1
19291
11721 11716 11717 11715
19316 11723
19290 11713
19289
19315 19318 19317 11705 1
19293
19288
1
11693
11690
51
11691Yet more options to automatically fix
this trouble
• Use Close Breakers to energize “with Options”
52Close Normally Closed Disconnects
• This option will look across normally closed
disconnects searching for breakers
• Option will also look in series past breakers for
disconnects
• Treats a series combination of disconnects with
a single breaker as though it is “one switching
decision”
53Close Normally Closed Disconnects
Finds the Disconnects too
54Bus table and Superbus
• PowerWorld treats all “nodes” as additions to the bus table
– Represent a point where devices connect
• Superbus table (user does not create – software figures it
out)
– Superbus = group of buses connected by closed switching
devices
– It is similar in concept to an electrical island
• Islands are added and removed in the software as branches change
status
• Island = group of buses connected by closed branches of any type
• Subnet table (user does not create – software figures out)
– Subnet = group of buses connected by open or closed switching
devices
55Bus table and Superbus
• Typically as a user you will not interact with
either the Superbus or the Subnet table
– They are available to see
– Each Superbus and Subnet also chooses “primary
node”
• This affects features that report only one bus violation
inside a Superbus
• Also possible for the user to bias the choice of the super
bus by assigning a priority to the bus object
56Superbus table
57Subnet Table
58Human Interaction
• Model Navigation Obstacle
– Can be confusing to navigate full-topology models
• Tools that graphically show bus-to-bus
connections in the model can get very
complicated
– You can get stuck inside all the disconnects and
breakers
– Makes finding more important devices difficult
(lines, transformers, generators, loads)
– PowerWorld’s Bus View has features to help
59Planning Case Bus View
COULEE
Bus: COULEE (40287)
NomkV: 500.00
Area: NORTHWEST(40)
Zone: Central Washington (403) 0.00 MW
0.00 Mvar
1.0800 pu
218.6 MW 37.4 MW 1244.3 MW 1264.9 MW 1264.9 MW 0.0 MW 545.0 MW 549.9 MW 615.3 MW 629.9 MW 629.9 MW 548.0 MW
540.00 KV
22.8 Mvar 143.0 Mvar 34.0 Mvar 77.6 Mvar 77.6 Mvar 0.3 Mvar 38.1 Mvar 36.8 Mvar 48.6 Mvar 52.5 Mvar 52.5 Mvar 9.4 Mvar
59.94 Deg
219.8 MVA 147.8 MVA 1244.7 MVA 1267.3 MVA 1267.3 MVA 0.3 MVA 546.3 MVA 551.2 MVA 617.2 MVA 632.1 MVA 632.1 MVA 548.1 MVA
0.00 $/MWh
A
A
Am ps
Am ps
A
A A
Am ps
A
Am ps Am ps
Am ps A
A
Am ps
Am ps A
Am ps A
A
Am ps
CKT1 CKT6 Am ps
COULE R1 A
CHIEF JO 40288 M VA
1.0476 tap
40233 MS
BELL BPA
1.0800 pu CKT1
40091 MS MS
540.00 KV HANFORD
1.0893 pu CKT1 CKT2
40499
544.65 KV SCHULTZ CKT1
1.0791 pu
40957 COULEE19
539.53 KV 41739 CKT1
1.0813 pu
COULEE20
540.66 KV COULEE19 41740 CKT1
40291 COULEE21
COULEE20 41741 CKT1
1.0035 pu
40293 COULEE22
15.05 KV COULEE21 41742 CKT1
1.0198 pu
40295 COULEE23
15.30 KV COULEE22 41743 CKT1
1.0197 pu
40296 COULEE24
15.30 KV COULEE23 41744
1.0018 pu
40297
15.03 KV COULEE24
1.0013 pu CKT1
40298
15.02 KV COULEES2
1.0013 pu
41357
15.02 KV
60
1.0342 pu
237.87 KVFull Topology Bus View
Shows stack of Skip over disconnects
serially connected
nodes Skip over
breaker and
Bias to show lines, disconnect
transformer, or to get to
series cap transformer
prominently
If those not
available, then
biases to show
breaker
61Consolidated Superbus View
• Looks like the “planning case” essentially
62Overview Oneline Visualizations will
likely be Substation Based
63EMS Oneline Diagrams
• Peak Reliability has a lot of custom-built substation topology
diagrams
– Our most recent set from them for testing had 4,494 diagrams
– Clearly not something that they are going to draw a second time
• After a short project (about 1 person-month of effort), we built a
translation file that describes how the various symbols on their
onelines are drawn
– Areva onelines are all built around user-customized symbols, so we had
to translate a few hundred symbols
– Once Peak Reliability’s symbols are translated, PowerWorld can directly
read in all 4,494 of these online diagrams
– Still working on a mechanism to keep this up-to-date
• They add new kinds of symbols to the diagrams
• Peak will share these with other companies
• Have done same work with ISO – New England and BPA
64Build Tools to Load Substation
Topology Onelines
65Contingency Definitions
• Bad News
– In a real-time model these can get very
complicated and confusing
• A “Single Line Outage” turns into 4 different breakers
opening together
• The breakers necessary to isolate a line change as system
topology changes
– We need a better way to define a contingency
(which we have)
• Good News
– We can model a breaker failure easily now
66“Open with Breakers” and “Close with
Breakers” Contingency Actions
• Open a device using breakers instead of changing the
status of the device directly
• Ensures that accurate modeling of real-time system is
achieved
• Automatically
determine Breakers
that need to open to
isolate an element
• Breaker failure
scenarios can be
modeled by applying
this action to a breaker
• Same idea for a “Close
with Breakers” action
67Example Contingency Analysis
Explicit Breakers
Open Breakers
Complex OPENCBS
on Line and Bus
68What Actually Occurred Reporting
• OPENCBS action will report which breakers where actually
open
– “Origin of Action” = ELEMENT DYNAMIC
– This means Simulator dynamically figured out what to open
– What opens will not always be the same
• If a disconnect is open that is normally closed then the contingency
actions that occur are different
69More Complex
What Actually Occurred Reporting
• Special #1, #2, #3 etc. marking in the “What
Occurred” indicates which devices required
which breakers to open
70Monitoring of Switching Devices in
Contingency Analysis and Power Flow
• Nothing different than before
• A breaker, disconnect, line, transformer, and series
cap are all the same
– Any device that has a limit specified is monitored
regardless of what is going on inside the solution
– Software calculates flows on everything
Disconnect
Series Caps Series Caps
Breaker
with Line
Limits
71Violations shown as normal
72Bus Voltage Limit Monitoring
• Option (checked by default) will monitor only
the primary bus for each super bus
– Caveat, buses inside a Superbus could have
different limits (strange but happens)
• Also monitors the “highest minimum” and “lowest
maximum” voltage inside a Superbus
73Tools
Is my Line Open?
Branch Status Confusion
• Planning software and bus-branch models
– Two Fields: Status and Online
– Status: an explicit field to determine if a device is
closed/open (because breakers are not modeled)
– Online: whether or not a device is energized is affected
by the status of branches
• Real-time models
– Breaker or disconnect statuses determine the status of
other devices
– No explicit status field for other devices
(Generators, Loads, Lines, Transformers, etc.)
74Derived Status:
Device Status Confusion
• Typically, when using a full-topology model,
Status = Closed for all non-switching devices
(Generators, Loads, Lines, etc.)
• Hybrid model with only parts of the system modeled
with breaker detail can still use Status field of a non-
switching device
• Actual status of a device is confusing
– Status of a line is really derived from other information
(breaker statuses)
– Software automatically traverses the topology at the
terminals of a device to determine its “Derived Status”
• Looks at status of Breakers near terminals
– Software also has a field “Derived Online”
75For more details see Simulator Help
• https://www.powerworld.com/WebHelp/#MainD
ocumentation_HTML/Device_Derived_Status.htm
76Script Command:
ExpandBusTopology()
• This can be used to take a bus and split it up
automatically
– You then have to rearrange all the connections that come
into this bus though
– Was added for professors building fake power systems for
research purposes
– You aren’t building fake stuff, so just go get your EMS data
77More already maintained data from
the EMS system
• Over the past 2 years, PowerWorld has worked
with Peak Reliability to directly import additional
information
– Contingency Definitions from Areva system
– Remedial Action Scheme definitions from Areva system
– Scheduled Outage information from the CROW outage
schedules
• This is all possible because these systems use the
same label convention as used in the EMS
• This is a presentation for another day
78Summary
• PowerWorld has a lot of experience working with
EMS data
• Hard-learned lessons learned
– Investment of a huge amount of additional staff time
into building parallel data sets won’t work
• It might work for a pilot project but will fail in practice
– You need to use the already maintained data sets as
much as possible
– Industry’s response to asking that additional data sets
be maintained is
“Don’t change my data, change your software”
79What should the industry do
• Do NOT build a parallel process maintaining a
second full-topology model
– This is not sustainable
– Would require an enormous new permanent expense
of additional engineering staff
• Instead: change the starting model
– Start with a recent EMS system model
• Comes with already maintained: model, diagrams,
contingency definitions, RAS, etc.
– Discuss with the EMS system folks and ask them to add
some more detail
• EMS software already supports - just add more model info
80Existing EMS model updates
• EMS engineers already struggle to keep models
up to date communicating amongst themselves
• I can not envision a reliable process that adds
to this workload by adding coordination with
planning models as well
81What do Planners need to ask of EMS
Engineers
• Add more detail to EMS models.
• Existing EMS software supports: just add more model info
– Generator station auxiliary loads
– Generator step-up transformers
– Keep the “normal” status of switching devices up-to-date
(breakers, disconnects)
• This are vital to putting lines, gens, etc back into service
– Remove artificial device aggregation
• 2 generators grouped into a single generator in the model
• Historically this detail was not vital to EMS tools such as
SCADA / State Estimation / Contingency Analysis
– This detail is important for transient stability and voltage stability
analysis though
82Generator Station Load
• In real-time systems, sometimes the generator
station load is not modeled explicitly.
– May not have separate measurements for generator
output and station load
– This will be a problem if trying to do some types of
analysis (Transient Stability)
– Example of where additional detail in “planning” model
may need to be pushed into the real-time model
83Planning Software tools need to be
updated
• Must support full topology
• Remove artificial device aggregation
– EMS models do not group together 10 capacitor banks
into a single “switched shunt”
• Longer-term discussion of more complex
equipment
– DC transmission devices in particular are not
consistently modeled across EMS and Planning
software tools
• Use as much already-maintained data from EMS
system as possible
– Model, oneline, contingencies, RAS, etc.
84Envisioned Process
• Planning engineers already have to integrate
future projects into a model
– They’ve done this for decades
– They will always do this
• Just switch the starting model to be a recent
EMS model export instead
– Maybe grab this snapshot at an interval
– The “normal” status of switching devices matter
here (must put that in the EMS model)
85You can also read