Thermal Performance of Alternating-Current Heat Recovery Ventilator in Partially Wet Conditions - 九州大学
←
→
Page content transcription
If your browser does not render page correctly, please read the page content below
九州大学学術情報リポジトリ
Kyushu University Institutional Repository

Thermal Performance of Alternating-Current Heat
Recovery Ventilator in Partially Wet Conditions
Ahmad Alfan Farizi
Graduate School of Mechanical Engineering, College of Engineering, Kookmin University

Hyunjin Lee
Department of Mechanical Engineering, College of Engineering, Kookmin University

Hwataik Han
Department of Mechanical Engineering, College of Engineering, Kookmin University

https://doi.org/10.5109/4372282

出版情報:Evergreen. 8 (1), pp.221-228, 2021-03. 九州大学グリーンテクノロジー研究教育センター
バージョン:
権利関係:
EVERGREEN Joint Journal of Novel Carbon Resource Sciences & Green Asia Strategy, Vol. 08, Issue 01, pp221-228, March 2021 Thermal Performance of Alternating-Current Heat Recovery Ventilator in Partially Wet Conditions Ahmad Alfan Farizi1, Hyunjin Lee2, Hwataik Han2,* 1 Graduate School of Mechanical Engineering, College of Engineering, Kookmin University, Seoul 02707, Republic of Korea 2 Department of Mechanical Engineering, College of Engineering, Kookmin University, Seoul 02707, Republic of Korea *Author to whom correspondence should be addressed: E-mail: hhan@kookmin.ac.kr (Received October 30, 2020; Revised March 26, 2021; accepted March 26, 2021). Abstract: This paper investigates the effect of moisture transfer on the thermal performance of an alternating-current heat recovery ventilator (AC-HRV). Contrary to conventional direct-current ventilation in two separate ducts, alternating-current ventilation periodically changes its airflow directions in a single duct. Exhaust energy is stored and recovered in and out of the thermal storage unit during charging and discharging processes. A theoretical model has been developed to obtain the transient temperature and humidity distributions inside a thermal storage unit in partially wet conditions. Based on the distributions, the thermal performance of the HRV is analyzed at cyclic steady states. Results show complicated patterns of moisture condensation and evaporation during an entire period of charging and discharging processes. The maximum thickness of water condensate is 2.67 m, which is negligible under the present test conditions. The enthalpy efficiency of an AC- HRV increases as the accumulated mass of condensate increases due to the latent heat. Keywords: evergreen; Heat recovery ventilator, Alternating-current ventilation, Enthalpy efficiency, Condensation 1. Introduction and Background by the respiratory tract that has been heated during exhalation. The same principle is used in an AC-HRV, As people spend most of their time indoors in houses which has the advantage of using a single-duct system for and workplaces1), indoor air quality becomes a crucial both supply and exhaust purposes13). Thermal storage factor for their performance and productivity as well as material is charged during the exhaust process and is their comfort and health2). It is essential to provide an discharged during the supply process. In a sense, this is adequate amount of fresh air 3) to create a comfortable and similar to a rotary-type HRV. Instead of swapping the healthy indoor environment4, 5). Heat recovery ventilators matrix position by rotating a wheel, the airflow direction (HRVs) are frequently used6) in order to save ventilation is reversed with the matrix fixed at a certain position. energy. Proper design of HRV systems can provide quality Extensive studies have been conducted to investigate indoor air and save heating and cooling loads7). There are the effect of the system parameters on HRV several types of commonly used HRVs (e.g., flat plate, performance14), the optimization strategy for ventilation15), rotary wheel, heat pipe, and run-around types8, 9)). and the effect of phase changes in heat exchangers16). A Conventional ventilators require two sets of inlet and series of papers that analytically evaluated the efficiency outlet air ducts to exchange energy simultaneously10). of heat recovery, with the inclusion of the effects of These air ducts and HRV systems are usually located condensation17) and frost formation18), were published. above the ceiling panel. Ductworks can be complicated Experiments were conducted for a parametric study on and troublesome when the building does not have enough sensible plate heat exchangers under condensation space above the ceiling panel11). conditions19, 20). As the inlet humidity level is increased, A new concept of HRV system has been proposed, the heat transfer rate was observed to increase with an namely alternating-current HRV (AC-HRV), which works increase in the amount of condensed water21, 22). A similar to human respiration12). During exhalation, the simplified numerical model for internal condensation, warm air heats the respiratory tract as it passes through it which can be used along with CFD calculations, has been whereas, during inhalation, cold outside air is warmed up proposed and applied to a flat-plate-type heat recovery - 221 -
EVERGREEN Joint Journal of Novel Carbon Resource Sciences & Green Asia Strategy, Vol. 08, Issue 01, pp221-228, March 2021

ventilator in partially wet conditions23). Table 2. Properties of thermal storage material
 There are only a few studies to investigate the heat Properties Value
transfer characteristics of a thermal storage medium for an Density, s 1958 kg/m3
AC-HRV system. Experiments have been done to validate Heat capacity, Cps 757 J/kg/°C
the cyclic heat transfer model for AC-HRVs only for dry Thermal conductivity, ks 36 W/m/°C
conditions24, 25).
 This paper numerically investigates the effect of water Table 3. Reference conditions
vapor condensation and evaporation on an AC-HRV Variables Value
thermal storage unit composed of mini square channels on
 Air velocity, U 5.24 m/s
the efficiency of the HRV.
 Mass flow rate of dry air, 0.065 kg/s
 Half-period, tp 120 s
2. Method
2.1 Thermal storage model Table 4. Indoor and outdoor temperature and humidity
 The thermal storage model used in this study is a Variables Value
collection of multiple square channels, as shown in Fig. 1. Indoor temperature, 22 °C
The channel walls are made of thermal storage material. A Outdoor temperature, 0 °C
charging process takes place during the first half-period Indoor relative humidity, 50%
(tp), and a discharging process follows with the flow Outdoor relative humidity, 50%
direction reversed for the next half-period; this continues
periodically and alternately. Table 1 shows the The reference operating conditions for this study are
specifications of the thermal storage unit. The thermal shown in Table 3. The air velocity corresponds to 200
storage material used in this study is made of aluminum CMH of HRV airflow rate. The half-period is 2 minutes.
oxide and silicon oxide(Al2O3 61%, SiO2 29.3%, MgO The indoor and outdoor conditions are shown in Table 4.
3.82%, TiO2 2.34%, Fe2O3 1.08%, CaO 1.08%), whose
properties are shown in Table 2. 2.2 Governing equations
 Assumptions have been made to derive governing
U 2tp Insulated wall
 equations as follows.
 tp t - Constant thermal properties of air and solid material
 - Uniform air velocity in a channel
 Charging Discharging
 D - Constant heat/mass transfer coefficients on surfaces
 Hot side (TH) Cold side (TC) - Negligible volume of condensed liquid water
 The mass balance and energy balance equations can be
 x
 L written as Eq. 1 and Eq. 212, 26). The heat and moisture
 transfer rates are positive for the cooling and condensation
 processes, and negative for the heating and evaporation
 processes.
 L
 (1)

 864 channels (2)
 D
 When hot and humid air passes over the surface of the
 thermal storage during a charging period, condensation
 a/2
 occurs on the surface when the solid temperature is below
 its dew-point temperature. During a discharging period,
 when cold and dry outdoor air passes over the warm and
 wet surface of thermal storage, the air is warmed and
 Fig. 1: Thermal storage unit for AC-HRV humidified by the evaporation from the surface. If the
 surface is dried out, only sensible heat transfer takes place.
 Table 1. Specifications of thermal storage unit Fig. 2 shows schematics of heat and moisture transfer
 Properties Value during the charging and discharging processes.
 Diameter, 0.15 m The boundary conditions for periodically repeated
 Length, L 1m charging and discharging processes are:
 Air passage, 3.4 mm - Charging process 0 ;
 Wall thickness, a 1 mm , 0 , 0 , 0
 Solid mass per unit length, Ms/L 13.8 kg/m
 - Discharging process 2 ;

 - 222 -
Thermal Performance of Alternating-Current Heat Recovery Ventilator in Partially Wet Conditions , , , supply air temperature varies periodically for AC-HRVs, it needs to be averaged over a discharging half-period. TSA TC T (6) i1 i2 TH TC W1 W2 condensate Likely, the enthalpy efficiency can be defined as in Eq. Ts Mw HEX wall Ms 726, 31). The enthalpy efficiency is the total efficiency of the HRV, which transfers both latent and sensible heat. The (a) Charging process enthalpy of the supply air is averaged over a discharging half-period as shown in Eq. 826, 31). iSA iC i (7) iH iC 1 2t p iSA iSA t dt (8) tp tp (b) Discharging process Fig. 2: Cooling and condensation during the charging process and heating and evaporation during the discharging process 3. Results and Discussion The efficiencies in dry and partially wet conditions are The heat transfer rate is calculated by the temperature compared for the given reference conditions by varying difference between the solid wall and the surrounding air system parameters one by one. Fig. 3 shows the as in Eq. 325,26). difference is appreciable, especially when the thermal q hA T Ts (3) storage unit is longer than 0.5 m. The longer the unit is, the greater the amount of condensation on its surfaces, The Reynolds number in a mini channel is within a which increases the enthalpy efficiency. As the length laminar range under the reference condition, and the increases, the solid temperature varies over a wide Nusselt number is known as 3.6127, 28) in a square channel range along the axial direction, and the heat transfer (Fig. 1) with constant heat flux. The surface heat transfer surface increases. coefficient is calculated from the definition of the Nusselt 1.0 number, ℎ ∙ / , where is the width of the Enthalpy efficiency square duct. 0.8 The mass transfer rate is calculated by the humidity ratio difference between the air stream and the saturated 0.6 wall surfaces using Eq. 430, 31). The mass transfer 0.4 coefficient is calculated from the Lewis analogy of heat ɳi condens and mass transfer29, 30). 0.2 ɳi noncondens 0.0 m w hd A W Wsat (4) 0.0 0.5 1.0 1.5 2.0 2.5 3.0 Length of thermal storage (m) The transient solid temperature is calculated by Fig. 3: Enthalpy efficiency for various lengths of considering the sensible and latent heat transfer rates thermal storage units (RHin=50%, Q=200 CMH) acquired from the air stream as in Eq. 530, 31). The heat conduction in the axial direction is neglected. 1.0 T Enthalpy efficiency M s c ps s q m wi fg (5) 0.8 ƞi condens t 0.6 ƞi noncondens 2.3 Efficiency 0.4 The heat and moisture accumulated on the solid surface during a charging process are released into the supply air 0.2 stream during a discharging process. After several cycles 0.0 of calculation, it reaches a cyclic steady state. 0 100 200 300 400 500 The temperature efficiency represents the heat recovery Airflow rate (CMH) efficiency of sensible heat. It is defined as the ratio of the Fig. 4: Enthalpy efficiency for various airflow rates indoor and outdoor temperature difference to the supply (RHin=50%, L=1 m) air temperature increase, as given by Eq. 620, 33). As the - 223 -
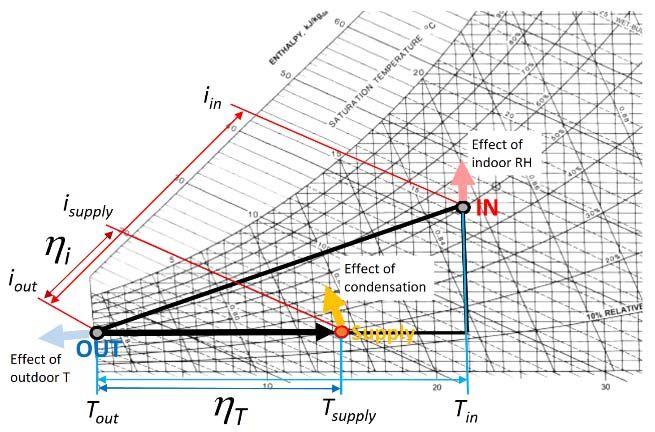
EVERGREEN Joint Journal of Novel Carbon Resource Sciences & Green Asia Strategy, Vol. 08, Issue 01, pp221-228, March 2021

 Figure 4 illustrates the effect of the airflow rate on
 1.0 ƞT Condens
enthalpy efficiency. As the airflow rate increases, the ƞT nonConds
efficiency decreases. The higher the airflow, the more ƞi Condens
 0.8 ƞi nonConds
moisture is entrained into the channel, and more
condensate should be produced35). However, increased

 Efficiency
 0.6
airflow increases the air velocity and reduces the time
duration for the air stream to interact with the channel 0.4
surface. Increased airflow rate affects the discharging
 0.2
process similarly. The slower the airflow, the more time
for moist air to condensate and evaporate, which results in 0.0
higher efficiency. -10 -8 -6 -4 -2 0 2 4 6 8 10
 The effect of indoor humidity level is shown in Fig. 5. Outdoor T (oC)
The enthalpy efficiency decreases as the indoor relative Fig. 7: Enthalpy and temperature efficiencies with respect to
humidity (RH) increases up to 50%, and remains nearly outdoor temperature
constant afterwards. This is because the enthalpy (RHin=50%, L=1 m, Q=200 CMH)
difference between indoor and outdoor air increases as the
indoor RH increases. The amount of water content in the In order to understand the physics of heat and mass
air also affects the amount of heat transfer34). However, for transfer inside the thermal storage unit, transient
RH over 50%, the enthalpy efficiency slightly increases temperature and moisture distributions are obtained for
due to the contribution of the latent heat of the water vapor charging and discharging processes at cyclic steady state.
recovered from the condensate water accumulated on Figure 7 shows the effect of the outside air temperature.
solid surfaces. Both the temperature and the enthalpy efficiencies are
 The temperature efficiency is nearly constant and nearly unaffected by the outdoor temperature for dry
decreases slowly as the condensation takes place. The conditions. For wet conditions, the temperature efficiency
latent heat contributes to increasing the enthalpy of the increases slightly, but the enthalpy efficiency decreases as
incoming outdoor air but reduces its temperature. The the outdoor temperature increases. The decreased outside
psychrometric chart in Fig. 6 explains the physical reasons air temperature increases the condensation rate, which
regarding the effects of the parameters on efficiencies. results in greater enthalpy efficiency. This simulation is
 carried out with a fixed RH of both outside and inside
 ƞT Condens (50%). The indoor temperature remains at 22°C.
 1.0
 ƞT nonConds Figure 8 shows the temperature progress that starts
 0.8
 ƞi Condens from a uniform initial temperature at 0ºC and then reaches
 ƞi nonConds cyclic steady state for the condensation case. It shows
 Efficiency

 0.6 variations of inlet and outlet air temperatures and average
 temperature. Compared to the somewhat linear increase in
 0.4 temperature for the non-condensation case shown in Fig.
 9, the temperature graphs show some curvatures. Even
 0.2
 though the final temperatures are not much different, the
 0.0 presence of condensation affects the temperature progress
 0 25 50 75 100 due to the latent heat involved in the processes of
 Indoor RH (%) condensation and evaporation. The efficiencies shown in
 Fig. 5: Enthalpy and temperature efficiencies with respect to the figures are obtained after initial transients fade out,
 indoor relative humidity (L=1 m, Q=200 CMH) usually after five cycles.

 25 x=0
 20
 Temperature (C)

 15
 10
 5 Avg
 x=1
 0
 0 120 240
 360 480 600 720
 Time (s)
 Fig. 8: Air temperature variations at inlet, outlet, and average
 for initial 3 cycles for the condensation case
Fig.6: Psychrometric chart showing the temperature efficiency
 and the enthalpy efficiency.

 - 224 -
Thermal Performance of Alternating-Current Heat Recovery Ventilator in Partially Wet Conditions

 afterward (t = 18 s) because the solid surface temperature
 25 becomes greater than the saturation temperature. At the
 x=0
 outlet (x = 1 m), the rate of condensation is much greater
 20
Temperature (C)

 than at the inlet starting from the beginning. It reaches the
 15 maximum at 56 s and decreases to nearly zero at the end
 10 of the charging process.
 Avg As soon as the discharging process starts, the
 5
 x=1 condensate water accumulated at the end is very rapidly
 0 evaporated because of the cold dry outdoor air. It takes
 0 360 120 480 240 600 720 only 16 s to dry out completely. On average, all the
 Time (s)
 condensate on the surface of the thermal storage unit is
 Fig. 9: Air temperature variations at inlet, outlet, and average completely evaporated at 152 s. Thereafter, only the
 for initial 3 cycles for the non-condensation case sensible heat transfers for the rest of the air supply process.
 Figure 13 shows the rate of condensation or evaporation
 Solid temperature variations are shown in Fig. 10 for along the axial direction at several different time steps. We
the condensation case and in Fig. 11 for the non- can see in the graph that at the initial stage (t = 1 s),
condensation case. Initially, the solid temperatures are condensation occurs at all the positions of the thermal
assumed to be 0°C at any location. With the same initial storage unit until the air exits the channel. At 30 s, there is
conditions, the temperature changes are smoother for the no condensation or evaporation up to x = 0.14 m. As time
non-condensation case compared to the condensation case. goes on, the dry front moves from the inlet to the right.
However, this does not really affect the temperature When the flow direction is reversed at 120 s, evaporation
changes and air enthalpy changes that pass through the occurs only in the range of 0.62 m < x < 0.8 m at 150 s.
thermal storage, which are the core of all the processes in
this HRV.
 1.5
 Mass transfer rate (g/m/s)

 25
 20 x=0 m x=0.5
 Temperature (oC)

 15 0.0
 x=0 120 Avg 240
 10
 Avg
 5 x=1 m -1.5
 0
 0 120 360240 480 600 720 x=1
 Time (s)
 Fig. 10: Solid temperature variations of the thermal storage -3.0
 unit during initial 3 cycles for the condensation case Time (s)
 Fig. 12: The rate of condensation (or evaporation) on
 25 solid surface over one cycle.
 20 x=0 m
 Temperature (oC)

 0.75
 Mass transfer rate (g/m/s)

 15 t=1 s
 10 Avg t=180 s t=30 s t=60 s
 0.0
 5 x=1 m 0.5 1
 0
 t=150 s
 0 120 240 360 480 600 720 -0.75 t=90 s t=120 s
 Time (s)

 Fig. 11: Solid temperature variations of the thermal storage
 -1.5 Position (m)
 during initial 3 cycles for the non-condensation case

 Figure 12 shows the moisture transfer rate to and from Fig. 13: The rate of condensation (or evaporation) on solid
the solid surface at several locations (x = 0, 0.5, 1 m, and surface along the x-direction at various time steps.
average) during one period after cyclic steady state is
reached. Positive values mean condensation, and negative Figure 14 shows the accumulated amount of condensate
values mean evaporation. At the inlet (x = 0 m), water remaining on the surface of the thermal storage for
condensation occurs at the beginning of the charging one cycle. At the center (x = 0.5), the accumulated mass
process, and then the condensate evaporates immediately reaches a peak at 60 s and it runs out at 128 s. At the outlet

 - 225 -
EVERGREEN Joint Journal of Novel Carbon Resource Sciences & Green Asia Strategy, Vol. 08, Issue 01, pp221-228, March 2021

(x = 1), it reaches a peak at the end of the charging process
and decreases rapidly as soon as the discharging process 25

 Total water mass condensed (g)
 Charging
starts. The maximum amount of water mass is 0.33 g/m at
 Discharging
x = 1 m and t = 120 s, which corresponds to 2.67 μm in 20
layer thickness. The thickness is small enough so as
neither to create liquid flows in the thermal storage unit 15
nor affects the airflow over the surface. One of the
advantages of using AC-HRV is the condensed water is 10
not steadily accumulated but dries out periodically within
a cycle. A water drain is not required for most indoor and 5
outdoor conditions.
 The accumulated amount of condensate water is 0
redrawn along the solid surface in Fig. 15. We can see 0 30 60 90 120 150 180 210 240
from the graph that the condensate seems moving from Time (s)
left to right, as time goes. At the end of the charging
process (t = 120 s) condensate remains only at the right Fig. 16: Total mass present inside heat exchanger element
half of the thermal storage. It increases to its peak at the during charging and discharging processes
end of the thermal storage (x = 1 m). Then all the
condensate is evaporated in the exhaust process and 4. Conclusions
decreases until it runs out at 152 s. This explains the
previous observations in Fig. 3 where the longer the A simple condensation model has been developed and
thermal storage, the greater the efficiency. Because the successfully applied to simulate heat and moisture transfer
longer the thermal storage, the greater the condensate and to calculate the enthalpy and temperature efficiencies
produced in the exhausting process which is then returned for partially wet conditions inside the AC-HRV system.
to the air that enters the room in the air supply process. Following conclusions can be drawn from the transient
 Figure 16 shows total water mass condensed in the heat heat and moisture analysis in an AC-HRV:
exchanger element during charging and discharging 1. As the length of the thermal storage unit
processes. It shows a maximum of 14.5 g at around 80s increases and the airflow rate decreases, the enthalpy
and a sharp decrease after 120s. efficiency increases.
 2. The process of condensation and evaporation
 causes latent heat transfer in addition to sensible heat
Accumulated mass (g/m)

 transfer. As the amount of condensation/evaporation
 increases, the enthalpy efficiency increases and the
 30
 Fig. 14: Accumulated mass of water
 x=1 condensed on solid temperature efficiency decreases compared to the
 surface over one cycle. equivalent dry conditions.
 x=0.5
 15 3. As the total amount of water condensed is not
 significant enough during a charging process, all the
 x=0 Avg condensate is dried out completely at the beginning of the
 0 discharging process for the proposed AC-HRV system.
 0 120 240 Further research need to be conducted for various
 Time (s) system parameters to apply to real applications.
 Fig. 14: Accumulated mass of water condensed on solid
 surface over one cycle. Acknowledgements
 Accumulated mass (g/m)

 t=120 s This work was supported by the Basic Science
 30 t=90 s Research Program through the NRF funded by the
 t=125 s Ministry of Education (2016R1D1A1B01009625) and
 t=60 s Kookmin University.
 15
 t=135 s
 t=30 s Nomenclature
 t=1 s t=150 s
 0 Internal surface area per length (m2/m)
 0 0.5 1
 a Wall thickness of mini channel (m)
 Position (m)
 Specific heat capacity (J/kg/K)
 Fig. 15: Accumulated mass of water condensed on solid Diameter of thermal storage unit (m)
 surface along the x-direction. ℎ Heat transfer coefficient (W/m2/oC)

 - 226 -
Thermal Performance of Alternating-Current Heat Recovery Ventilator in Partially Wet Conditions

 ℎ Mass transfer coefficient (kg/m2/s) 10.5109/2349297.
 4) ASHRAE, “Ventilation for acceptable indoor air
 Enthalpy (J/kg)
 quality,” ANSI/ASHRAE Standard 62.1, 2016.
 Length of thermal storage unit (m) 5) K. Ito, “Micro- and macro-scale measurement of
 Moisture condensed per length (kg/m) fungal growth under various temperature and
 Mass flow rate per length (kg/s/m) humidity conditions,” Evergreen, 1 (1) 32-39 (2014).
 doi: 10.5109/1440974.
 Heat transfer rate per length (W/m) 6) Y.E. Fouih, P. Stabat, P. Rivière, P. Hoang, and V.
 Q Volume airflow rate (CMH) Archambault, “Adequacy of air-to-air heat recovery
 Relative humidity (–) ventilation system applied in low energy buildings,”
 Temperature (oC) Energy and Buildings, 54 29-39 (2012). doi:
 10.1016/j.enbuild.2012.08.008.
 Time (s)
 7) H. Han, M. Hatta, and H. Rahman, “Smart ventilation
 Half-period (s) for energy conservation in buildings,” Evergreen, 6
 Air velocity (m/s) (1) 44-51 (2019). doi: 10.5109/2321005.
 8) A. Mardiana-Idayu, and S.B. Riffat, ”Review on heat
 Coordinate (m)
 recovery technologies for building applications,”
 Width of mini channel (m) Renew. and Sust. Energy Reviews, 16 (2) 1241-1255
 W Humidity ratio (kgw/kgair) (2012). doi: 10.1016/j.rser.2011.09.026.
 9) Q. Xu, S. Riffat, and S. Zhang, “Review of heat
 recovery technologies for building applications,”
Greek symbols Energies, 12 (7) 1285-1307 (2013). doi:
 Density (kg/m3) 10.3390/en12071285.
 Efficiency (–) 10) H. Manz, and H. Huber, “Experimental and numerical
 study of a duct/heat exchanger unit for building
 ventilation,” Energy and Buildings, 32 (2) 189-196
Subscripts (2000). doi: 10.1016/S0378-7788(00)00043-8.
 1 inlet 11) A. Novoselac, and J. Srebric, “A critical review on the
 2 outlet performance and design of combined cooled ceiling
 and displacement ventilation systems,” Energy and
 a dry air
 Buildings, 34 (5) 497-509 (2002). doi:
 C cold 10.1016/S0378-7788(01)00134-7.
 fg fluid-gas 12) H. Han, and Y.I. Kwon, “Inhaling/exhaling heat
 recovery ventilator using the concept of AC
 H hot
 ventilation,” Proc.Indoor Air, 976-981 (2005).
 s solid (thermal storage) 13) H. Han, and Y.I. Kwon, “Inhaling/exhaling heat
 SA supply air recovery ventilator using the concept of alternating-
 saturated current ventilation,” HVAC&R Research, 12 (3c) 483-
 sat
 459 (2006). doi: 10.1080/10789669.2006.10391212.
 w liquid water 14) A. Mardiana, and S.B. Riffat, “Review on physical
 and performance parameters of heat recovery systems
 for building applications,” Renew. and Sust. Energy
 References Reviews, 28 (2) 174-190 (2013). doi:
1) N.E. Klepeis, W.C. Nelson, W.R. Ott, J.P. Robinson, 10.1016/j.rser.2013.07.016.
 A.M. Tsang, P. Switzer, J.V. Behar, S.C. Hern, and 15) O. SeppȨnen, “Ventilation strategies for good indoor
 W.H. Engelmann, “The national human activity air quality and energy efficiency,” Int. J. Ventilation,
 pattern survey (nhaps): a resource for assessing 6 (4) 297-306 (2008).
 exposure to environmental pollutants,” J. Exp. Sci. & doi: 10.1080/14733315.2008.11683785.
 Env. Epidemiology, 11 231–252 (2001). doi: 16) J. Fernández-Seara, R. Diz, F.J. Uhía, A. Dopazo, and
 10.1038/sj.jea.7500165. J.M. Ferro, “Experimental analysis of an air-to-air
2) D.P. Wyon, “The effects of indoor air quality on heat recovery unit for balanced ventilation systems in
 performance and productivity,” Indoor Air, 14 (7) 92– residential buildings,” Energy Conv. and Manage., 52
 101 (2004). doi: 10.1111/j.1600-0668.2004.00278.x. (1) 635-640 (2011). doi:
3) M.H. Mahmood, M. Sultan, and T. Miyazaki, “Study 10.1016/j.enconman.2010.07.040.
 on water-vapor adsorption onto polymer and carbon 17) C.J. Simonson, and R.W. Besant, “Energy wheel
 based adsorbents for air-conditioning applications,” effectiveness: part I—development of dimensionless
 Evergreen, 6 (3) 215-224 (2019). doi: groups,” Int. J. Heat and Mass Transfer, 42 (12)

 - 227 -
EVERGREEN Joint Journal of Novel Carbon Resource Sciences & Green Asia Strategy, Vol. 08, Issue 01, pp221-228, March 2021

 2161-2170 (1999). doi: 10.1016/S0017- 879-884 (2005). doi:
 9310(98)00325-1. 10.1016/j.ijthermalsci.2005.03.006.
18) T.R. Nielsen, J. Rose, and J. Kragh, “Dynamic model 30) L. Xia, M.Y. Chan, S.M. Deng, and X.G. Xu, “A
 of counter flow air to air heat exchanger for comfort modified logarithmic mean enthalpy difference
 ventilation with condensation and frost formation,” (LMED) method for evaluating the total heat transfer
 App. Thermal Eng., 29 (2–3) 462-468 (2009). doi: rate of a wet cooling coil under both unit and non-unit
 10.1016/j.applthermaleng.2008.03.006. Lewis Factors,” Int. J. Thermal Sciences, 48 (11)
19) S.H. Nam, and H. Han, “Computational modeling and 2159-2164 (2009). doi:
 experimental validation of heat recovery ventilator 10.1016/j.ijthermalsci.2009.04.002.
 under partially wet conditions,” App. Thermal Eng., 31) S.K. Wang, “Handbook of air conditioning and
 95 229-235 (2016). doi: refrigeration 2nd ed.,” McGraw-Hill Education, 2001.
 10.1016/j.applthermaleng.2015.11.023. 32) S. Sugarman, “HVAC Fundamentals,” The Fairmont
20) H. Han, S.H. Nam, and G.S. Han, “Effect of Press, 2005.
 condensation on the efficiency of heat recovery 33) ASHRAE, “Air-to-air energy recovery,” ASHRAE
 ventilators for broiler houses,” Int. J. Air-Cond. and Handbook: HVAC Systems and Equipment Chap. 26,
 Refrig., 21 (2) 009-019 (2013). doi: 2012.
 10.1142/S2010132513500090. 34) I. Yaningsih, M.H. Mahmood, A.T. Wijayanta, T.
21) M.I. Nizovtsev, V.Y. Borodulin, and V.N. Letushko, Miyazaki, and S. Koyama, “Experimental study on
 “Influence of condensation on the efficiency of dehumidification technology using honeycomb
 regenerative heat exchanger for ventilation,” App. desiccant block,” Evergreen, 5 (2) 11-18 (2018). doi:
 Thermal Eng., 111 997-1007 (2017). doi: 10.5109/1936212.
 10.1016/j.applthermaleng.2016.10.016. 35) B. Bakthavatchalam, K. Rajasekar, K. Habib, R.
22) B.H. Jeon, J.W. Kim, S.K. Lee, Y.J. Lee, and Y.C. Ahn, Saidur, and F. Basrawi, “Numerical Analysis of
 “A study on the dew condensation according to the Humidification Dehumidification Desalination
 operational conditions of a heat-recovery ventilator,” System,” Evergreen, 6 (1) 9-17 (2019). doi:
 Kor. J. Air-Cond. and Ref. Eng., 25 (10) 529-533 10.5109/2320996.
 (2013). doi: 10.6110/KJACR.2013.25.10.529.
23) H. Han, and M.W. Shin, “A study on heat recovery
 characteristics of porous media according to periodic
 oscillating flows,” Kor. J. Air-Cond. and Ref. Eng., 19
 (2) 175-182 (2007).
24) A.A. Farizi, and H. Han, “Effect of parameters of
 thermal storage unit for alternating current heat
 recovery ventilator,” Proc. Summer Conf. of Soc. of
 Air-Cond. and Ref. Eng. of Korea, 6 630-633 (2019).
25) H. Han, and M.W. Shin, “A study on heat recovery
 characteristics of porous media according to periodic
 oscillating flows,” Kor. J. Air-Cond. and Ref. Eng., 19
 (2) 175-182 (2007).
26) F.C. McQuiston, J.D. Parker, and D.J. Splitler,
 “Heating, ventilating, and air conditioning : analysis
 and design 6th ed.,” John Wiley and Sons, 2005.
 https://books.google.co.kr/books?id=V_C-
 DwAAQBAJ&printsec=frontcover&hl=id#v=onepa
 ge&q&f=false.
27) T.L. Bergman, “Fundamentals of heat and mass
 transfer 8th ed.,” John Wiley and Sons, 2011.
 https://books.google.co.kr/books?id=vvyIoXEywMo
 C&printsec=frontcover&hl=id#v=onepage&q&f=fal
 se.
28) Y.A. Cengel, and A.J. Ghajar, “Heat and mass transfer
 5th ed.,” McGraw-Hill Education, 2015.
 https://books.google.co.kr/books?id=B89MnwEAC
 AAJ&dq=editions:ISBN9814595276&hl=id.
29) J.C. Kloppers, and D.G. Kröger, “The Lewis factor
 and its influence on the performance prediction of
 wet-cooling towers,” Int. J. Thermal Sciences, 44 (9)

 - 228 -
You can also read